行政院國家科學委員會專題研究計畫 期中進度報告
高三酸甘油酯/低高密度脂蛋白膽固醇之家族遺傳研究
(2/3)
計畫類別: 個別型計畫 計畫編號: NSC91-2314-B-002-202-執行期間: 91 年 08 月 01 日至 92 年 07 月 31 日 執行單位: 國立臺灣大學醫學院內科 計畫主持人: 簡國龍 計畫參與人員: 許秀卿 李源德 報告類型: 精簡報告 處理方式: 本計畫可公開查詢中
華
民
國 92 年 5 月 29 日
行政院國家科學委員會專題研究計畫成果報告
高三酸甘油酯/低高密度脂蛋白膽固醇之家族遺傳研究
(II)
Family genetic studies of hyper tr iglycer idemia and low
HDL-cholester ol
(II)
計畫編號:
91-2314-B-002-202執行期限:91 年 8 月 1 日至 92 年 7 月 31 日
主持人:簡 國 龍
臺大醫院 Email: [email protected]共同主持人:
許 秀 卿臺大醫院
計畫參與人員:
李 源 德臺大醫 院 一、中文摘要 背 景 及 目 的 : Apo AI-CIII-AIV (ApoA1/C3/A4) 基因簇集是位在染色體第 11 對上,超過 10 個以上的基因多型性被報 告與 Triglyceride 及 HDL cholesterol 有關。 材料與方法:以金山社區一般族群作為研 究對象,在總共男性 388 人,女性 435 人, 平均 38 歲,由共 116 個家族組成的成員, 包括 ApoA1 (-75) MspI G/A substitution 及 Apo A1 (+83) C->T 及 Apo C3 (+3175) SacI C->G,Apo C3 (+3206) T->G 及 Apo A4 (+347) A->T 共五個基因型。在分析有家族 聚集的案例,由於考慮家族成員彼此有相 關存在,並非為獨立的樣本,因此不能以 傳統的統計分析,而非利用考量資料相關 的 統 計 方 法 , 如 一 般 化 估 計 方 程 式 (Generalized Estimation Equation, GEE)來 化解資料彼此不獨立的難題。根據以兩種 分析方法 (連續性變數及極端族群變項)不 同的遺傳模式(無母數、顯性、隱性及累加 性遺傳模式)。 結果:在基因型分佈上 Apo A1 (+83)的 T allele 多型性最少(2.9%),其他多型性分佈 均為 0.3~0.7 之間。根據估計的方法推算其 分佈頻率與檢定這五個基因型的單股體是 否為彼此獨立或有相關性的統計量呈現統 計上的差異(卡方檢定值為 678.82,自由度 為 26,P<0.00001),推論此五個標識有連 鎖不平衡(linkage disequilibrium)。其中 3 種 haplotypes 超過 20%,分別是(ACCCGA), (GCGGT) 及 (GCCTA),分別有 27.8%、 25.5%及 20.3%。進一步我們比較兩兩之間 連鎖不平衡(pair-wise linkage disequilibrium)的狀況,此基因簇集的 5 個 基因型彼此的連鎖不平衡有明顯的差距, 其中 Apo C3 (+3206) 其他的基因型連鎖係 數最低(介於 0.04~0.33 之間)。 與血脂值相關研究結果顯示,以極端組別 分析之下,Apo A4(+347)與 TG/HDL,Apo A1 (+83)與 HDL-cholesterol,ApoA1 (-75) 與 TG 的濃度有相關。而以連續變數分析 之下,Apo A4(+347)與 log TG/HDL,Apo
A1 (+83)與 log TG/HDL 值,Apo A1 (+83) 與 HDL-cholesterol,Apo A4(+347)與 log TG 濃度有相關,而 Apo C3 (+3175)僅在 Nonparametric(非母數模型)之下與 log TG 有相關。以 Apo AI/CIII/AIV 基因簇集上的 五個基因座的連鎖不平衡分析,進而了解 其單股體分佈的情形,對族群中單股體的 分佈頻率及連鎖不平衡的狀況提供實際的 資料。 結論:以 Apo AI-CIII-AIV 基因簇集上的五 個基因座的連鎖不平衡分析,進而了解其 單股體分佈的情形,對族群中單股體的分 佈頻率及連鎖不平衡的狀況提供華人的資 料。 關鍵詞:脂蛋白元 AI-CIII-AIV 基因簇集, 三酸甘油酯,高密度脂蛋白膽固醇,連鎖 不平衡,單股體 Abstract
Background & Objectives: Individual
polymorphism in apolipoprotein
AI-CIII-AIV gene clusters was associated with dyslipidemia. But there were scanty data on linkage disequilibrium, haplotypes of multiple loci and quantitative trait loci (QTL) studies on triglyceride (TG) and HDL
cholesterol traits among ethnic Chinese. We investigated genetic association studies on 5 polymorphisms, including ApoA1(-75)G->A, ApoA1(+83)C->T, C3(+3175)C->G,
ApoC3(+3206)T->G and ApoA4(+347)A->T and TG/HDL in Taiwan.
Mater ials & Methods: Total 388 males and
435 females (average 38 years old) from 116 families in the Chin-Shan Community were sampled. Allelic association and haplotype frequency were estimated and tested if linkage disequilibrium existed. Pair-wise disequilibrium coefficients were estimated by EM algorithm. For QTL, we used the quintile extreme group analyses; i.e. above the 80th percentile or below the 20th percentile of lipid profiles to estimate odds ratio (OR) and 95% confidence interval (CI). We applied the generalized estimation equation to handle non-independence problems among family members, and tested the significance level under various inheritance modes, including nonparametric, dominant, recessive or additive modes. Also, we used quantitative trait analyses to evaluate adjusted mean
values of three genotypes in each locus.
Results: Among the 5 loci, Apo A1(+83)T
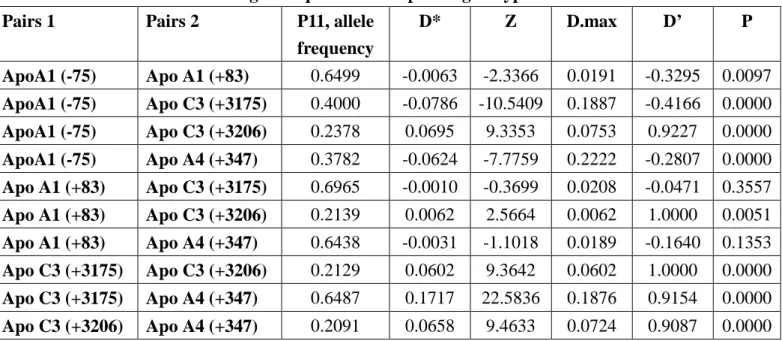
allele was the least allele frequency (2.9%). There were strong linkage disequilibrium among these 5 loci (chi-square=678.82, df=26, P<0.00001). There were 3 haplotype frequencies more than 20%, i.e., (ACCCGA), (GCGGT) and (GCCTA). Pair-wise linkage disequilibrium coefficients showed that Apo C3(+3206) had lowest coefficients (from 0.04 to 0.33), indicating Apo C3
polymorphism had longer evolution history than other loci. In extreme group analyses, Apo A1(-75)G polymorphism was associated with TG concentration (OR=2.72,
CI=1.10-6.69, under recessive mode); Apo A1 (+83) with HDL (OR=2.65, CI=1.08-6.49, under additive mode); Apo A4(+347) with TG/HDL (OR=0.45, CI=0.22-0.92, under recessive mode).
Conclusion: These findings established that
significant allelic association of 5 loci in the Apo AI/CIII/AIV gene cluster, and there were 3 haplotype frequencies more than 20% in ethnic Chinese. Also the evidence
supported the contribution of common genetic variation on this gene cluster to quantitative TG and HDL phenotypes in the general population.
Keywor ds:Apolipoprotein AI-CIII-AIV
gene cluster, triglyceride, HDL-cholesterol, linkage disequilibrium, haplotype
二、緣由與目的
Apo A-I/C-III/A-IV 基因簇集是位於染色體 第 11 對上,已有很多文獻報告與三酸甘油 酯及高密度膽固醇的濃度有關。在 1985 年,Karathanasis S.K. 利用 DNA fragment 的 Hybridization studies,證實此一基因簇 集 Apo A1/C3/A4 基因簇集 (gene cluster)(1)。其中 Apo C-III 基因佔 3.1kb 長 度,在 Apo A-I (長度 1.8kb)的 3’末端之下 2.5kb 處,而在 Apo A-IV(長度 2.6kb) 5’端 上游約 5kb 的位置。Apo A-I 及 A-IV 轉譯 是由相同的方向,而 Apo C-III 基因則是相 反方向。超過 10 個以上的基因多型性已在 A-I/C-III/A-IV 基因簇集上發現(2)。傳統的 案例對照方法以健康控制組的研究提供線 索。以 G(-75)A 的多型性與 HDL-C 及 ApoA1 有關(3)。在 ApoA1 的+83bp 處有-(C →T)的多型性 M2+/+及 M2+/-表示,也是被
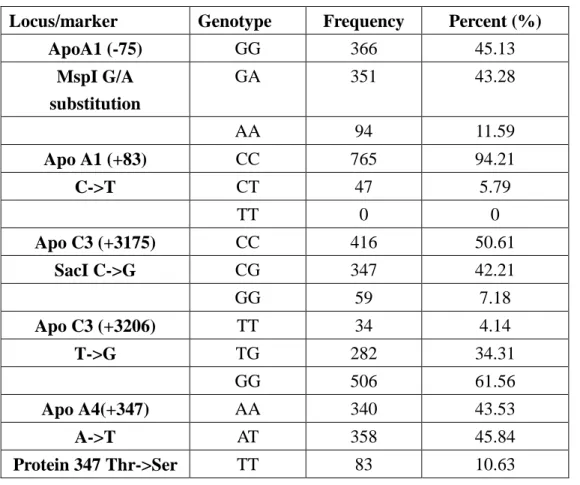
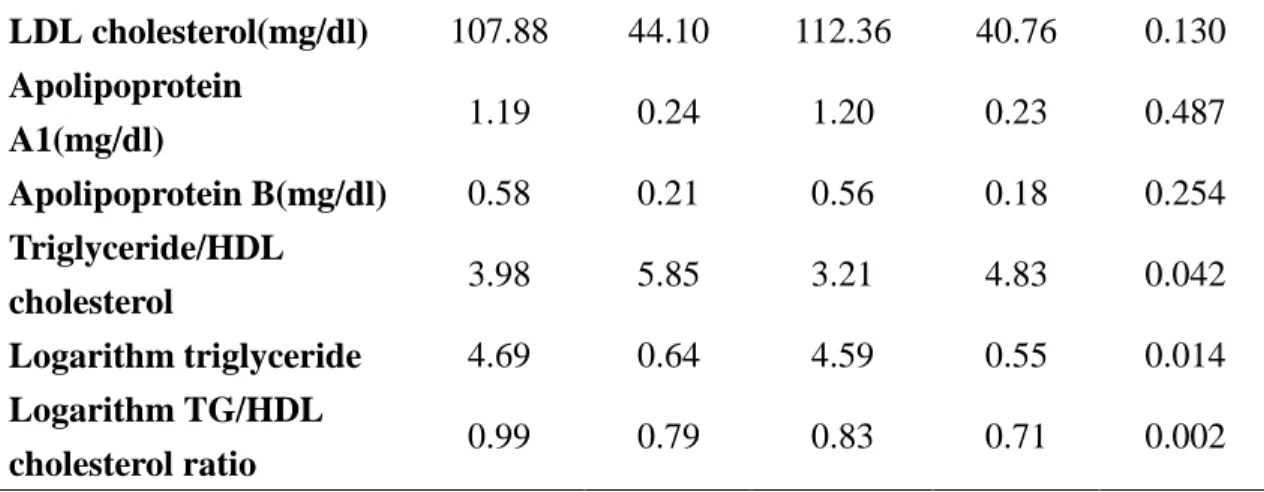
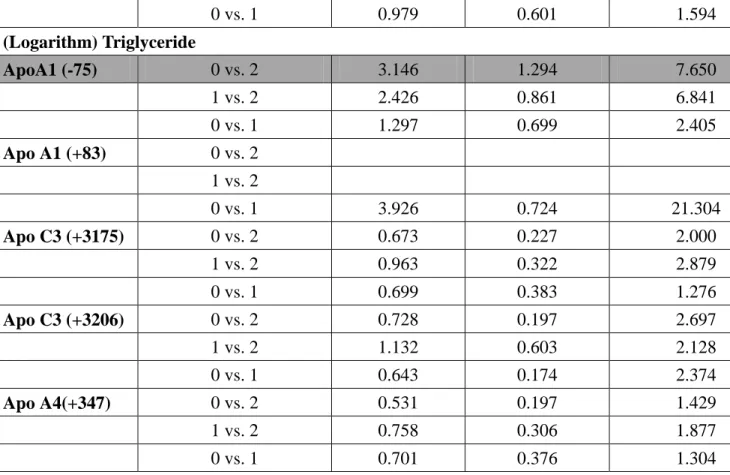
報告與 HDL-C 有關(4-6)。在 ApoC III 基因 上的 3’ untranslated 部分有-Sst I RFLP 及在 ApoC3 有-PuvII,分別在 3175 及 3206 位置 的核甘酸序列的多型性表現。有一為 triglyceride (TG)的變化 Apo CIII 中 3175 位置上為 Sac I C→G 的差異,另一個變異 為 3206 位置上為 T→G 的變異,為另一新 的變異,上述兩種變異均是在 exon4 位置 上,均與三酸甘油酯有關,因此本研究即 以此兩種多型性為研究對象(7)。在 Apo AIV 的突變最常見是 A-IV-1,由 A→T 取 代,造成蛋白質位置 347 由 Thr 變成 Ser(8)。此 Apo A1(-75), Apo A1(+83), Apo C3 (+3175), Apo C3(+3206) 與 Apo A4(+347)為本研究的興趣基因。 三、結果與討論 以金山社區一般族群作為研究對象,在總 共男性 388 人,女性 435 人,平均 38 歲, 由共 116 個家族組成的成員,以 ApoA-I/C-III/A-IV 此一基因簇集常見的 5 個位址上基因多型性的研究,包括 ApoA1 (-75) MspI G/A substitution 及 Apo A1 (+83) C->T 及 Apo C3 (+3175) SacI C->G,Apo C3 (+3206) T->G 及 Apo A4 (+347) A->T 共五 個基因型。在基因型分佈上,在此研究族 群中以 Apo A1 (+83)的多型性最少,並無 homogenous genotype (M2, -/-)。其他則是有 3 個基因型分佈。其 allele frequency 估計如 表一,其中以 Apo A1 (+83) T allele frequency 最低(0.029),其他多型性分佈均 為 0.3~0.7 之間。 在一共有 32 個可能的單股體(haplotypes), 根據估計的方法推算其分佈頻率為表二 (9;10)。而檢定這五個基因型的單股體是否 為彼此獨立或有相關性的統計量呈現統計 上的差異,(卡方檢定值為 678.82,自由度 為 26,P<0.00001),因此我們可以推論此 五個標識有連鎖不平衡(linkage disequilibrium)。而其中有 8 種 haplotypes 頻率超過 1%,有 3 種 haplotypes 超過 20%, 分別是(ACCCGA), (GCGGT) 及 (GCCTA,分別有 27.8%、25.5%及 20.3%。 進一步我們比較兩兩之間連鎖不平衡 (pair-wise linkage disequilibrium)的狀況,分 別以連鎖不平衡係數,連鎖不平衡指數(即 係數與最大值之比)與 P11 的 haplotypes 頻 率表示(表三之一),在此基因簇集的 5 個基 因型彼此的連鎖不平衡有明顯的差距,其 中 Apo C3 (+3206) 其他的基因型連鎖係數 最低(介於 0.04~0.33 之間),其相對應的 P 值則在表三之二。 基因型與連續變數的表現型之相關研究, 我們可以採取四種不同的模型,即假設為 (1)自體顯性(autosomal dominant)模型; (2) 自體隱性(autosomal recessive)模型,(3)累 加性(additive)模型, (4)無母數 (nonparametric)遺傳模式。以(A 及 B)兩種 allele 而言 基因型(AA,AB,BB),若是 A 是帶病基因,則顯性遺傳模式的 penetrance(穿透率)即為(1,1,0),而隱性 遺傳為(1,0,0),而累加模型則為(2,1, 0),另外若不假設遺傳模型,則是以 BB 為 基礎,分別估計 AB 及 AA 比上 BB 對於疾 病的危險,即分別估計 AA vs. BB, AB vs. BB 及 AA vs. AB 的估計值及相對應的信 賴區間。根據以兩種分析方法 (連續性變 數及極端族群變項)不同的遺傳模式(無母 數、顯性、隱性及累加性遺傳模式),對血 脂值,特別是 log TG HDL,log TG 及 HDL,TG 四項變數作表格分析。性狀的順 序為:log TG/HDL ratio→TG/HDL→log TG →HDL→TG; 依無母數遺傳模式,顯性、 隱性及累加性模式分析。 結果顯示以各種脂質濃度為表現型。首 先,各種在男女性別的差異上,明顯在女 性有較高的總膽固醇,HDL-C,而男性有 較高的三酸甘油酯,TG/HDL 比率,取對 數後的 TG 及 TG/HDL 值。在年齡,LDL, Apolipoprotein A1 及 Apolipoprotein B 值則 無明顯的差異。(Table 4) 再用連續性及極端組別分析比較,結果顯 示以極端組別分析之下,Apo A4(+347)與 TG/HDL,Apo A1 (+83)與 HDL,ApoA1 (-75)與 TG 的濃度有相關。而以連續變數 分析之下,Apo A4(+347)與 log TG/HDL, Apo A1 (+83)與 log TG/HDL 值,Apo A1 (+83)與 HDL-cholesterol,Apo A4(+347)與 log TG 濃度有相關,而 Apo C3 (+3175)僅 在 Nonparametric(非母數模型)之下與 log TG 有相關。(Table 5-Table 6) 在 ApoA1 MspI G/A substitution(取代)的基因多型 性,在本研究族群並無明顯的相關係,與
之前的文獻報告有類似的情形,可能的原 因可能是族群異質性。 在分析有家族聚集的案例,由於考慮家族 成員彼此有相關存在,並非為獨立的樣 本,因此不能以傳統的統計分析,而非利 用考量資料相關的統計方法,如一般化估 計方程式(Generalized Estimation Equation, GEE)來化解資料彼此不獨立的難題
(11;12),同時在計量 95th 信賴區間時,使 用 profile likelihood confidence interval 會比 傳統的 Wald 信賴區間來的正確,特別是在 小樣本的狀況之下,因此我們均採用此一 信賴區間表示(13)。在家族資料樣本中, Tregoutet et al 建議使用 GEE 的方法,研究 發現在相同成員數目的核心家庭之下,利 用 GEE 計算的效力與最大概似值的效力是 相等,與相同數目的無相關性樣本有相同 的效力。但是假如家族成員數目不太大 (n<50),則 type I error 可能有增大的危險 (14)。 相關分析可以連續變數值當作表現型,即 利用類似 ANOVA 的方法亦可將資料分成 五等分,其極端族群(extreme group)作列聯 表分析,此種極端族群分析的方法在手足 配對(affected sibpair)連鎖分析(linkage analysis)證明有用,且有較高 power (15), 而在相關分析中也能適用(16),效力(power) 及可行性上均是有較好的優點,特別是樣 本較多的情況下。使用極端族群的分析要 注意偵測的目的是找控制極端性狀,而非 原先的連續變數,因此在解釋上必須與連 續變數性狀的結果作區別,此種以極端族 群值方法,
類似為 truncated measured genotype (TMG) 檢定,此種檢定被證明比 ANOVA 及一般 linear 線性迴歸來得有效力,值得一試。但 文獻上對於以表現型性狀是二項式及連續 性變數的結果並非一致,主要的理由是因 為在複雜性狀的基因影響效力較少,很難 明顯偵測到它的作用。系統分析 (meta-analysis)可以提供一綜合性的分析 (17),但也會受限在其出版偏差(publication bias)的難題上。 四、計畫成果自評 以 Apo AI-CIII-AIV 基因簇集上的五個基 因座的連鎖不平衡分析,進而了解其單股 體分佈的情形,對族群中單股體的分佈頻 率及連鎖不平衡的狀況提供實際的資料。 進一步以家族資料作此五個基因座的多型 性與 TG/HDL 值的相關研究中,一方面考 慮家族成員的互相關連性的現象,以一般 性估計方程式來處理統計上的難是。另一 方面在不同的遺傳模型的假設之下,如自 體顯性遺傳、隱性遺傳、累加性遺傳以及 非母數遺傳模式下作分析,最後則在性狀 上以連續變數及極端族群分組方式來處 理,得到的結果也確實看到此五個基因座 與 TG/HDL 有統計上相關的結果。在新的 一年計畫,則是進一步利用連續分析,特 別注著在 QTL(Quantitative trait loci)的研 究,期望提供有關此 Apo AI-CIII-AIV 基因 座國人與血脂質之間相關的證據。
五、參考文獻
(1) Talmud PJ, Xu CF. Molecular biology of apolipoproteins: control of gene expression and structure-function relationship. In: Betteridge DJ, Illingworth DR, Shepherd J, editors. Lipoproteins in health and disease. London: Arnold Publisher, 1999: 181-197.
(2) Kessling AM, Rajput-Wiliams J, Bainton D, Scott J, Miller NE, Baker I, Humphries SE. DNA polymorphisms of the apolipoprotein AII and AI-CIII-AIV genes: a study in men selected for differences in high-density-lipoprotein cholesterol concentration. Am J Hum Genet 1988; 42(3):458-467.
(3) Mata P, Lopez-Miranda J, Pocovi M, Alonso R, Lahoz C, Marin C, Garces C, Cenarro A, Perez-Jimenez F, de Oya M, Ordovas JM. Human apolipoprotein A-I gene promoter mutation influences plasma low density lipoprotein cholesterol response to dietary fat saturation. Atherosclerosis 1998;
137(2):367-376.
(4) Larson IA, Ordovas JM, Barnard JR, Hoffmann MM, Feussner G, Lamon-Fava S, Schaefer EJ. Effects of apolipoprotein A-I genetic variations on plasma apolipoprotein, serum lipoprotein and glucose levels. Clin Genet 2002; 61(3):176-184.
(5) Pulkkinen A, Viitanen L, Kareinen A, Lehto S, Laakso M. MspI polymorphism at +83 bp in intron 1 of the human apolipoprotein A1 gene is associated with elevated levels of HDL cholesterol and apolipoprotein A1 in nondiabetic subjects but not in type 2 diabetic patients with coronary heart disease. Diabetes Care 2000; 23(6):791-795.
(6) Tsai MY, Hanson NQ, Copeland KR, Beheshti I, Garg U. Determination of a T/G polymorphism at nucleotide 3206 of the
apolipoprotein C III gene by amplification refractory mutation system. Clin Chem 1994; 40(12):2235-2239.
(7) Lopez-Miranda J, Jansen S, Ordovas JM, Salas J, Marin C, Castro P, Ostos MA, Cruz G, Lopez-Segura F, Blanco A, Jimenez-Pereperez J, Perez-Jimenez F. Influence of the SstI polymorphism
at the apolipoprotein C-III gene locus on the plasma low-density-lipoprotein-cholesterol response to dietary monounsaturated fat. Am J Clin Nutr 1997; 66(1):97-103.
(8) Jansen S, Lopez-Miranda J, Salas J, Ordovas JM, Castro P, Marin C, Ostos MA, Lopez-Segura F, Jimenez-Pereperez JA, Blanco A, Perez-Jimenez F. Effect of 347-serine mutation in apoprotein A-IV on plasma LDL cholesterol response to dietary fat. Arteriosclerosis, Thrombosis & Vascular Biology 1997; 17(8):1532-1538.
(9) Hartl DL, Clark AG. Darwinian evolution in Mendelian population. Principles of population genetics. Sunderland, Massachusetts: Sinauer Associates, Inc., 1989: 1-60.
(10) Lewontin RC. On measures of gametic disequilibrium. Genetics 1988; 120(3):849-852.
(11) Liang KY, Beaty TH, Cohen BH. Application of odds ratio regression models for assessing familial aggregation from case-control studies. Am J Epidemiol 1986; 124(4):678-683.
(12) Ziegler A, Kastner C, Brunner D, Blettner M. Familial associations of lipid profiles: a
generalized estimating equations approach. Stat Med 2000; 19(24):3345-3357.
(13) SAS Institute Inc. SAS/STAT User's guide, Version 8. Cary, NC: SAS Institute Inc., 1999.
(14) Tregouet DA, Ducimetiere P, Tiret L. Testing association between candidate-gene markers and phenotype in related individuals, by use of estimating equations. Am J Hum Genet 1997; 61(1):189-199.
(15) Risch N, Zhang H. Extreme discordant sib pairs for mapping quantitative trati loci in humans. Science 1995; 268:1584-1589.
(16) Schork NJ, Nath SK, Fallin D, Chakravarti A. Linkage disequilibrium analysis of biallelic DNA markers, human quantitative trait loci, and threshold-defined case and control subjects. Am J Hum Genet 2000; 67(5):1208-1218.
(17) Juo SH, Wyszynski DF, Beaty TH, Huang HY, Bailey-Wilson JE. Mild association between the A/G polymorphism in the promoter of the
apolipoprotein A-I gene and apolipoprotein A-I levels: a meta-analysis. American Journal of Medical
7
附件:封面格式
行政院國家科學委員會補助專題研究計畫成果報告
※※※※※※※※※※※※※※※※※※※※※※※※※※
※
高三酸甘油酯/低高密度脂蛋白
※
※
膽固醇之家族遺傳研究(II)
※
※
※
※※※※※※※※※※※※※※※※※※※※※※※※※※
計畫類別:▓個別型計畫
□整合型計畫
計畫編號:
NSC 91-2314-B-002-202執行期間:91 年 8 月 1 日至 92 年 7 月 31 日
計畫主持人:
簡 國 龍
計畫參與人員: 許 秀 卿
李 源 德
本成果報告包括以下應繳交之附件:
□赴國外出差或研習心得報告一份
□赴大陸地區出差或研習心得報告一份
□出席國際學術會議心得報告及發表之論文各一份
□國際合作研究計畫國外研究報告書一份
執行單位:
臺大公衛學院 臺大醫院
中
華
民
國
92 年
5 月
29 日
Appendix
Table 1. Compar ison of genotype frequencies of 5 polymor phisms of Apo A1/C3/A4 gene cluster s
Locus/mar ker Genotype Frequency Percent (% ) ApoA1 (-75) GG 366 45.13 MspI G/A substitution GA 351 43.28 AA 94 11.59 Apo A1 (+83) CC 765 94.21 C->T CT 47 5.79 TT 0 0 Apo C3 (+3175) CC 416 50.61 SacI C->G CG 347 42.21 GG 59 7.18 Apo C3 (+3206) TT 34 4.14 T->G TG 282 34.31 GG 506 61.56 Apo A4(+347) AA 340 43.53 A->T AT 358 45.84 Protein 347 Thr ->Ser TT 83 10.63
Table 2. Estimates of Gene Frequencies (Assuming Independence) by Haplotype analyses by PM and EH progr am among study population
locus Allele 1 Allele 1 frequency Allele 2 Allele 2 frequency ApoA1 (-75) G 0.662 A 0.338 Apo A1 (+83) C 0.972 T 0.029 Apo C3 (+3175) C 0.717 G 0.283 Apo C3 (+3206) T 0.215 G 0.785 Apo A4(+347) A 0.665 T 0.335
Table 3. Distr ibution of haplotype frequency of 5 mar ker s and disease status Haplotype Frequency ApoA1
(-75) Apo A1 (+83) Apo C3 (+3175) Apo C3 (+3206) Apo A4 (+347) 1 27.83% A C C G A 2 25.49% G C G G T 3 20.28% G C C T A
9 4 13.86% G C C G A 5 4.09% A C C G T 6 2.54% G T C G A 7 2.03% G C C G T 8 1.37% G C G G A
Table 3. Coefficients of linkage disequilibr ium in paired genotypes Pair s 1 Pair s 2 P11, allele
frequency D* Z D.max D’ P ApoA1 (-75) Apo A1 (+83) 0.6499 -0.0063 -2.3366 0.0191 -0.3295 0.0097 ApoA1 (-75) Apo C3 (+3175) 0.4000 -0.0786 -10.5409 0.1887 -0.4166 0.0000 ApoA1 (-75) Apo C3 (+3206) 0.2378 0.0695 9.3353 0.0753 0.9227 0.0000 ApoA1 (-75) Apo A4 (+347) 0.3782 -0.0624 -7.7759 0.2222 -0.2807 0.0000 Apo A1 (+83) Apo C3 (+3175) 0.6965 -0.0010 -0.3699 0.0208 -0.0471 0.3557 Apo A1 (+83) Apo C3 (+3206) 0.2139 0.0062 2.5664 0.0062 1.0000 0.0051 Apo A1 (+83) Apo A4 (+347) 0.6438 -0.0031 -1.1018 0.0189 -0.1640 0.1353 Apo C3 (+3175) Apo C3 (+3206) 0.2129 0.0602 9.3642 0.0602 1.0000 0.0000 Apo C3 (+3175) Apo A4 (+347) 0.6487 0.1717 22.5836 0.1876 0.9154 0.0000 Apo C3 (+3206) Apo A4 (+347) 0.2091 0.0658 9.4633 0.0724 0.9087 0.0000
Table 3-2. Pair -wise Linkage disequilibr ium values (r ight upper tr iangle) and responsive P values (left lower tr iangle) in the 5 genotypes.
ApoA1 (-75) Apo A1 (+83) Apo C3 (+3175) Apo C3 (+3206) Apo A4 ApoA1 (-75) -0.32946 -0.41657 0.92271 -0.28071 Apo A1 (+83) 0.0097 -0.04709 1 -0.16404 Apo C3 (+3175) 0.0000 0.3557 1 0.915416 Apo C3 (+3206) 0.0000 0.0051 0.0000 0.908663 Apo A4 (+347) 0.0000 0.1353 0.0000 0.0000
Table 4. Char acter istics of age and var ious lipid profiles among study population. Men (N=388) Women (N=435) Mean SD Mean SD P Age (year s) 38.03 20.00 37.66 19.97 0.793 Total cholesterol (mg/dl) 184.14 41.31 189.40 40.58 0.066 Tr iglycer ide (mg/dl) 140.14 138.31 118.86 106.35 0.015 HDL cholesterol(mg/dl) 42.10 11.45 44.32 10.95 0.005
LDL cholesterol(mg/dl) 107.88 44.10 112.36 40.76 0.130 Apolipoprotein A1(mg/dl) 1.19 0.24 1.20 0.23 0.487 Apolipoprotein B(mg/dl) 0.58 0.21 0.56 0.18 0.254 Tr iglycer ide/HDL cholesterol 3.98 5.85 3.21 4.83 0.042 Logar ithm tr iglycer ide 4.69 0.64 4.59 0.55 0.014
Logar ithm TG/HDL
cholesterol r atio 0.99 0.79 0.83 0.71 0.002
Table 5. Extreme distr ibution values of var ious lipid profiles by quintiles in the study population
Var iable Total Number 20th percentile Number 80th percentile Number Total cholesterol (mg/dl) 838 152 165 220 166 Tr iglycer ide (mg/dl) 823 63 161 161 165 HDL cholesterol(mg/dl) 823 34 168 52 160 LDL cholesterol(mg/dl) 823 76 164 143 169 Apolipoprotein A1(mg/dl) 823 1.01 169 1.35 166 Apolipoprotein B(mg/dl) 823 0.43 168 0.67 190
Tr iglycer ide/HDL cholesterol 823 1.343 164 4.149 165
Logar ithm tr iglycer ide 823 4.13 161 5.082 165
Logar ithm TG/HDL cholesterol r atio
823 0.295 163 1.43 165
Table 6. Extreme group analysis : (1) Dominant mode of inher itance
The odds r atios, 95% par tial profile confidence inter val, and cor responding P values of five loci in the Apo AI-CIII-AIV gene cluster s, after adjusting for age and gender effect, under gener alized estimation equation model
Star tified group Odds r atio Lower 95% CI Upper 95% CI (Logar ithm) Tr iglycer ide vs. HDL cholesterol r atio
ApoA1 (-75) 0 vs. 2, 1 1.159 0.670 2.005
Apo A1 (+83) 0 vs. 2, 1 3.248 0.544 19.392
Apo C3 (+3175) 0 vs. 2, 1 0.744 0.411 1.347
Apo C3 (+3206) 0 vs. 2, 1 0.680 0.213 2.174
11
Tr iglycer ide vs. HDL cholesterol r atio
ApoA1 (-75) 0 vs. 2, 1 1.043 0.647 1.681
Apo A1 (+83) 0 vs. 2, 1 0.378 0.154 0.927
Apo C3 (+3175) 0 vs. 2, 1 1.036 0.641 1.674
Apo C3 (+3206) 0 vs. 2, 1 1.036 0.292 3.674
Apo A4 (+347) 0 vs. 2, 1 1.025 0.644 1.633
(Logar ithm) Tr iglycer ide
ApoA1 (-75) 0 vs. 2, 1 1.520 0.881 2.623
Apo A1 (+83) 0 vs. 2, 1 3.926 0.724 21.304
Apo C3 (+3175) 0 vs. 2, 1 0.696 0.391 1.237
Apo C3 (+3206) 0 vs. 2, 1 0.685 0.194 2.422
Apo A4 (+347) 0 vs. 2, 1 0.660 0.358 1.215
(2) Recessive mode of inher itance
The odds r atios, 95% par tial profile confidence inter val, and cor responding P values of five loci in the Apo AI-CIII-AIV gene cluster s, after adjusting for age and gender effect, under gener alized estimation equation model
Star tified group Odds r atio Lower 95% CI Upper 95% CI (Logar ithm) Tr iglycer ide vs. HDL cholesterol r atio
ApoA1 (-75) 0, 1 vs. 2 1.890 0.887 4.030 Apo A1 (+83) 0, 1 vs. 2 Apo C3 (+3175) 0, 1 vs. 2 0.663 0.220 1.994 Apo C3 (+3206) 0, 1 vs. 2 0.874 0.494 1.546 Apo A4 (+347) 0, 1 vs. 2 0.451 0.221 0.918 HDL cholesterol r atio ApoA1 (-75) 0, 1 vs. 2 0.538 0.188 1.539 Apo A1 (+83) 0, 1 vs. 2 Apo C3 (+3175) 0, 1 vs. 2 1.056 0.444 2.511 Apo C3 (+3206) 0, 1 vs. 2 0.903 0.566 1.442 Apo A4 (+347) 0, 1 vs. 2 1.297 0.629 2.674
(Logar ithm) Tr iglycer ide
ApoA1 (-75) 0, 1 vs. 2 2.716 1.103 6.689
Apo A1 (+83) 0, 1 vs. 2
Apo C3 (+3175) 0, 1 vs. 2 0.803 0.282 2.282
Apo C3 (+3206) 0, 1 vs. 2 1.074 0.580 1.989
(3) Additive mode of inher itance
The odds r atios, 95% par tial profile confidence inter val, and cor responding P values of five loci in the Apo AI-CIII-AIV gene cluster s, after adjusting for age and gender effect, under gener alized estimation equation model
Star tified group Odds r atio Lower 95% CI Upper 95% CI (Logar ithm) Tr iglycer ide vs. HDL cholesterol r atio
ApoA1 (-75) One unit increase
from 0,1,2 0.798 0.556 1.143
Apo A1 (+83) One unit increase
from 0,1,2 0.308 0.052 1.838
Apo C3 (+3175) One unit increase
from 0,1,2 1.302 0.812 2.088
Apo C3 (+3206) One unit increase
from 0,1,2 1.158 0.721 1.859
Apo A4 (+347) One unit increase
from 0,1,2 1.405 0.966 2.043
HDL cholesterol
ApoA1 (-75) One unit increase
from 0,1,2 1.112 0.757 1.633
Apo A1 (+83) One unit increase
from 0,1,2 2.646 1.079 6.486
Apo C3 (+3175) One unit increase
from 0,1,2 0.968 0.657 1.428
Apo C3 (+3206) One unit increase
from 0,1,2 1.075 0.718 1.611
Apo A4 (+347) One unit increase
from 0,1,2 0.931 0.660 1.312
(Logar ithm) Tr iglycer ide
ApoA1 (-75) One unit increase
from 0,1,2 0.631 0.435 0.915
Apo A1 (+83) One unit increase
from 0,1,2 0.255 0.047 1.382
Apo C3 (+3175) One unit increase
from 0,1,2 1.309 0.828 2.068
Apo C3 (+3206) One unit increase
from 0,1,2 1.007 0.603 1.683
Apo A4 (+347) One unit increase
13
(4) Non-par ametr ic mode of inher itance
The odds r atios, 95% par tial profile confidence inter val, and cor responding P values of five loci in the Apo AI-CIII-AIV gene cluster s, after adjusting for age and gender effect, under gener alized estimation equation model
Star tified group Odds r atio Lower 95% CI Upper 95% CI (Logar ithm) Tr iglycer ide vs. HDL cholesterol r atio
ApoA1 (-75) 0 vs. 2 1.911 0.881 4.142 1 vs. 2 1.872 0.795 4.407 0 vs. 1 1.021 0.551 1.892 Apo A1 (+83) 0 vs. 2 1 vs. 2 0 vs. 1 3.248 0.544 19.392 Apo C3 (+3175) 0 vs. 2 0.589 0.189 1.831 1 vs. 2 0.767 0.240 2.450 0 vs. 1 0.768 0.411 1.438 Apo C3 (+3206) 0 vs. 2 0.656 0.197 2.180 1 vs. 2 0.909 0.508 1.627 0 vs. 1 0.721 0.221 2.357 Apo A4(+347) 0 vs. 2 0.421 0.192 0.923 1 vs. 2 0.480 0.229 1.006 0 vs. 1 0.878 0.510 1.511 HDL cholesterol ApoA1 (-75) 0 vs. 2 0.584 0.208 1.639 1 vs. 2 0.510 0.169 1.534 0 vs. 1 1.145 0.684 1.917 Apo A1 (+83) 0 vs. 2 1 vs. 2 0 vs. 1 0.378 0.154 0.927 Apo C3 (+3175) 0 vs. 2 1.071 0.430 2.668 1 vs. 2 1.039 0.429 2.519 0 vs. 1 1.030 0.630 1.686 Apo C3 (+3206) 0 vs. 2 0.995 0.280 3.537 1 vs. 2 0.894 0.549 1.457 0 vs. 1 1.113 0.298 4.163 Apo A4 (+347) 0 vs. 2 1.282 0.599 2.745 1 vs. 2 1.310 0.610 2.813
0 vs. 1 0.979 0.601 1.594
(Logar ithm) Tr iglycer ide
ApoA1 (-75) 0 vs. 2 3.146 1.294 7.650 1 vs. 2 2.426 0.861 6.841 0 vs. 1 1.297 0.699 2.405 Apo A1 (+83) 0 vs. 2 1 vs. 2 0 vs. 1 3.926 0.724 21.304 Apo C3 (+3175) 0 vs. 2 0.673 0.227 2.000 1 vs. 2 0.963 0.322 2.879 0 vs. 1 0.699 0.383 1.276 Apo C3 (+3206) 0 vs. 2 0.728 0.197 2.697 1 vs. 2 1.132 0.603 2.128 0 vs. 1 0.643 0.174 2.374 Apo A4(+347) 0 vs. 2 0.531 0.197 1.429 1 vs. 2 0.758 0.306 1.877 0 vs. 1 0.701 0.376 1.304
Table 7. Quantitative tr ait analysis :
(1) Dominant mode of inher itance (2,1) vs. 0
The adjusted mean values standar d er ror of mean, difference between three genotypes, and cor responding P values of five loci in the Apo AI-CIII-AIV gene cluster s, after adjusting for age and gender effect, under gener alized estimation equation model
Grouping Mean SEM Difference from baseline genotype 0
vs. (1,2) Logar ithm Tr iglycer ide vs. HDL cholesterol r atio
ApoA1 (-75) 0 0.936 0.041 0.065 1,2 0.871 0.041 Baseline Apo A1 (+83) 0 0.914 0.033 0.234 1,2 0.679 0.112 Apo C3 (+3175) 0 0.865 0.045 -0.071 1,2 0.936 0.042 Apo C3 (+3206) 0 0.750 0.157 -0.157 1,2 0.907 0.033
15
Apo A4(+347) 0 0.852 0.046 -0.079
1,2 0.931 0.043
Tr iglycer ide vs. HDL cholesterol r atio
ApoA1 (-75) 0 3.435 0.197 -0.255 1,2 3.691 0.320 Apo A1 (+83) 0 3.626 0.220 0.894 1,2 2.731 0.490 Apo C3 (+3175) 0 3.526 0.285 -0.076 1,2 3.601 0.263 Apo C3 (+3206) 0 2.768 0.566 -0.830 1,2 3.598 0.216 Apo A4(+347) 0 3.357 0.240 -0.382 1,2 3.739 0.301 HDL cholesterol ApoA1 (-75) 0 42.570 0.636 -1.031 1,2 43.601 0.699 Apo A1 (+83) 0 42.880 0.564 -4.273 1,2 47.153 1.601 Apo C3 (+3175) 0 43.679 0.746 0.967 1,2 42.712 0.682 Apo C3 (+3206) 0 43.251 1.768 0.051 1,2 43.200 0.573 Apo A4(+347) 0 43.700 0.708 0.734 1,2 42.966 0.690 Tr iglycer ide ApoA1 (-75) 0 127.371 4.998 -2.799 1,2 130.170 6.802 Apo A1 (+83) 0 129.546 4.770 12.148 1,2 117.398 20.720 Apo C3 (+3175) 0 127.441 6.537 -2.714 1,2 130.155 5.815 Apo C3 (+3206) 0 105.389 16.685 -24.422 1,2 129.811 4.676 Apo A4(+347) 0 125.302 6.716 -5.792 1,2 131.095 5.974
Logar ithm Tr iglycer ide
1,2 4.608 0.031 Apo A1 (+83) 0 4.638 0.026 0.136 1,2 4.502 0.096 Apo C3 (+3175) 0 4.602 0.034 -0.060 1,2 4.662 0.033 Apo C3 (+3206) 0 4.489 0.124 -0.149 1,2 4.638 0.025 Apo A4(+347) 0 4.595 0.036 -0.062 1,2 4.657 0.033
(2) Recessive mode of inher itance 2 vs. (1,0)
The adjusted mean values standar d er ror of mean, difference between three genotypes, and cor responding P values of five loci in the Apo AI-CIII-AIV gene cluster s, after adjusting for age and gender effect, under gener alized estimation equation model
Group Mean SEM Difference from baseline genotype
(0,1) vs. 2 Logar ithm Tr iglycer ide vs. HDL cholesterol r atio
ApoA1 (-75) 0, 1 0.916 0.034 0.143 2 0.774 0.082 Apo A1 (+83) 0, 1 0.900 0.032 2 Apo C3 (+3175) 0, 1 0.891 0.032 -0.130 2 1.020 0.084 Apo C3 (+3206) 0, 1 0.873 0.046 -0.044 2 0.917 0.039 Apo A4(+347) 0, 1 0.879 0.034 -0.171 2 1.050 0.075
Tr iglycer ide vs. HDL cholesterol r atio
ApoA1 (-75) 0, 1 3.609 0.217 0.304 2 3.305 0.585 Apo A1 (+83) 0, 1 3.572 0.211 2 Apo C3 (+3175) 0, 1 3.554 0.218 -0.119 2 3.673 0.390 Apo C3 (+3206) 0, 1 3.239 0.221 -0.519
17 2 3.758 0.275 Apo A4(+347) 0, 1 3.538 0.231 -0.309 2 3.847 0.309 HDL cholesterol ApoA1 (-75) 0, 1 42.873 0.569 -2.362 2 45.235 1.551 Apo A1 (+83) 0, 1 43.131 0.547 2 Apo C3 (+3175) 0, 1 43.265 0.578 0.848 2 42.418 1.153 Apo C3 (+3206) 0, 1 42.896 0.780 -0.487 2 43.384 0.632 Apo A4(+347) 0, 1 43.378 0.594 0.869 2 42.510 1.213 Tr iglycer ide ApoA1 (-75) 0, 1 129.854 4.829 8.359 2 121.494 11.435 Apo A1 (+83) 0, 1 128.816 4.564 2 Apo C3 (+3175) 0, 1 128.328 4.702 -6.152 2 134.480 9.902 Apo C3 (+3206) 0, 1 121.104 5.980 -12.316 2 133.420 5.667 Apo A4(+347) 0, 1 127.119 4.986 -13.612 2 140.731 8.582
Logar ithm Tr iglycer ide
ApoA1 (-75) 0, 1 4.640 0.026 0.085 2 4.555 0.058 Apo A1 (+83) 0, 1 4.630 0.025 2 Apo C3 (+3175) 0, 1 4.623 0.025 -0.117 2 4.740 0.066 Apo C3 (+3206) 0, 1 4.597 0.036 -0.055 2 4.652 0.030 Apo A4(+347) 0, 1 4.614 0.026 -0.152 2 4.766 0.060
(3) Additive mode of inher itance as 0,1,2
The estimated par ameter s, 95% par tial profile confidence inter val, and
cor responding P values of five loci in the Apo AI-CIII-AIV gene cluster s, after adjusting for age and gender effect, under gener alized estimation equation model
Par ameter estimate Standar d er ror of mean Lower 95% CI Higher 95% CI P value
Logar ithm Tr iglycer ide vs. HDL cholesterol r atio
ApoA1 (-75) -0.069 0.036 -0.140 0.002 0.058
Apo A1 (+83) -0.234 0.116 -0.462 -0.006 0.044
Apo C3 (+3175) 0.070 0.044 -0.016 0.156 0.112
Apo C3 (+3206) 0.052 0.051 -0.049 0.153 0.310
Apo A4(+347) 0.085 0.042 0.002 0.167 0.045
Tr iglycer ide vs. HDL cholesterol r atio
ApoA1 (-75) 0.071 0.247 -0.413 0.555 0.774 Apo A1 (+83) -0.894 0.529 -1.930 0.142 0.091 Apo C3 (+3175) 0.070 0.253 -0.425 0.565 0.782 Apo C3 (+3206) 0.482 0.255 -0.018 0.981 0.059 Apo A4(+347) 0.288 0.209 -0.122 0.698 0.168 HDL cholesterol ApoA1 (-75) 1.126 0.612 -0.072 2.325 0.066 Apo A1 (+83) 4.273 1.693 0.955 7.590 0.012 Apo C3 (+3175) -0.786 0.662 -2.084 0.512 0.235 Apo C3 (+3206) 0.354 0.684 -0.986 1.694 0.605 Apo A4(+347) -0.628 0.570 -1.744 0.489 0.271 Tr iglycer ide ApoA1 (-75) -0.358 5.302 -10.749 10.034 0.946 Apo A1 (+83) -12.148 21.637 -54.556 30.260 0.575 Apo C3 (+3175) 2.821 6.118 -9.171 14.812 0.645 Apo C3 (+3206) 11.972 6.421 -0.614 24.557 0.062 Apo A4(+347) 6.326 5.747 -4.938 17.590 0.271
Logar ithm Tr iglycer ide
ApoA1 (-75) -0.047 0.027 -0.100 0.006 0.079
Apo A1 (+83) -0.136 0.100 -0.332 0.061 0.177
Apo C3 (+3175) 0.060 0.035 -0.009 0.129 0.086
Apo C3 (+3206) 0.059 0.040 -0.019 0.138 0.139
Apo A4(+347) 0.070 0.035 0.002 0.139 0.043
19
The adjusted mean values standar d er ror of mean, difference between three genotypes, and cor responding P values of five loci in the Apo AI-CIII-AIV gene cluster s, after adjusting for age and gender effect, under gener alized estimation equation model
Annotation I Annotation II Mean SEM Difference from baseline genotype
Logar ithm Tr iglycer ide vs. HDL cholesterol r atio
ApoA1 (-75) 0 11 0.936 0.041 0.165 1 12 0.896 0.049 0.124 2 22 0.772 0.082 0.000 Apo A1 (+83) 0 11 0.914 0.033 0.234 1 12 0.679 0.112 0.000 2 22 Apo C3 (+3175) 0 11 0.864 0.045 -0.161 1 12 0.922 0.044 -0.102 2 22 1.024 0.084 0.000 Apo C3 (+3206) 0 11 0.746 0.157 -0.171 1 12 0.887 0.047 -0.031 2 22 0.918 0.039 0.000 Apo A4(+347) 0 11 0.851 0.046 -0.202 1 12 0.905 0.045 -0.149 2 22 1.053 0.076 0.000
Tr iglycer ide vs. HDL cholesterol r atio
ApoA1 (-75) 0 11 3.437 0.197 0.123 1 12 3.788 0.360 0.474 2 22 3.314 0.585 0.000 Apo A1 (+83) 0 11 3.626 0.220 0.894 1 12 2.731 0.490 0.000 2 22 Apo C3 (+3175) 0 11 3.525 0.285 -0.151 1 12 3.589 0.292 -0.087 2 22 3.676 0.390 0.000 Apo C3 (+3206) 0 11 2.741 0.561 -1.020 1 12 3.298 0.237 -0.463 2 22 3.761 0.275 0.000 Apo A4(+347) 0 11 3.356 0.241 -0.504
1 12 3.712 0.341 -0.148 2 22 3.860 0.312 0.000 HDL cholesterol ApoA1 (-75) 0 11 42.56 0.64 -2.71 1 12 43.19 0.79 -2.08 2 22 45.27 1.54 0 Apo A1 (+83) 0 11 42.88 0.56 -4.27 1 12 47.15 1.60 0.00 2 22 Apo C3 (+3175) 0 11 43.68 0.75 1.35 1 12 42.77 0.72 0.44 2 22 42.33 1.16 0 Apo C3 (+3206) 0 11 43.19 1.77 -0.19 1 12 42.86 0.83 -0.52 2 22 43.38 0.63 0 Apo A4(+347) 0 11 43.71 0.71 1.24 1 12 43.07 0.76 0.61 2 22 42.46 1.21 0 Tr iglycer ide ApoA1 (-75) 0 11 127.41 5.00 5.83 1 12 132.42 8.01 10.85 2 22 121.57 11.42 0 Apo A1 (+83) 0 11 129.55 4.77 12.15 1 12 117.40 20.72 0.00 2 22 Apo C3 (+3175) 0 11 127.41 6.54 -7.11 1 12 129.42 6.42 -5.11 2 22 134.53 9.91 0 Apo C3 (+3206) 0 11 104.92 16.64 -28.56 1 12 123.02 6.35 -10.46 2 22 133.48 5.67 0 Apo A4(+347) 0 11 125.27 6.72 -15.55 1 12 128.90 6.58 -11.92 2 22 140.81 8.61 0
Logar ithm Tr iglycer ide
ApoA1 (-75) 0 11 4.658 0.031 0.105
21 2 22 4.553 0.058 0.000 Apo A1 (+83) 0 11 4.638 0.026 0.136 1 12 4.502 0.096 0.000 2 22 Apo C3 (+3175) 0 11 4.601 0.034 -0.142 1 12 4.649 0.035 -0.094 2 22 4.743 0.067 0.000 Apo C3 (+3206) 0 11 4.484 0.124 -0.169 1 12 4.610 0.037 -0.043 2 22 4.653 0.030 0.000 Apo A4(+347) 0 11 4.594 0.036 -0.174 1 12 4.633 0.034 -0.135 2 22 4.769 0.061 0.000