1. INTRODUCTION
Gravelly deposits or formations are mainly distributed in the areas of foothills, coastal and/or river terraces in Western Taiwan, the most populous region in Taiwan. Depending on location, the thickness of gravelly deposit may vary from 20 meters to more than 200 meters. Some loggings in central Taiwan appear to have about 2 meters of top soil which overlie uncon-solidated gravel mixed with sandy or silty lenses (Chu, 1995). With the increase of infra-structure development in Taiwan, more and more constructions such as excavation, tunne-ling and foundation will encounter the gravelly formations. In the past, while tunneling through the gravelly formations, several unsuccessful cases were reported. Difficulties, including severe squeezing and collapse, were encoun-tered during construction of these tunnels. Therefore, the deformational characteristics, such as apparently nonlinear deformation and large shear dilation, of gravelly soils should be further explored.
Owing to the complicated compounds, the geotechnical behaviors of the gravelly soils are significantly different from those of sand, clay and gravel alone. According to previous studies (Matheson, 1986; Holtz, 1961; Marachi et al., 1969; Charles and Watts, 1980; Indraratna et al., 1998), the geotechnical characteristics of
gravelly soils are greatly influenced by the gradation, fine contents, porosity, water content, particle shape and particle orientation during deposition. In addition to above-mentioned factors, the properties of fine contents, especial-ly the plasticity index (PI), may also play an important role in the influence factors. Howev-er, the related references are quite rare. For the purpose of more understanding the effects of fine contents on deformability behavior of this specific geological material, a series of large scale triaxial tests of the gravelly soils with different plasticity indices were conducted in this research. In addition to the experiments, this work focuses on the two following aspects: 1. To characterize the deformational behaviors
of gravelly soils with different plasticity in-dices of fine contents.
2. To distinguish the volumetric deformation induced by hydrostatic stress or shear stress so that the contribution of shear dilation can be clarified.
2. SPECIMEN PREPARATION AND SETUP OF EXPERIMENTAL STUDY
2.1. specimen preparation
The gravelly soils for this study were sam-pled from the Pakuashan tunnel in central Taiwan, and they are classified as Transition ABSTRACT: A series of large scale triaxial compression drained tests were conducted for gravelly soils containing different plasticity indices of fine contents. To distinguish the volumetric and the shear deformation of the gravelly soils, experiments with controlled stress paths, including hydrostatic compression and pure shearing, were conducted. According to the test results, the deformation of gravelly soils possesses the following characteristics: (1) Increase of bulk modulus upon increasing hydrostatic compression; (2) Softening of shear modulus upon increasing shearing; (3) Significant shear compression and/or dilation may occur upon increasing shearing. For gravelly soils of fine contents with no plasticity, shear dilation may usually occur; while fine contents with high plasticity, shear compression may occur most of time.
Influence of fine soil properties on deformation characteristics of
gravelly soil
B.L. Chu
Department of Civil Engineering, National Chung-Hsing University, Taiwan Y.W. Jou
CECI Engineering Consultants Inc., Taiwan M.C. Weng
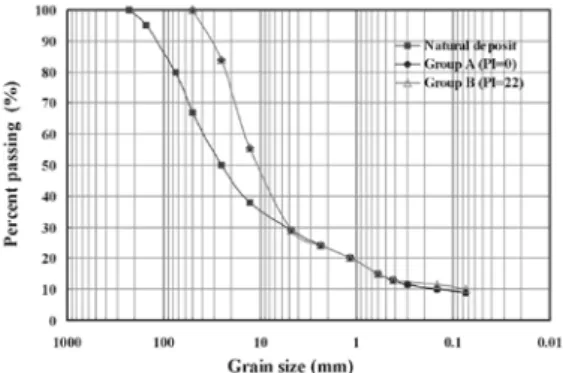
rockfill material, defined by Matheson (1986). In order to explore the mechanical behaviors of gravelly soils systematically, a series of re-molded specimens for triaxial tests, which grain size distribution curve shown in Fig. 1 is based on the in-situ condition, were prepared.In this study, field grain sizes for natural gavelly deposit were scaled down to a maximum grain size of 2 inches. Two compacted specimens, of which the soil particle finer than #40 sieve were replaced by those with different PI values. Herein, the remolded specimens were com-pacted equivalent to the Standard Proctor compaction energy. In addition, two kinds of fine contents, which plastic index (PI) are 0 and 22 for the soil passing #40 sieve, were used respectively, and the specimens were named into two groups of A and B. Therefore, the remolded samples contain 73.23 percent of gravel and approximately 8.73 to 11.30 percent of fine contents, respectively. According to the soil classification systems of USCS and AASHTO, these samples appear to have high uniformity coefficient, which is around 85.8. Based on USCS, group A is classified as GP-GM, while group B is classified as GP-GC. For the AASHTO classification system, group A belongs to A-1-a and group B belongs to A-2-6.
Figure 1. grain size distribution curve of the specimens
2.2. apparatus and experimental setup
The deformation characteristics of gravelly soil were explored by means of drained triaxial compression tests (CID test). In the tests, the axial load was provided by a general loading frame, which has a maximum capacity of 500 kN, and it provide the loading rate from 0.001 mm/min to 30 mm/min, with a precision of
0.0005 mm/min. The triaxial cell is able to sustain the hydrostatic pressure up to 5 MPa. A pressure transducer was used to monitor the hydrostatic pressure with an accuracy of 0.001 MPa. Both the axial stress and the hydrostatic stress are servo-controlled so that experimental tests under various stress paths would be feasi-ble. To measure the deformation of the speci-men, LVDTs were set up to obtain the axial deformation with a precision of 0.05 mm. In addition, the digital volume change measure-ment device having a precision of 0.1 cc, may directly measure the discharge of the specimen under hydrostatic or triaxial compression condition.
In order to study the effects of hydrostatic and shear stresses on the volumetric deforma-tion of gravelly soil separately, the pure shear stress path is performed in triaxial tests. During the stress path of conventional triaxial compres-sion (CTC) tests as shown in Fig. 2, in which p (= I1/3 = σkk/3) and (J2)1/2 (J2=1/2 sijsij; sij=
deviatoric stress tensor) mean the hydrostatic stress and shear stress, respectively, both hydrostatic pressure and shear stresses may vary with each increment of loading. As a result, it is difficult to distinguish the effect of shear and hydrostatic stresses on volumetric deformations of the tested specimens. Tests with pure shear stress path make it possible to separate the effect of shear stresses and hydrostatic stresses on deformations. In this study, the specimen is first applied with hydrostatic stress along a stress path OA, followed by subsequent shear-ing. If the hydrostatic stress is not altered during the subsequent shearing, a pure shear (PS; path AC) condition is achieved. In practice, the isotropically consolidation tests were performed firstly, and the axial loading rates were selected based on the suggestions of Bishop & Henkel (1962). Then, along with pure shear stress paths, hydrostatic pressure was held constant by decreasing cell pressure to be one-half of the increment of axial stresses (Δσ2 =Δσ3 = -0.5Δσ1), and the axial load was applied under a rate of 0.5 mm/min according to the consolidation test result. Such a stress path makes it possible to study the effect of shear stresses on shear deformations and volumetric deformations.
Figure 2. Schematic illustration of the conducted stress paths. PS = pure shear test, CTC = conventional triaxial compression test
The test conditions used in this study is summarized in Table 1. These experiments are designed with engineering applicability in mind, thus have chosen confining pressure between 1.2 ~ 3.0 MPa. The measured results of defor-mation contain axial (ε1) and volumetric strain
(εv) of the specimen. By using small-strain
theory, volumetric strain εv = I’1= εkk and
deviatoric shear strain γ = 2(J'2)1/2 (where I’1 is
the first strain invariant; J'2 is the second
devia-toric strain invariant) of the specimen can be obtained.
Table 1. List of triaxial tests and testing conditions Test type Specimen P (MPa) Number of Test Pure shear stress path triaxial test Group A (PI=0) 1.2 1 1.8 1 2.4 1 3.0 1 Group B (PI=22) 1.2 1 1.8 1 2.4 1 3.0 1 3. DEFORMATION CHARACTERISTICS OF GRAVELLY SOILS
3.1. Deformation induced by hydrostatic stress Figure 3 and 4 illustrates the results of the tests along path OA in Fig. 2, i.e. isotropic consolidation tests. The deformations of primary consolidation vary with time under
different loading stages is shown in Fig. 3a and 3b. As it can be seen that, the results of volu-metric strain are apparently influenced by the plasticity indices of fine contents, and more time duration is required for the completion of consolidation for the fine contents of gravelly soil that contain high plasticity. Furthermore, fairly large coefficient of consolidation Cv,
which are between 600 and 2500, are obtained from the tests. As compared with either sandy or clayey soils, the excess pore pressure in gravelly soils dissipates more rapidly. In Fig. 4 the volumetric strains exhibit nonlinear beha-viors during hydrostatic loading stage, which represent that the bulk modulus increases as hydrostatic stress increases. The volumetric strains of gravelly soils at the pressure of 3.0 MPa are between 3.0 and 5.0 percent, and they increase with the increasing of plasticity index of fine material.
(a) Group A (PI=0)
(b) Group B (PI=22)
Figure 3. Primary consolidation curves under differ-ent hydrostatic loading stages
Figure 4. Variations of volumetric strain during hydrostatic loading stage
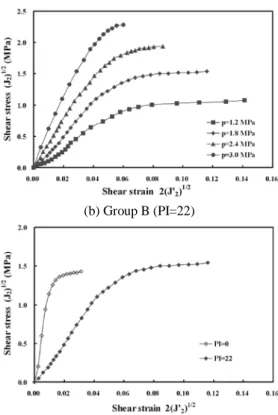
3.2. Deformation induced by shear stress In the shear loading stage, Figure 5 depicts the variations of shear strain γ induced by pure shearing (path AC in Fig. 2). The shear strains of two kinds of specimen are shown in Fig. 5a and 5b respectively, and the tendencies of curve are similar. At the early stage, the shear strains are rather linear, and the initial shear modulus increase with increasing hydrostatic pressure subjected. When the stress path approaches failure state, significant decreases of shear modulus G occur, as shown in both Fig. 5a and 5b. Furthermore, the strain amounts of two kinds of specimen are compared with each other. Taking p =1.8 MPa for instance in Fig. 5c, the greater plasticity index of fine material increas-es the amount of volumetric strain, that is to say, specimen of group B is more ductile than that of group A.
(a) Group A (PI=0)
(b) Group B (PI=22)
(c) Comparison between two groups (p=1.8 MPa) Figure 5. Shear strain induced by pure shear loading
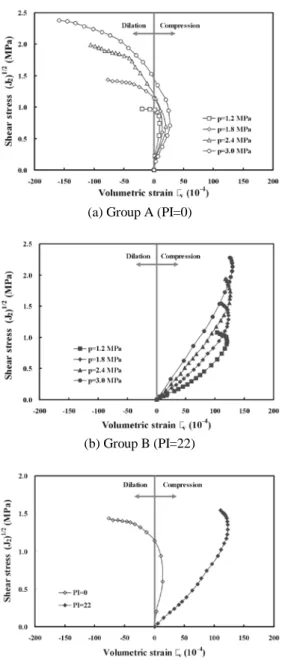
In addition to the volumetric strain induced by the hydrostatic stress shown in Fig. 4, Figure 6 illustrates the variations of volumetric strain induced by pure shearing (path AC in Fig. 2). The volumetric strains of these two kinds of specimen are shown in Fig. 6a and 6b, but the tendencies of curve are quite different. In Fig. 6a, the volumetric strain induced by shear is initially contractive, and then gradually transits to be dilative with increasing shear stresses. However, the volumetric strain in Fig. 6b tends to be all-the-way compressive upon shearing. Similarly, the strain amounts of two kinds of specimen are compared with each other in Fig. 6c. Specimen of group B exhibits more ductile behavior in compressive state, while specimen of group A reveals apparently dilative behavior when approaching shear strength.
(a) Group A (PI=0)
(b) Group B (PI=22)
(c) Comparison between two groups (p=1.8 MPa) Figure 6. Voloemetric strain induced by pure shear loading
3.3. Failure envelopes
The failure envelopes of the two gravelly soils resemble a linear geometry, expressed in terms of stress invariants of three-dimensional stress components, as illustrated in Fig. 7. Accordingly, the linear relationship, known as the Drucker-Prager criteria shown in Fig.7, can be expressed as follows:
2,f 1
J =αI +k (1) where parameters α and k are the slope and the cohesive interception of the failure envelope. The results show the slope α of group A is higher than that of group B. Nevertheless, the interception k of Group B is greater than that of Group A.
The failure envelope expressed by Eq. (1) can be further converted to the Mohr-Coulomb failure criteria and results in a frictional angle φ and a cohesive interception c of 34.2o and 0.253 MPa for group A, and 29.0o and 0.016 MPa for group B.
Figure 7. Failure envelope of the gravelly soils. 4. CONCLUSIONS
The deformation behavior of gravelly soils is explored in this paper. According to the experimental results, the deformation of gravelly soils possesses the following characteristics:
(1) Non-linear volumetric deformation curve and increase of bulk modulus upon increasing hydrostatic compression;
(2) Softening of shear modulus G upon increasing shearing;
(3) Significant shear compression and/or dilation may occur upon increasing shearing . For fine contents with no plasticity (Group A), shear dilation may usually occur; while fine contents with high plasticity (Group B), shear compression may occur most of time; and (4) When subjected to shearing, substantial shear and volumetric strain may occur as the loading approaches the ultimate strength.
5. REFERENCES
Chu, B. L., 1995, Preliminary Study on Geological and Geotechnical Properties for Blue Line of Taichung MRT, Technical Report, Bureau of Housing and Urban Development, Taiwan, ROC, pp. 104-121. Matheson, G.M. 1986. Relationship between
com-pacted rockfill density and gradation, Journal of Geotechnical Engineering, ASCE, Vol. 11, No. 12, pp. 1119-1124.
Holtz, W. G. 1961. Triaxial shear characteristics of clayey gravel soil. Proceedings of the 5th Inter-national Conference on Soil Mechanics and Foundation Engineering, Paris, Vol. 1, pp. 143-149.
Marachi, N., 1969. Strength and deformation charac-teristics of rockfill materials. Ph. D Dissertation, University of California, Berkeley.
Charles, J.A. and Watts, K.S.1980. The influence of confining pressure on shear strength of com-pacted rockfill, Geotechnique, Vol. 30, No. 4, pp. 353-367.
Bishop, A.W., and Henkel, D.J. 1962. The measure-ment of soil properties in triaxial test,2nd Edition, Edward Arnold Ltd.
Indraratna, B., Ionescu, D. and Christie, H.D. 1998. Shear behavior of railway ballast based on large-scale triaxial tests. Journal of Geotechnical and Geoenvironmental Engineering, 124(5), pp. 439-448.