CONCENTRATIONS AND CORRELATIONS OF TRACE METALS IN ESTUARINE
SEDIMENTS - INTERPRETATION BY MULTIVARIATE STATISTICAL ANALYSIS
AND ELEMENTAL NORMALIZATION
Meei-Ling Chang,1,
* Yun-Chang Sun,2 Ruey-An Doong,2 Shian-Chee Wu3 and Chung-Te Fu1
1
Department of Environmental Engineering Van Nung University
Tao-yuan 320, Taiwan
2Department of Biomedical Engineering and Environmental Science
National Tsing Hua University Hsinchu 300, Taiwan
3Graduate Institute of Environmental Engineering
National Taiwan University Taipei 106, Taiwan
Key Words: Correlation analysis, principal component analysis, reference elements, sediment, trace
metals
ABSTRACT
Multivariate statistical analysis and Cs normalization were used to test methodologies to determine background and anthropogenic influence of metals on river sediments. Total concentrations of nine trace metals (Cd, Cr, Pb, Cu, Ni, Zn, As, Co and Hg) and four reference elements (Cs, Fe, Al and Mn) of sediments in the estuaries of Lan-yang River and Erh-jen River were examined. Trace metals in Lan-yang River are found to be highly correlated with reference elements in the correlation analysis and the principal component analysis. It is found that these trace metals of Lan-yang River could represent one of the distribution characteristics of geogenic metals. The results of statistical analysis show that the trace metals of Erh-jen River may originate from three sources: anthropogenic source for Cd, Cr, Cu, Ni, Zn and Hg, no-distinct-discharge sources for Pb and As, and geogenic source for Co. The correlations between trace metal concentrations and fine-grained fraction were not significant for Erh-jen River. Sites with a high total concentration of trace metals and sites with high Cs-normalized ratio may not coincide. They symbolize different environmental meanings (sediment quality, pollution sources, and regions impacted by sources) and both offer valuable information for pollution control and environmental impact assessment.
*Corresponding author Email: [email protected]
INTRODUCTION
Sediment is an important reservoir for pollutants. Adsorption to suspended solids and precipitation processes are probable causes for pollutants to transfer from water to bottom sediments [1]. Dissolution or remobilization of pollutants from the sediment in-creases bioavailability and enhances impact on the aquatic ecosystem [2]. The partition of heavy metals between water and sediment is complicated by various environmental conditions, e.g., redox potential, pH, dissolved oxygen (DO), and ionic strength [3]. Vary-ing salinity is one unique chemical characteristic for the estuarine portion of river and is another important factor to be considered [4].
Metal elements of watershed are enriched in
fine-grained sediment [1,5]. The large grain fraction of sediment usually consists of quartz sand, which is considered a diluting component for metals. The low total metal contents of sediment cannot be attributed exclusively to a geogenic origin. With finer particles having a greater specific surface area and greater con-centration of metals associated with organic matter, and with Fe and Mn oxyhydroxides consistently pre-sent in fine-grained sediment, metals are enriched in fine-grained sediment [6,7]. However, this approach needs a physical separation process and the analysis result does not reflect the concentration of total sedi-ment sample [8]. Various geochemical approaches have been used to normalize trace metal concentra-tions in order to reduce the grain size effect and to identify the pollution sources by using the ratio
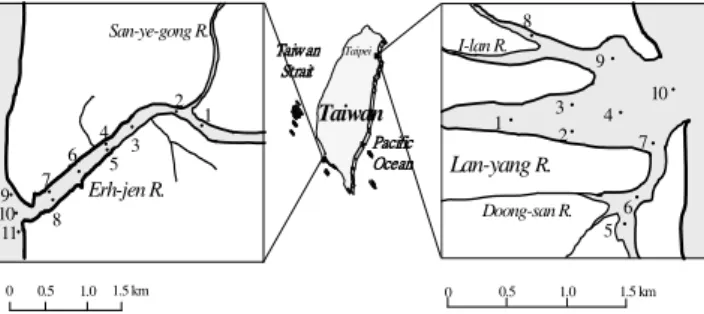
be-Pacific Ocean Taiw an Strait Taiwan Taipei 10 1 2 3 4 5 6 7 8 9 11 San-ye-gong R. Erh-jen R. 0 0.5 1.0 1.5 km 0 0.5 1.0 1.5 km 10 1 2 3 4 5 6 7 8 9 Lan-yangR. I-lan R. Doong-san R.
Fig. 1. Study area and sampling stations.
tween trace metals and normalizing elements. Elemen-tal normalization of concentrations of trace meElemen-tals in total sediments is rapid and cost-effective [9]. Such reference elements include Fe [9,10], Li [11], Al [8,10,12-14] and Co [15]. For example, it was found that most trace metals showed a good linear relation-ship with respect to the Al concentration found in Southeast US coastal sediments [8] and the Yangtze River Delta [13]. Since trace metals, including these normalizing elements, have natural and anthropogenic sources, it is difficult to identify the proportion of each or to find a control site for comparison. A selec-tion procedure to avoid the misusage or to increase the reliability of the normalizing elements is important.
The current study uses data established from two rivers and also shows the correlations of metals of investigated rivers. The purposes of this paper are 1) to present the total concentrations of up to 13 metals (Cd, Cr, Pb, Cu, Ni, Zn, As, Co, Hg, Cs, Fe, Al and Mn) in estuarine sediments of the Lan-yang River and the Erh-jen River; 2) to select the normalizing element based on the results of Pearson correlation analysis; and 3) to identify the anthropogenic and natural sources of trace metals by statistical analyses.
MATERIALS AND METHODS 1. Study Area and Sampling
The Lan-yang River, the most important river in northeastern Taiwan, has a catchment of 978 km2 and a total length of approximately 73 km. The most im-portant tributaries are the I-lan River, on the left bank, and the Doong-san River, on the right bank (Fig. 1). The basin of the Lan-yang River is only scattered with small-scale farms producing grains. The historic monitoring data show the water quality of this river being rated very good [16]. The other river in the study, the Erh-jen River, has a catchment of 350 km2 and a total length of approximately 65 km in southern Taiwan. The most important tributary of this river is the San-ye-gong River. The downstream portion of Erh-jen River receives heavy metals mainly from dustrial effluents (e.g., electroplate plants, dying in-dustries), livestock wastewater, and municipal waste-water. The water quality of the Erh-jen River is
infe-rior to that of the Lan-yang River [16]. Figure 1 shows the sampling stations in the two rivers. Ten sampling stations were located from the outlet to upper 1.5 km for the estuary of the Lan-yang River and eleven sam-pling stations were located from the outlet to upper 2.5 km for the estuary of the Erh-jen River. Samples were taken on two occasions from each river between May 2002 and September 2002 (covering both wet and dry seasons). The water depth of the sampling sta-tions ranged from 0.7 to 3.5 m for the Lan-yang River and 0.9 to 3.9 m for the Erh-jen River, respectively. The upper 15 cm of the surface sediments were sam-pled from each station using a boat equipped with a Birge-Ekman sediment grab in areas of low-flow ve-locity. Oxidation-reduction potentials (ORPs) of sam-ples were examined on site immediately after collec-tion. Another portion of the sediment sample was stored in polyethylene bottles, which were prewashed by diluted nitric acid, transported to the laboratory at low temperature, and preserved at 4 ºC until analyzed for volatile suspended solids (VSSs) within 14 d and for metal contents within 2 months.
2. Analytical Methodology
All chemicals used were of reagent grade. The digest method for sediments was performed according to SW-846 method 3052 [17]. Briefly, about 0.5 g of each homogenized sediment sample was digested us-ing a mixture of 9 mL nitric acid, 3 mL hydrochloric acid and 1 mL hydrofluoric acid in a Teflon vessel and heated in a microwave oven at 180 ºC for 10 min. The digested solution was diluted to a known volume with double distilled water, and then it was analyzed for metals by inductively coupled plasma-mass spec-trometry (ICP-MS, Perkin-Elmer Sciex Elan 5000 with a cross-flow nebulizer and double pass spray chamber).
DO, salinity and ORP were separately examined with WTW Oxi 320/SET, WTW LF 330/SET, and Orion model 97-78-00 Pt redox electrode (Orion Re-search Inc., Boston, MA.). VSS of the sediment was determined by the weight loss at 550±50 ºC for 1 h [18,19]. Homogenized sediments were wet sieved through a set of standard sieves. Then the suspension of the residual particles that passed through the sieves was collected to determine the finer particle size dis-tribution by laser granulometry (CILAS M175, France).
3. Quality Assurance/Quality Control of Data
The detection limit of method, calculated as mean blank +3SD (standard deviation), was typically 0.0001-0.02 mg kg-1. Blank, replicate and spiked sam-ples were analyzed in each batch of sampling. The relative deviations of replicate analysis were less than 7%. The recovery of trace metals ranged from 85 to
140%. Accuracy assessment with standard reference material (GBW07305) showed the accuracy ranged from 86 to 110% for all trace metals, except for Hg of 45%.
4. Statistical Analysis
Principal component analysis (PCA) has been used to interpret the variations of trace metals and or-ganic matter concentrations in the sediment samples [20], to clarify the biogenic and anthropogenic sources of halogenated methoxybenzenes for the marine tro-posphere of the Atlantic Ocean [21], to identify differ-ent pollution sources with the spatial distribution of heavy metals in river sediments [22,23] and to estab-lish the correlations between any two binding frac-tions of heavy metals [24]. The main purposes of PCA are data reduction and to provide interpretation by re-ducing the number of variables to a smaller set of components, which can establish the relationships among the original variables in the data set. In this study, correlation analysis and PCA were used to de-termine the correlation between any two concentra-tions of trace metals (Cd, Cr, Pb, Cu, Ni, Zn, As, Co and Hg) and reference elements (Cs, Fe, Al and Mn), and to assist in identifying possible pollution sources. The statistical analysis was conducted by using soft-ware SPSS for Windows Ver. 11.0.
RESULTS AND DISCUSSION 1. Properties of the Investigated Rivers
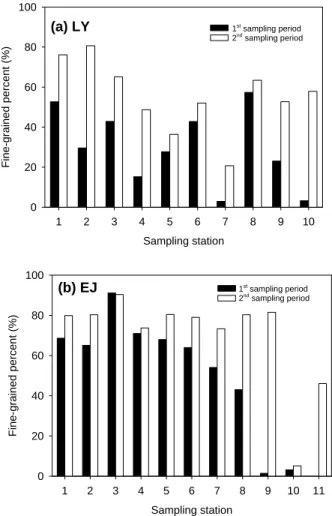
The salinity of river water over the sediment samples ranged from 0.04 to 10.4‰ and from 0.50 to 10.4‰ for the estuaries of Lan-yang and Erh-jen River water, respectively. The ORP values of sedi-ments and DO values of their corresponding water samples showed that Erh-jen River (-151 to -430 mV, 0.1-2.0 mg L-1) was under a more anaerobic condition than Lan-yang River (-8.9 to -335 mV, 6.7-8.5 mg L-1). It is suggested that the rate of oxygen depletion in sediment may be larger than the rate of oxygen supply from the surface water. Therefore, the rivers showed negative ORP values in the sediment samples and de-tectable DO values in the surface water samples. The average VSS of Lan-yang River (VSS of 39 ± 13 mg g-1) is apparently less than that of Erh-jen River (VSS of 47 ± 20 mg g-1). In order to determine whether the difference between them is statistically significant or not, Student t-test was conducted. The results show that the mean VSS values of the two rivers are not significantly different (p = 0.05).The particle size dis-tributions of sediments were site dependent and showed variations between sediments taken from the 1st and the 2nd sampling periods (Fig. 2). Generally, the ratios of fine-grained sediments (grain size < 62.5 μm) decreased gradually from the off-outlet samples
Sampling station 1 2 3 4 5 6 7 8 9 10 Fine-grained percent (% ) 0 20 40 60 80 100 1st sampling period 2nd sampling period (a) LY Sampling station 1 2 3 4 5 6 7 8 9 10 11 Fine-grained per cent (%) 0 20 40 60 80 100 1st sampling period 2nd sampling period (b) EJ
Fig. 2. Distributions of % fine-grained sediment in (a) Lan-yang River (LY) and (b) Erh-jen River (EJ). (stations LY1, LY5, LY8 and EJ1) to the river mouth samples (stations LY10 and EJ11). Higher ratios of fine particles are frequently found in off-outlet sam-ples for the two sampling periods of the investigated rivers. Up to 91% of fine-grained was found in the off-outlet sediment of Erh-jen River as compared to the lowest in its outlet sediment with only 0.1%. The particle size distributions of estuarine sediments were at least affected by tidal effect and seasonal effect. Both of the two occasions were started on the ebb. It is implied that the low fine grain contents of the outlet sampling stations in the first sampling period were due to the flush of river water during the wet season.
2. Trace Metal Concentrations of Total Sediment
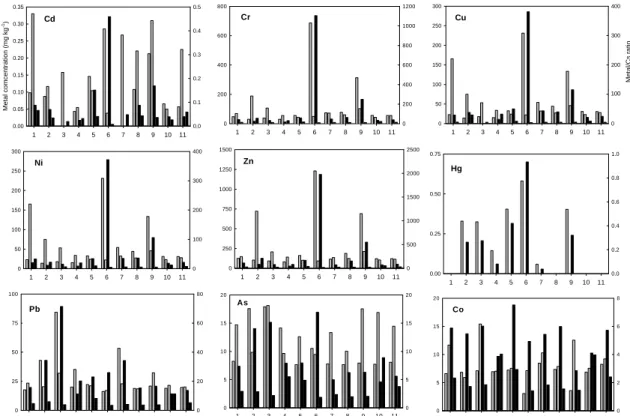
Table 1 shows the range, mean value, and stan-dard deviation of the total concentration of metals found in the sediments of all the sampling stations. Smaller variations of metal concentrations in Lang-yang River, in terms of covariance value, were found. For the Erh-jen River (Fig. 3), elevated concentrations of Cd, Cr, Cu, Ni and Zn were found mostly at EJ1, EJ2 (located downstream of the San-ye-gong River), EJ6 (located downstream of Wan-li pumping station)
1st sampling period 2nd sampling period 1st sampling period 2nd sampling period
Table 1. Concentrations of metals in surface sediment from the rivers investigated Cd Cr Pb Cu Ni Zn As Co Hg Cs Fe Al Mn FGa LY Riverb max. 0.416 140 43.7 48.4 67.5 204 27.1 18.1 < 0.07 9.92 7.52 8.79 850 81 min. 0.045 32.0 15.3 14.0 21.0 61.9 6.74 7.36 < 0.07 0.80 1.17 0.65 146 2.9 mean 0.208 59.3 22.1 24.5 32.3 109 11.3 9.95 < 0.07 3.37 2.84 3.24 339 43 SDc 0.135 30.6 7.15 9.53 14.0 53.8 5.25 3.55 < 0.07 2.79 1.76 2.71 187 22 CVc (%) 65 52 32 39 43 49 47 36 ─ 83 62 84 55 51 EJ Riverb max. 0.33 687 84.3 237 231 1230 18.1 15.4 0.58 8.62 5.81 8.00 810 91 min. < 0.0001 29.9 16.2 < 0.005 14.1 81.4 7.73 3.07 < 0.07 0.62 0.98 0.578 77.5 0.1 mean 0.140 105 27.2 52.3 52.6 234 11.9 7.93 0.25 2.97 2.47 3.46 333 59 SDc 0.096 144 15.8 52.2 54.7 282 3.91 2.71 0.17 2.36 1.27 2.27 181 30 CVc(%) 71 137 58 99 104 121 33 34 69 80 52 66 54 51 a FG: % fine grained (< 62.5 μm). b
Concentration in mg kg-1 on dry basis, except Fe, Al and fine grain (FG) in %; 20 samples for LY River and 22 samples for EJ River.
c
SD: standard deviation; CV: covariance.
1 2 3 4 5 6 7 8 9 10 11 M e tal con c e n tra t ) 0.00 0.05 0.10 0.15 0.20 0.25 0.30 0.35 0.0 0.1 0.2 0.3 0.4 0.5 Cd 1 2 3 4 5 6 7 8 9 10 11 0 200 400 600 800 0 200 400 600 800 1000 1200 Cr 1 2 3 4 5 6 7 8 9 10 11 0 50 100 150 200 250 300 0 100 200 300 400 Ni 1 2 3 4 5 6 7 8 9 10 11 0 250 500 750 1000 1250 1500 0 500 1000 1500 2000 2500 Zn 1 2 3 4 5 6 7 8 9 10 11 0.00 0.25 0.50 0.75 0.0 0.2 0.4 0.6 0.8 1.0 Hg 1 2 3 4 5 6 7 8 9 10 11 0 20 40 60 80 25 75 0 50 100 Pb 1 2 3 4 5 6 7 8 9 10 11 0 5 10 15 20 0 5 10 15 20 As 1 2 3 4 5 6 7 8 9 10 11 0 5 10 15 20 0 2 4 6 8 Co 1 2 3 4 5 6 7 8 9 10 11 0 50 100 150 200 250 300 Me ta l/ Cs r a ti o 0 100 200 300 400 Cu
Fig. 3. Site variations of metal concentrations and normalization ratios in EJ1 to EJ11 of Erh-jen River. Grey bars are metal concentrations (left Y-axis) and black bars are metal/Cs ratios (right Y-axis). Every two bars of the same color represent the results of 1st (May) and 2nd (September) sampling periods.
and EJ9 (the right bank of the river mouth), while those of Hg and Pb were at EJ6 and EJ3, respectively. The distribution of As and Co showed no obvious source. Reduced concentrations of all trace metals were mostly found at EJ4, EJ5, EJ7, EJ8 EJ10 and EJ11.
3. Metals and Fine-grained Sediment
The % fine-grained sediment is highly correlated
with the concentrations of Al and Fe found in Keelung River [14] and in the East China Sea continental shelf sediments [13]. In Lan-yang River, there were moder-ate correlations in the concentrations of almost all the investigated metals and % fine-grained sediments (r ranged from 0.32 to 0.51), except for Cd with a high-est r value (0.72) and for As with a lowhigh-est r value (0.25) (Table 2). In Erh-jen River, however, the corre-lations varied among the trace metals (Table 3). Fur-thermore, Cr, Cu, Ni and Zn in Erh-jen River show
Metal/Cs ratio
100
Metal comcentration (mg kg
Table 2. Correlation coefficient (r) matrix of metals in total sediments of Lan-yang Rivera Correlation, r Cd Cr Pb Cu Ni Zn As Co Cs Fe Al Mn FGb Cd 1.00 Cr 0.78 1.00 Pb 0.75 0.96 1.00 Cu 0.84 0.92 0.92 1.00 Ni 0.78 0.99 0.96 0.93 1.00 Zn 0.84 0.94 0.96 0.95 0.95 1.00 As 0.72 0.94 0.95 0.92 0.94 0.94 1.00 Co 0.74 0.96 0.94 0.90 0.98 0.89 0.91 1.00 Cs 0.80 0.95 0.87 0.87 0.93 0.86 0.85 0.92 1.00 Fe 0.76 0.98 0.94 0.90 0.96 0.94 0.89 0.92 0.94 1.00 Al 0.79 0.97 0.88 0.90 0.94 0.88 0.89 0.92 0.98 0.94 1.00 Mn 0.68 0.91 0.81 0.80 0.92 0.77 0.80 0.93 0.93 0.87 0.92 1.00 FGb 0.72 0.41 0.32 0.47 0.40 0.37 0.25 0.43 0.51 0.40 0.49 0.42 1.00 a Significant at P < 0.05 (n = 20). bAs specified in Table 1.
Table 3. Correlation coefficient matrix of metals in total sediments of Erh-jen Rivera
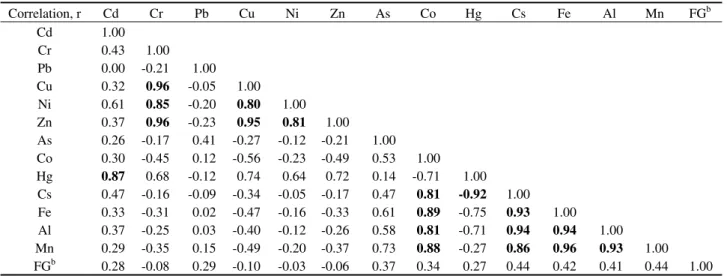
Correlation, r Cd Cr Pb Cu Ni Zn As Co Hg Cs Fe Al Mn FGb Cd 1.00 Cr 0.43 1.00 Pb 0.00 -0.21 1.00 Cu 0.32 0.96 -0.05 1.00 Ni 0.61 0.85 -0.20 0.80 1.00 Zn 0.37 0.96 -0.23 0.95 0.81 1.00 As 0.26 -0.17 0.41 -0.27 -0.12 -0.21 1.00 Co 0.30 -0.45 0.12 -0.56 -0.23 -0.49 0.53 1.00 Hg 0.87 0.68 -0.12 0.74 0.64 0.72 0.14 -0.71 1.00 Cs 0.47 -0.16 -0.09 -0.34 -0.05 -0.17 0.47 0.81 -0.92 1.00 Fe 0.33 -0.31 0.02 -0.47 -0.16 -0.33 0.61 0.89 -0.75 0.93 1.00 Al 0.37 -0.25 0.03 -0.40 -0.12 -0.26 0.58 0.81 -0.71 0.94 0.94 1.00 Mn 0.29 -0.35 0.15 -0.49 -0.20 -0.37 0.73 0.88 -0.27 0.86 0.96 0.93 1.00 FGb 0.28 -0.08 0.29 -0.10 -0.03 -0.06 0.37 0.34 0.27 0.44 0.42 0.41 0.44 1.00 a Significant at P < 0.05 (n = 22). b As specified in Table 1.
negative correlations with % fine-grained sediment. Correlations between trace metal concentrations and % fine-grained sediment were not as good as those shown in other studies [13,14], especially for the Erh-jen River. It seems that grain size effect does not exclusively control the distribution of trace metals. Metals accumulated to a less extent, or irregularly in fine-grain fractions were also found in a heavily con-taminated bay [20]. Tam and Wong [25] also found that the differences of trace metal concentrations be-tween fine-grained and sand-sized fractions became less significant when the site was more contaminated, which suggested that excess metals from non-natural sources may be accumulated in the sand-sized fraction. Since total samples were analyzed in this study, all components would be dissolved, including rock frag-ments comprising a multitude of minerals containing a whole range of metals. It is reasonable that there is not an obvious association between grain size and metal
concentration. However, the correlation in Lan-yang River showed better than that in Erh-jen River. It is suggested that the moderate correlation in less pol-luted Lan-yang River may be caused by total digestion for samples and poor correlation in more polluted Erh-jen River may be caused by large metal inputs that re-duces the correlation.
4. Elemental Normalization Using Cs
For the four reference elements, Cs, Fe, Al and Mn, significant correlations existed between Cs concentrations and % fine-grained sediment in Lang-yang River (r = 0.51; p < 0.05, n = 20) (Table 2). In Erh-jen River, although the correlations between the concentrations of the four reference elements and % fine-grained sediment were similar (r = 0.41 to 0.44; p < 0.05, n = 22) (Table 3), the r values for Cs and Mn were slightly higher than the others. The reliability of
either Fe or Al as a reference element may not be ade-quate when contaminant sources comprise a large quantity of the two elements [10]. Moreover, the mo-bility of Mn is affected by oxic conditions [12,14]. Because there is usually a lack of anthropogenic sources for Cs and the r-value for Cs was higher than that for the other reference elements in both investi-gated estuaries, Cs is chosen as a normalizer. The concentrations of Cs tend not to be interfered by an-thropogenic sources. However, the response of Cs with natural concentration in inductively coupled plasma/atomic emission spectrometry (ICP/AES) is too low to be quantitated. This problem could be re-solved by using other spectrometry, such as ICP-MS as applied in the present study.
Figure 3 shows the distribution of trace metal concentrations and the ratio values of trace metal con-centrations normalized with Cs contents in Erh-jen River. Different from the high total trace metal con-centrations mostly found at EJ1, EJ2, EJ6 and EJ9 for Cd, Cr, Cu, Ni and Zn, the normalized ratios revealed that the foremost contaminated site is EJ6 and the sec-ond is EJ9 for these metals. It is suggested that the high total metal concentrations of EJ1 (Cd, Cu and Ni) and EJ2 (Zn) are due to the high % fine-grained sedi-ment (Fig. 2b). EJ9, which is near the river mouth but far from any known discharging sources, with lower or comparable concentrations and higher normaliza-tion ratios than some other sites (Cu, Ni and Zn) indi-cates that suspension solids from contaminated sources are transported to downstream of the river. However, EJ7, EJ8, EJ10 and EJ11 are not high in concentrations in the similar way to EJ9 that may due to the more intensive hydrodynamic flushing for the-ses sites than that for EJ9. According to the results, the region around EJ9 would be a vulnerable area for discharging sources.
5. Correlation between Metals
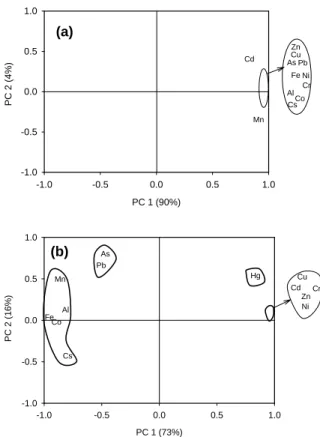
Results of PCA for metals in sediments of all the sampling stations are shown in Fig. 4. Since all Hg concentrations in Lan-yang River sediments were be-low the detection limit (0.07 mg kg-1), only twelve metals were analyzed from Lan-yang River, while thirteen, including Hg, were analyzed in Erh-jen River. Component 1 for Lan-yang River, with a high eigen-value (10.8), can explain up to 90% of the total vari-ance. However, component 2 (eigenvalue 0.45) can explain only 4% of the total variance. It appears that the distribution characteristics of metals in Lan-yang River mainly focus on component 1. The high positive loadings of component 1 for the 12 metals show that all the metals, including reference elements, are mostly originated from the identical source (Fig. 4a). Also, the r between any two metals of Lan-yang River show that the levels of trace metals associate strongly with those of the reference elements (Table 2). Thus,
PC 1 (90%) -1.0 -0.5 0.0 0.5 1.0 PC 2 (4%) -1.0 -0.5 0.0 0.5 1.0 Cd Mn Cu As Pb Fe Zn Ni Cr Al Co Cs (a) PC 1 (73%) -1.0 -0.5 0.0 0.5 1.0 P C 2 ( 16%) -1.0 -0.5 0.0 0.5 1.0 Mn Pb As Al Fe Co Cs Hg Cu Cd Cr Zn Ni (b)
Fig. 4. Loading plot of principal component analysis of metal concentrations for (a) Lan-yang River and (b) Erh-jen River.
the concentrations of trace metals in Lan-yang River may originate from the natural sources.
Components 1 and 2 can explain about 73 and 16%, respectively, of the total variance for Erh-jen River. There are high positive loadings on Cd, Cr, Cu, Ni, Zn and Hg (metals of Group 1) and high negative loadings on Cs, Fe, Al and Mn along the axis of com-ponent 1 (Fig. 4b). Comcom-ponent 1 may represent the characteristic of concentration variation. The concen-trations of Cr, Cu, Ni and Zn are associated strongly with each other (r > 0.8, in Table 3) and the concentra-tions of Hg and Cd associated moderately with those of Cr, Cu, Ni and Zn (r > 0.32, in Table 3), but the metals of Group 1 correlated poorly or negatively with the concentrations of Cs, Fe, Al and Mn. It implies that these six trace metals originate from anthropo-genic sources, rather than from the natural sources. The loading plot shows that metals of Group 1 tend to cluster closely along the axis of component 1, which indicates they might be discharged from the same sources or had similar depositional activities. There should be another source accounting for Pb and As (metals of Group 2). The loadings of the two elements were similar to those of the reference elements along the axis of component 1 (Fig. 4b), which implies these two elements possibly originating from the no-distinct-discharging sources or less heavy anthropo-genic sources. The loading of Co (metal of Group 3)
located into the cluster of Cs, Fe, Al and Mn, and high r values with the reference elements (r = 0.81 to 0.89, in Table 3), which show that Co should originate from geogenic sources.
For the component 2 of the Erh-jen River (Fig. 4b), Hg, As, Pb and Mn show higher positive loadings than the other metals. Some of the species of Hg are organomercurys, which are covalent compounds with different partition behavior from ions. The formation process of organomercurys occurs in the sediments of rivers, especially under anaerobic conditions [26] as in the case of Erh-jen River. The negative charges of As oxyanions produce repulsion interactions toward min-eral grain surfaces and therefore facilitate the mobility of As in water. Manganese is an ORP sensitive ele-ment and its mobility increases under anoxic condi-tions [12,14]. It is suggested that the medium loading of Pb on the component 2 may be due to the compli-cated chemistry of the sediments and is worthy of fur-ther study. With these associations of medium positive loading on Hg and Mn, and high positive loading on As, component 2, the minor component, implies the characteristic of mobility potential for metals.
CONCLUSIONS
Metal concentrations of total sediment and fine-grained fractions of estuarine sediment vary widely. Total sediment analyses could be used to assess the quality of sediment. However, the ratios normalized with a reference element to reduce the size effect would be useful to determine the pollution sources and the impacted regions due to hydrodynamic movement e.g., dispersion and accumulation/deposition pathways. Thus, they symbolize different environ-mental meanings and both offer valuable information for pollution control and environmental impact as-sessment.
Trace heavy metals clustered closely with the reference elements in the PCA results and correlated very well for Lan-yang River, which disclosed that Lan-yang River is not polluted by anthropogenic sources. Results from the statistical analysis show that trace metals of Erh-jen River may originate from three sources: anthropogenic source for Cd, Cr, Cu, Ni, Zn and Hg, no-distinct-discharge sources for Pb and As, and geogenic source for Co. The correlations between trace metals and fine-grained fraction (< 62.5 μm) were not significant for the polluted Erh-jen River. Total sediment analyses show the quality of Erh-jen River, while the ratios normalized with Cs contents indicate the possible pollution sources and the down-stream impacted site. Sites with a high total concentra-tion of trace metals and sites with high Cs-normalized ratio may not coincide.
ACKNOWLEDGMENTS
Authors thank the financial support of
Environ-ment Protection Agency (Contract No.: EPA-91-L102-02-220) and National Science Council of Tai-wan (NSC 91-2211-E-002-029).
REFERENCES
1. Förstner, U. and G.T.W. Wittmann, Metal Pollution in the Aquatic Environment. Springer-Verlag, Berlin (1981).
2. Calmano, W., J. Hong and U. Förstner, Binding and mobilization of heavy metals in contaminated sediments affected by pH and redox potential. Water Sci. Technol., 28(8-9), 223-235 (1993). 3. Wen, X. and H.E. Allen, Mobilization of heavy
metals from Le An River sediment. Sci. Total Environ., 227(2-3), 101-108 (1999).
4. Guieu, C., J.M. Martin, S.P.C. Tankéré, F. Mousty, P. Trincherini, M. Bazot and M.H. Dai, On trace metal geochemistry in the Danube River and Western Black Sea. Estuar., Coast. Shelf Sci., 47(14), 471-485 (1998).
5. Zhang, W., L. Yu, S.M. Hutchinson, S. Xu, Z. Chen and X. Gao, China’s Yangtze Estuary: I. Geomorphic influence on heavy metal accumulation in intertidal sediments. Geomorphology, 41(2-3), 195-205 (2001).
6. Birch, G.F. and S.E. Taylor, The use of size-normalized procedures in the analysis of organic contaminants in estuarine sediments. Hydrobiology, 431, 129-133 (2000).
7. Singh, M., G. Müller and I. B. Singh, Geogenic distribution and baseline concentration of heavy metals in sediment of the Ganges River, India. J. Geochem. Explor., 80(1), 1-17 (2003).
8. Windom, H.L., S.J. Schropp, F.D. Calder, J.D. Ryan, R.G. Smith Jr., L.C. Burney, F.G. Lewis and C.H. Rawlinson, Natural trace metal concentration in estuarine and coastal marine sediments of the southeastern Unites State. Environ. Sci. Technol., 23(3), 314-320 (1989).
9. Suh, J.Y. and G.F. Birch, Use of grain-size and elemental normalization in the interpretation of trace metal concentrations in soils of the reclaimed area adjoining Port Jackson, Sydney, Australia. Water Air Soil Pollut., 160(1-4), 357-371 (2005).
10. Liu, W.X., X.D. Li, Z.G. Shen, D.C. Wang,
O.W.H. Wai and Y.S. Li, Multivariate statistical study of heavy metal enrichment in sediments of the Pearl River Estuary. Environ. Pollut., 121(3), 377-388 (2003).
11. Soto-Jiménez, M.F. and F. Páez-Osuna,
Distribution and normalization of heavy metal concentrations in mangrove and lagoonal
sediments from Mazatlán Harbor (SE gulf of California). Estuar. Coast. Shelf Sci., 53(3), 259-274 (2001).
12. Goldberg, E.D., J.J. Griffin, V. Hodge, M. Koide and H. Windom, Pollution history of the Savannah River estuary. Environ. Sci. Technol., 13(13), 588-594 (1979).
13. Lin, S., I.J. Hsieh, K.M. Huang and C.H. Wang, Influence of the Yangtze River and grain size on the spatial variations of heavy metals and organic carbon in the East China Sea continental shelf sediments. Chem. Geo., 182(2-4), 377-394 (2002).
14. Huang, K.M. and S. Lin, Consequences and
implication of heavy metal spatial variations in sediments of the Keelung River drainage basin, Taiwan. Chemosphere, 53(9), 1113-1121 (2003).
15. Matthai, C. and G.F. Birch, Detection of
anthropogenic Cu, Pb and Zn in continental shelf sediments off Sydney, Australia - A new approach using normalization with cobalt. Mar. Pollut. Bull., 42(11), 1055-1063 (2001).
16. Taiwan Environmental Protection Agency,
Yearbook of Environmental Protection Statistics: 2004, Taipei, Taiwan (2005). (in Chinese)
17. USEPA, Microwave Assisted Acid Digestion of Siliceous and Organically Based Matrices. SW-846-3052, Washington, DC (1996).
18. Soares, H.M.V.M., R.A.R. Boaventura, A.A.S.C. Machado and J.C.G. Esteves da Silva, Sediments as monitors of heavy metal contamination in the Ave river basin (Portugal): Multivariate analysis of data. Environ. Pollut., 105(3), 311-323 (1999). 19. Doong, R.A., Y.C. Sun, P.L. Liao, C.K. Peng and
S.C. Wu, Distribution and fate of organochlorine pesticides residues in sediments from the selected rivers in Taiwan. Chemosphere, 48(2), 237-246 (2002).
20. Ujević, I., N. Odžak and A. Barić, Trace metal accumulation in different grain size fractions of the sediments from a semi-enclosed bay heavily contaminated by urban and industrial wastewaters. Water Res., 34(11), 3055-3061 (2000).
21. Führer, U. and K. Ballschmiter, Bromochloro-
methoxybenzenes in the marine troposphere of the Atlantic Ocean: A group of organohalogens with mixed biogenic and anthropogenic origin. Environ. Sci. Technol., 32(15), 2208-2215 (1998).
22. Chang, J.S., K.C. Yu, L.J. Tsai and S.T. Ho,
Spatial distribution of heavy metals in bottom sediment of Yenshui River, Taiwan. Water Sci. Technol., 38(11), 159-167 (1998).
23. Tsai, L.J., K.C. Yu, J.S. Chang and S.T. Ho,
Fractionation of heavy metals in sediment cored from the Ell-ren River, Taiwan. Water Sci. Technol., 37 (6-7), 217-224 (1998).
24. Yu, K.C., L.J. Tsai, S.H. Chen and S.T. Ho,
Correlation analyses on binding behavior of heavy metals with sediment matrices. Water Res., 35(10), 2417-2428 (2001).
25. Tam, N.F.Y. and Y.S. Wong, Spatial variation of heavy metals in surface sediments of Hong Kong mangrove swamps. Environ. Pollut., 110(2), 195-205 (2000).
26. Baird, C. and M. Cann, Environmental Chemistry.
3rd Ed., W.H. Freeman and Company, New York
(2004).
Discussions of this paper may appear in the discus-sion section of a future issue. All discusdiscus-sions should be submitted to the Editor-in-Chief within six months of publication.
Manuscript Received: January 5, 2007 Revision Received: March 6, 2007 and Accepted: March 18, 2007