A Dynamic Competition Analysis on the Personal
Computer Shipments in Taiwan Using Lotka-Volterra
Model
Su-Yun Chiang
1,2, Gwo-Gauang Wong
2, Yiming Li
1,3,*, and Hsiao-Cheng Yu
11 Institute of Management of Technology, National Chiao Tung University, Hsinchu 300, Taiwan 2 Department of International Business Management, Lan Yang Institute Technology, I Lan, 26141, Taiwan
3 Department of Communication Engineering, National Chiao Tung University, Hsinchu 300, Taiwan *E-mail address: ymli@faculty.nctu.edu.tw
Abstract—In this work, we explore the innovative growth of
personal computer (PC) shipments in Taiwan. We estimate the marketing diffusion with the consideration of the competition of desktop (DT) and notebook (NB). Mathematically, using the Lotka-Volterra model, we analyze the dynamic competitive relationship between the shipments of DT and NB. All the parameters in the Lotka-Volterra model are calibrated with the realistic shipment data, and the predicted trends to 2010 are thus drawn. Our results clarify a pure competition between DT and NB in PC market. The competitive relationship of dynamic PC shipments in Taiwan is thus examined, including consideration of the interaction between two species to explain the actual diffusion phenomenon in the competitive market. Comparison between well-known growth model, Bass model, and competitive Lotka-Volterra Model is also drawn. In addition, it is shown that the competition between DT and NB would reach an equilibrium point which is stable over time and we further analyze how the deviation returns to the stable equilibrium.
Keywords-Personal Computers, Competition, Marketing, Diffusion, Equilibrium, Bass model, Lotka-Volterra model
I. INTRODUCTION
Due to the facts that a large portion of personal computer users are in America and the global environment of PC production is influenced by the subprime mortgage crisis in Unite States, all the American government, enterprises and their consumers tend to a conservative attitude toward PC consumption. In addition, the higher oil price and the relative weak tendency of American economy influence the consumer's confidence and disposable incomes, which cause the demand of PCs to be relatively weak in 2007. Personal computer industry was with quite high concentration originally. It becomes more highly concentrated now. Taking the notebook (NB) as an example, the market share of five
concentration degree of computer industry is still rising continuously. Because the sources of original design manufacturer (ODM) orders of PCs are more concentrated on a few global brand firms and the gross profit of ODM manufacturers falls steadily, the ODM manufacturers who hold the orders can maintain the basic revenues. Thus, a lot of ODM manufacturers would rather sustain the economic losses to get the orders, and increase the PC shipments, which cause more difficulty to make a profit for ODM firms of PCs. The ODM of PCs has been the main business of information technology (IT) industry in Taiwan, and the PC business has also been the main item of development for the manufacturers all the time. As PC industry becomes more mature, the yield rate of products turns out to be lower and lower. However, the ODM firms in Taiwan own the fast adaptability, the strong design and manufacturing abilities, which cause the ODM firms in Taiwan to be recognized by the global brand manufacturers of PCs and thus win the huge influence power in global PC industry. As to the NB price being gradually decreasing, consumers can have more choices so that the desktop (DT) users have the greater inducements to turn to purchasing the NB computers.
Summarizing above, it is extremely competitive in the PC market over the world and this article is in terms of the competition of DT and NB shipments in Taiwan to analyze the aspects of PC market’s growth using the Lotka-Volterra diffusion model. In earlier literature, the basic growth model introduced by Bass [1, 2] is a well known model for the estimation of marketing diffusion. The model is based on that there is a direct relationship between the numbers of potential adopters and previous adopters. The original adopters are referred to as the innovator, whereas the later adopters are considered to be imitators. The Bass model has been advanced to consider the marketing mix [3]. However, it is a
2008 IEEE Asia-Pacific Services Computing Conference
substitution model based on the assumption that a new technology would displace an older established technology. A simple formula generates an S-curve that can be transformed into a straight line. Fisher and Pry showed the examples that were simplistic but effective. However, the weakness of the Fisher and Pry model does not show their competition. An industry structure must exhibit the status of natural competition for the competitive species. The Norton and Bass [5] model further took the Bass model as its core driver and incorporated the Fisher and Pry model to demonstrate the substitution effect. It can be used to forecast technological market growth or decline, In addition, when more than one technology in a single market is analyzed by the Norton and Bass model, the substitution point of the older technology by the newer technology can be identified and used in subsequent market planning. Yet a major shortcoming of the Norton and Bass model is that it can not exhibit the dynamic competition between two technologies [6]. In early literatures, papers of competition in PC were almost in qualitative research. The term competition is often used in the innovation and industry of management field. The meaning of competition is generally understood but is not usually given description clearly. Many researchers applied the Bass model to explore the diffusion marketing of PCs, but did not consider that the diffusion of DT would threaten the diffusion of NB. Hence many researchers tried to find a better method to solve this kind of problem. Among these, the mathematical Lokta-Voterra model was used in many papers and it could well explore the diffusion phenomenon and reciprocal competition of two species. Though the Lokta-Voterra model was used to describe the competition between two species in many papers [7-13], the competition of DT and NB has not been well explored yet.
In this work, we for the first time use the mathematical Lokta-Voterra model to investigate the competition of DT and NB which consider the interaction between two species based on the logistic curve [14], The Lotka-Volterra model with the historical data fitting of the shipments of DT and NB manufactured in Taiwan gives us the dynamic competitive interaction in PC market. In addition, the errors of simulation results are used to compare the performance of Bass model and Lotka-Volterra model. A stable equilibrium point of the cumulative shipments of DT and NB was also explored. This paper is organized as follows. In Sec. 2, we state the model and data for the marketing dynamics of the PC shipments in Taiwan. In Sec. 3, we show the result of the estimation of the Lotka-Volterra equations, comparison of the Bass model and Lotka-Volterra model and analysis of equilibrium. Finally, we draw conclusions.
II. THE THEORETICAL MODEL AND COLLECTED DATA
1. Lotka-Volterra model
For one species, the differential equation (DE) that underlines logistic growth can be expressed as [14]:
2 bN aN dt
dN= − , (1)
where the demand function N(t) denotes the cumulative number of adopters in a market at time t. The above DE results in an S-curve forN(t).
Turning to the two species interaction mutually within the multi-mode framework, the Lotka-Volterra model uses the logistic equation as basis plus a term accounting for the interaction with the other species. The interaction between two competitors can be expressed in two DEs, as follows [8-9]:
XY c X b X a X Y c X b a dt dX 1 2 1 1 1 1 1 ) ( − − = − − = , (2) and YX c Y b Y a Y X c X b a dt dY 2 2 2 2 2 2 2 ) ( − − = − − = , (3)
where the demand functionsX and Y represent the populations or demand functions (i.e., the cumulative numbers of adopters) of two competing species at time t . Hence, in Eqs. (2) and (3),
2
X and Y2 terms represent the same species interacting with itself. The terms XY and YX show different species interacting with the other. a is the parameter of geometric i growth for the species i when it is living alone, b is the i parameter of the niche capacity for the species i , and c called i the coupling coefficient is the interaction parameter with the other species. The multi-mode form is illustrated in Table 1 for the case of two species.
Although there are five types of modes, note that there are two possible predator-prey interactions (depending on which technology is the predator or prey) in predator-prey mode and two possible states (depending on which technology is the stronger of the two) in amensalism model.
2. Bass model
In this study, we also use the Bass model [1, 2] to compare with the Lotka-Volterra model for the growth of DT and NB diffusion. Under several assumptions [1, 2], the dynamics of the growth for each species in the Bass model is of the form
(
a bNt)
(
M N( )
t)
dt t dN = + − ) ( ) ( , (4)where N(t) is the cumulative number of adopters at time t, and M is the potential market (i.e., the total number of all possible adopters in the marketing system). The parameter a is called the coefficient of innovation, and b the coefficient of imitation. The product adopters are categorized as “innovators” and “imitators”. The importance of innovators will be greater at first but will diminish with time, while the imitation effect will increase with time.
Table 1 The relationship according to the signs of c1 andc2.
1
c c2 Type Explanation
+ + Pure competition Both species suffer from each other’s existence.
+ - Predator-prey One of them serves as direct food to the other.
- - Mutualism It is the case of symbiosis or a win-win situation.
- 0 Amensalism One suffers from the existence of the other, who is impervious to what is happening.
0 0 Neutralism There is no interaction.
3. Assumptions and Samples
In our work, it is assumed that the competitive situation of the PC market shipments in Taiwan corresponds to the original condition of Lotka-Volterra model as follows: First, the competing field is under the environment of global PC market. Second, there are only two competing species, DT and NB computers, to be concerned. Third, the constrained resources of two competing species are PC customers within the global PC market. In analyzing the competitive PC shipments in Taiwan, there are many manufactures and variables in the PC market. The Lotka-Volterra model is just of a simple form mathematically and we use it to describe DT as the first generation species and NB as the second-generation species. We then analyze the competing relationship between two PC species when an entrant NB appears under the monopoly of original DT computers. Therefore we consider two products, DT and NB, as major species in the global PC market.
The data are obtained from the Department of Statistics, Ministry of Economic Affairs in Taiwan. The shipments of DT and NB only come from manufacturing firms in Taiwan; namely, they do not include the Taiwan firms investing in Mainland China. The period of our samples is from 1998, the year of NB entry, to 2007. During this period, we estimate the diffusion curve with yearly data and examine the changes of the competitive relationship between DT and NB.
III. RESULTS
1. Estimation of the Lotka-Volterra equations
In our work, we mainly use the Lotka-Volterra model in simulating the shipments of DT and NB manufactured in Taiwan. In Lotka-Volterra model, we have two first order differential equations where X and Y stand for the yearly cumulative shipments of DT and NB, and can be generated from dX /dt and dY/dt, the datasets of yearly shipments of DT and NB. From the differential equations, we know that
dt
dX/ is a linear combination of functions X , X2 and XY , and similarly fordY/dt. The coefficients in Lotka-Volterra model can then be estimated first by using multiple linear regression analysis. Next, we solve the set of differential equations with the estimated parameters numerically using the Runge-Kutta algorithm. All of these have been done with the
codes of Mathematica® 5.0. The estimations of competing relationship between DT and NB are shown in Tabs. 2 and 3.
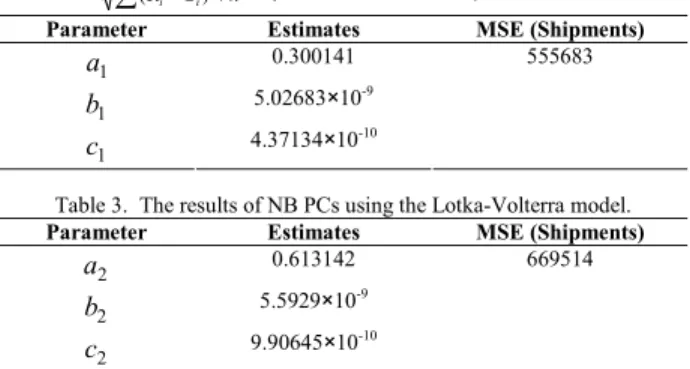
Table 2. The results of DT PCs using the Lotka-Volterra model, where MSE =
∑
R−S ni
i ) /
( 2 , Ri=realistic data and S = simulation result. i
Parameter Estimates MSE (Shipments) 1 a 0.300141 1 b 5.02683×10⁻⁹ 1 c 4.37134×10⁻¹⁰ 555683
Table 3. The results of NB PCs using the Lotka-Volterra model.
Parameter Estimates MSE (Shipments) 2 a 0.613142 669514 2 b 5.5929×10⁻⁹ 2 c 9.90645×10⁻¹⁰
From the estimation results, both of the parameters c1 and c2 in the interaction terms of DT and NB are positive. By judging the competition situation from the multi-mode of Lotka-Volterra model (Table 1), it tells us that the interaction of DT and NB have a pure competition relationship. Pure competition [15-27] means that each product of DT and NB exerts a negative influence on the other’s growth and the competition between DT and NB is often embodied in the threat of substitutes, which have been recognized as a powerful force in competition. Eminent scholar, Porter, considered substitutes as one of the five forces in his model of industrial competition [27]. The five forces model addresses that substitutes are of the same market niche as existing products. They in general have an inhibiting effect on an existing product in the sense that they serve the same niche.
Table 4. The results of DT PCs using the Bass model.
Parameter Estimates MSE (Shipments)
a -0.028734 561031
b 7.97704×10⁻⁹
M 5.21827×10⁷
Table 5. The results of NB PCs using the Bass model.
Parameter Estimates MSE (Shipments)
a 0.001394 3555452 b 5.63046×10⁻⁹
M 1.00454×10⁸
According to our simulated shipments of DT and NB manufactured in Taiwan, it shows that emerging product NB has the negative influence on the growth of a mature product DT, and the mature product DT also has a negative influence on the growth of the emerging product NB. Both of their predicted trends to 2010 tend to the decline stage of product’s life cycle, which we presume the reason is that computer manufacturing firms in Taiwan have been greatly transferring to the Mainland China and setting up the factories in recent years. The shipments and cumulative shipments of DT and NB obtained from the estimated demand functionsdX/dt, dY/dt and X ,Y are illustrated in Figs. 1 and 2, respectively. We see that the estimated demand functions show almost the same trend as the actual data, which implies that the Lotka-Volterra
model can well explain the diffusion process of the shipments of DT and NB manufactured in Taiwan.
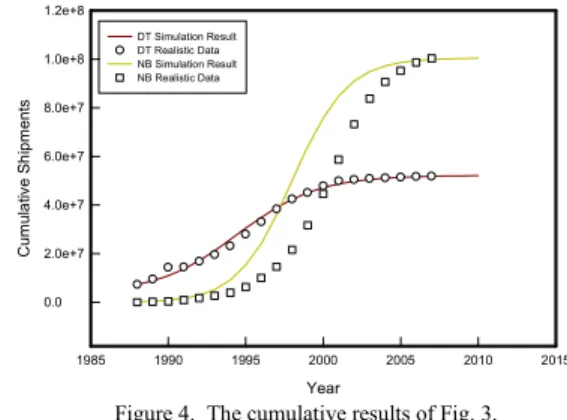
2. Comparison of the Bass model and Lotka-Volterra model To further demonstrate the performance of the Lotka-Volterra model. The Bass model expressed in Eq. (4) is used to compare with the Lotka-Volterra model. In fact, dX /dtcan be written as a linear combination of functions 1,XandX2in Bass model. Hence the same technique used in the Lotka-Volterra model can be applied to the Bass model directly. As in the Lotka-Volterra model, we simulate the shipments of DT and NB manufactured in Taiwan during the period of 1988 to 2007, and then forecasts the yearly shipments from 2008 to 2010 in Bass model. The estimated parameters and related errors are shown in Table 2 to Table 5. The simulation results are illustrated in Figs. 1 to 4. The forecasts by Lotka-Volterra model show the similar trend as the actual DT and NB shipments while the forecasts by Bass model show the trend deviated from the real data by two years earlier in NB case.
Year 1985 1990 1995 2000 2005 2010 2015 Shi pment s -2.0e+6 0.0 2.0e+6 4.0e+6 6.0e+6 8.0e+6 1.0e+7 1.2e+7 1.4e+7 1.6e+7 DT Simulation Result DT Realistic Data NB Simulation Result NB Realistic Data
Figure 1. The simulated and realistic shipments versus time with Lotka-Volterra model in years 1988-2007 for DT and NB manufactured in Taiwan.
Year 1985 1990 1995 2000 2005 2010 2015 C u m ula tiv e Sh ip m e nt s 0.0 2.0e+7 4.0e+7 6.0e+7 8.0e+7 1.0e+8 1.2e+8 DT Simulation Result DT Realistic Data NB Simulation Result NB Realistic Data
Figure 2. The cumulative results of Fig. 1.
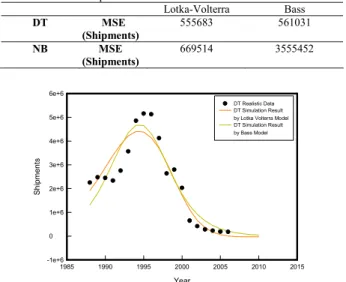
In order to compare the performance of two models, the forecasting errors of each model are measured by MSE (Mean Square Error) and presented in Table 6. It shows that the shipment error of the Bass model is slightly greater than that of Lotka-Volterra model in DT case. Even worse, the shipment error of Bass model is about five times higher than that of the
Lotka-Volterra model in NB case. To compare the performance of DT and NB in Bass model and Lotka-Volterra model, we combine the simulation results of both models with the realistic data in Fig. 5 and Fig. 6. Obviously, it certifies that the performance of Lotka-Volterra model is superior to that of the parsimonious Bass diffusion model. Thus, it is recommended to use the competitive diffusion model like Lotka-Volterra equations (1) and (2) to analyze any product or firm in competitive market to reflect the interaction of two species in competition situation. Year 1985 1990 1995 2000 2005 2010 2015 Shi pme nt s 0.0 2.0e+6 4.0e+6 6.0e+6 8.0e+6 1.0e+7 1.2e+7 1.4e+7 1.6e+7 DT Simulation Result DT Realistic Data NB Simulation Result NB Realistic Data
Figure 3. The simulated and realistic shipments versus time with Bass model in years 1988-2007 for DT and NB manufactured in Taiwan.
Year 1985 1990 1995 2000 2005 2010 2015 C um ula tiv e Sh ip m en ts 0.0 2.0e+7 4.0e+7 6.0e+7 8.0e+7 1.0e+8 1.2e+8 DT Simulation Result DT Realistic Data NB Simulation Result NB Realistic Data
Figure 4. The cumulative results of Fig. 3.
3. Competitive relationship analysis of the DT and NB market Modis [7] classified the types of competitive roles according to the signs of c1 and c2 by the Lotka-Volterra Eqs. (1) and (2), as shown in Table 1. Referring to Tabs. 2 and 3, we see that both of the interaction parameters c1 and c2 are positive showing the pure competition of DT and NB. From the simulation result, we find that each shipment of DT and NB in the beginning is dominated by the term with the parameter ai showing a rapid geometric growth, while the term with the parameter bi related to the niche size and the terms with coupling coefficient ci start to accelerate their inhibited effect. Combining these two contributions cause the shipments of DT and NB to reach their maxima in 1995 and 2000 respectively. For the DT shipments, the niche constraint effect was greater than the interaction effect before the year 2000, and the
interaction effect became stronger in later years. On the contrary, the niche constraint effect is firstly less than the interaction effect before 2004, and the interaction effect became weaker later on for the NB shipments.
DT is often discussed to be substituted by NB for many years. Some of the customers especially buying PCs for business use still focus on purchasing DT, and some of the customers especially buying PCs for personal use mainly use NB. Though NB shipments are increasing fast in the PC market, both of them still have the “price gap”. (The price of NB is still much more expensive than DT.) Furthermore, the PCs used for business purpose is difficult to get rid of the safety consideration of portability on NB. DT is still needed by users in the PC market. Hence DT will not be completely replaced by NB.
Table 6. Comparison of the Bass and Lotka-Volterra models.
Lotka-Volterra Bass DT MSE (Shipments) 555683 561031 NB MSE (Shipments) 669514 3555452 Year 1985 1990 1995 2000 2005 2010 2015 S h ipm ent s -1e+6 0 1e+6 2e+6 3e+6 4e+6 5e+6 6e+6 DT Realistic Data DT Simulation Result by Lotka Volterra Model DT Simulation Result by Bass Model
Figure 5. Comparison of the realistic data and simulation results of the Lotka-Volterra and Bass models in the DT case.
Year 1985 1990 1995 2000 2005 2010 2015 Shi pme nt s 0.0 2.0e+6 4.0e+6 6.0e+6 8.0e+6 1.0e+7 1.2e+7 1.4e+7 1.6e+7 NB Realistic Data NB Simulation Result by Lotka Volterra Model NB Simulation Result by Bass Model
Figure 6. Comparison of the realistic data and simulation results of the Lotka-Volterra and Bass models in the NB case.
4. Equilibrium analysis
In equilibrium, the cumulative shipments of DT and NB become constant over time. It represents the stability over time simultaneously for each species; that is
dt dX = 0 and dt dY = 0. (5) The DEs in Lotka-Volterra model simply become two algebraic equations: XY c X b X a X Y c X b a 2 1 1 1 1 1 1 ) ( − − = − − = 0, (6) and a b X c X Y aY bY2 c2YX 2 2 2 2 2 ) ( − − = − − = 0. (7) Removing the trivial solution, we can rewrite the above equations as 1 1 1 b Y c a X = − and 2 2 2 b X c a Y= − . (8)
Figure 7. Equilibrium point of cumulative shipments of DT and NB.
In Eqs (8), if
X
<
(
a
1−
c
1Y
)
/
b
1 , then the population of species X would increases so thatdX/dt>0, and if X >1 1
1 )/
(a −cY b, then the population of species X would decrease so that dX/dt<0. In the meantime, ifY<(a2−c2X)/b2, thendY /dt> , and if 0 Y>(a2−c2X)/b2, then dY /dt< 0. In the long run, the cumulative shipments of DT and NB will reach an equilibrium state with X =(a1−c1Y)/b1 and
2 2
2 )/
(a cX b
Y = − ; that is, the conditions dX/dt=0and 0
/dt=
dY are hold simultaneously in equilibrium. In Fig. 7, the lines near vertical and horizontal are from the equations
1 1
1 )/
(a cY b
X = − and Y=(a2−c2X)/b2 respectively. The Region I represents the area where DT and NB will decrease (dX /dt< 0, dY /dt< 0). The Region II represents the area where DT will increase and NB will decrease (dX /dt> 0,
dt
dY / < 0). The Region III represents the area where DT and NB will increase (dX /dt > 0, dY /dt > 0). The Region IV represents the area where DT will decrease and NB will increase (dX /dt < 0, dY /dt > 0). The equilibrium point (50959403, 100602513) located at the intersection of these two line certifies that the cumulative shipments of DT and NB manufactured in Taiwan could coexist without any dynamic change. The red and black arrows indicate how the trajectories of actual and simulated shipments of (DT, NB) respectively turn to the equilibrium point. In fact, the simulation result tells us that the shipments of DT grew up steadily in Region IV, and slightly crossed over the Region III in 2004, and then
started to return back to the equilibrium from the year 2007. The shipments of NB have been growing up and approaching to the equilibrium within the Region IV. The simulation result is well prepared for the actual data. The situation is almost the same for the actual data except that the returning point of the DT shipments back to equilibrium has not occurred in 2007. The turning point may occur in the near future. DT and NB have their own characteristics. When costumers decide to buy PCs, they would choose DT or NB according to their needs, such as the CPU performance, portability, price, electricity saving or business use. Therefore, DT and NB have their own consumer population and could coexist in the PC market.
IV. CONCLUSION
ODM firms for PC manufacturing in Taiwan own the fast adaptability, the strong design and manufacturing abilities, which cause ODM firms in Taiwan to be recognized by the global brand manufacturers and win the huge influence power in global PC industry. Among the matters of PC industry, the issue in future development of DT and NB is quite often discussed, especially in the topic “Will DT be substituted by NB or not?” There are various ways to answer this question. Among these, the viewpoint of competition in the market can be further used to further explore the competitive phenomenon of DT and NB, and Lotka-Volterra model can well examine about the effect of competition.
In this work, we have analyzed the dynamic relationship between the shipments of DT and NB manufactured in Taiwan. We simulated their trajectory curves with yearly datasets using the Lotka-Volterra model. The estimated parameters in our simulation result empirically show the characteristics of pure competition between DT and NB shipments in Taiwan. From the estimated parameters, it is shown that both of their predicted trends to 2010 tend to the decline stage of product’s life cycle, which we presume the reason is that computer manufacturing firms in Taiwan have greatly been transferring to the Mainland China and setting up factories in recent years. Furthermore, we compared the performance of Bass model and Lotka-Volterra model. The result exhibits that Lotka-Volterra model is superior to the Bass model. The competition between DT and NB shipments in Taiwan reach an equilibrium point which is stable over time and we further analyze how the trajectory approaches to the stable equilibrium.
Although lots of articles have analyzed the PC market in literature, there are few academic studies in exploring the competitive relationship between DT and NB by way of the Lotka-Volterra model. Thus, this work has provided an interesting contribution to the interpretation of the dynamic competitive relations in DT and NB shipments in Taiwan. This work is also meaningful in that it shows how the entry of new product, NB, changes market structure under the limited environment within single market. It can be further explored the global PC market or applied to the analysis with different species in the situation of other markets.
V. REFERENCES
[1] F. M. Bass, “A New Product Growth Model for Consumer Durables”,
Management Science, pp.215-227, 1969.
[2] F. M. Bass, “Comments on A New Product Growth Model for Consumer Durables”, Management Science, 2004.
[3] S. Kalish, “A new product adoption model with pricing, advertising and uncertainty”, Management Science, 31, pp.1569-1585, 1985.
[4] C. Fisher and R. H. Pry, “A Simple Substitution Model of Technological Change”, Technological Forecasting and Social Change, pp.75-88, 1971. [5] A. Norton and F. M. Bass, “A Diffusion Theory Model of Adoption and Substitution for Successive Generations of High-Technology Products”,
Management Science, pp.1069-1086, 1987.
[6] J. William, and B. Keith, “Technological substitution in mobile communications”, Journal of Business and Industrial Marketing, 12, No. 6, pp.383-399, 1997.
[7] T. Modis, “Technological forecasting at the stock market”,
Technological Forecasting and Social Change, 62, pp.173-202, 1999.
[8] J. Kim, D. J. Lee, & J. Ahn, “A dynamic competition analysis on the Korean mobile phone market using competitive diffusion model”,
Computers and Industrial Engineering, 51, pp.174-182, 2006.
[9] S. Lee, D. Lee, & H. Oh, “Technological forecasting at the Korean stock market: a dynamic competition analysis using Lotka-Volterra model”,
Technological Forecasting and Social Change, 72, pp.1044-1057, 2005.
[10] Y. Tang, J.W. Zhang, “A competition model for two CPU vendors”,
Physica A 348, pp.465-480, 2005.
[11] C. Watanabe, R. Kondo, N. Ouchi and H. Wei, “A substitution orbit model and competitive innovations”, Technological Forcasting & Social
Change, 71, pp.365-390, 2004.
[12] C. Watanabe, R. Kondo and A. Nagamatsu, “Policy options for the diffusion orbit of competitive innovations-an application of Lotka-Volterra equations to Japan’s transition from analog to digital TV broadcasting”, Technovation, 23, pp.437-445, 2003.
[13] A. Kamimura, S.M.G. Guerra, I.L. Sauer, “On the substitution of energy sources: Prospective of the natural gas market share in the Brazilian urban transportation and dwelling sectors”, Energy Policy, 34, pp. 3583-3590, 2006.
[14] L.A. Girifalco, Dynamics of Technological Change, Van Nostrand Reinhold, 1991.
[15] J. M. Utterback, Mastering the Dynamics of Innovation, (Harvard Business School Press, Cambridge, MA), 1994.
[16] M. L. Tushman and P. Anderson, “Technological discontinuities and organizational environments”, Administrative Science, Quarterly 31, pp. 439-465, 1986.
[17] P. Anderson and M.L. Tushman, “Technological discontinuities and dominant designs: A cyclical model of technological change”,
Administrative Science, Quarterly 35, pp.604-633, 1990.
[18] R. M. Henderson and K.B. Clark, “Architectural innovation: The reconfiguration of existing product technologies and the failure of established firms”, Administrative Science, Quarterly 35, pp.9-30, 1990,. [19] L.A. Girifalco, Dynamics of Technological Change, (Van Nostrand
Reinhold, New York), 1991.
[20] R. N., Foster, Innovation, The Attacker's Advantage, (Summit Books, New York), 1986.
[21] C.M. Christensen and R.S. Rosenbloom, “Explaining the attacker's advantage: Technological paradigms, organizational dynamics, and the value network”, Research Policy, 24, pp. 233-257, 1995.
[22] A.C. Cooper and D. Schendel, “Strategic responses to technological threats”, Business Horizons, 19, pp. 61-69, 1976.
[23] A.C. Cooper and C.G. Smith, “How established firms respond to threatening technologies”, Academy of Management Executive, 6, pp.55-70, 1992,.
[24] K.R. Harrigan and M.E. Porter, “End-game strategies for declining industries”, Harvard Business Review, pp.111-120, 1983,.
[25] W.R. Soukop and A.C. Cooper, “Strategic response to technological change in the electronic component industry”, R and D Management, 13, pp.219-230, 1983.
[26] J.R. Williams, “Technological evolution and competitive response”,
Strategic Management Journal, 4, pp.55-65, 1983.