J Oral Maxillofac Surg 61:1184-1188, 2003
Factors Influencing the Resonance
Frequency of Dental Implants
Haw-Ming Huang, MS,* Ching-Lai Chiu, DDS, MS,† Ching-Ying Yeh, PhD,‡ and Sheng-Yang Lee, DDS, MS, PhD§
Purpose: Resonance frequency (RF) analysis has been used by several investigators to assess the boundary conditions of dental implants. However, a scientific investigation of the association between the structural condition of the alveolar bone and the dynamic behavior of dental implants has not yet been reported. The aim of this study was to assess the factors influencing the RF of dental implants using an in vitro modal analysis.
Materials and Methods: Resonant vibration within implants was induced by an impulse-force ham-mer. The induced vibration signal was subsequently detected using an acoustic microphone and analyzed by fast Fourier transform. The resultant data were further analyzed to test the statistical effects of the embedding-material boundary height, thickness, and density on the RF values of the sample implants. Results: Significant changes (P ⬍ .05) in RF values were revealed for implants embedded within a high-density block when decreasing boundary height reached 6, 5, and 4 mm, at respective thickness increments of 10, 15, and 20 mm. For analogous low-density samples, significant changes (P⬍ .05) in RF values were found when respective decreasing boundary height reached 6, 4, and 3 mm.
Conclusions: Our findings indicate that boundary height, width, and density factors can influence the RF of dental implants and that a lower boundary density and greater boundary thickness can lead to more obvious RF changes.
© 2003 American Association of Oral and Maxillofacial Surgeons J Oral Maxillofac Surg 61:1184-1188, 2003
It is generally accepted that the initial stability of a dental implant together with the integrity of the os-seointegration process postimplantation are 2 of the most important factors for implant survival. Due to the lack of an efficacious device for accurate measure-ment of healing at the bone-implant interface,
how-ever, assessment of these 2 factors has remained a challenge for dentists. A number of techniques have been used to monitor the osseointegration process, including histologic analysis1-5 and electron
micro-scopic evaluation6of samples from the bone-implant
interface and removal torque testing.2,3,7-9Due to the
problems inherent to this type of invasive testing, however, these methods are not suitable for long-term clinical evaluation of related problems, which are mostly associated with this critical interface. Al-ternatively, radiographic study has been one of the most common methods for monitoring implant sta-tus10; however, analysis of 2-dimensional images
can-not provide accurate information of 3-dimensional structures. Recently, the Periotest (Simens AG, Ben-sheim, Germany), a noninvasive device, has been used for implant-stability assessment.11,12 According
to a report by Caulier et al,13however, the correlation
of Periotest results with the status of peri-implant bone tissue was not significant.
During the past 5 years, a number of workers have performed frequency analyses of induced vibration in implants to assess the status of the bone-implant in-terface.14-20The results have shown that not only do
Received from Taipei Medical University, Taipei, Taiwan. *Assistant Professor, School of Medical Technology and Gradu-ate Institute of Medical Sciences.
†Research Assistant, Graduate Institute of Oral Rehabilitation Sciences.
‡Associate Professor, Graduate Institute of Medical Sciences. §Professor and Chairman, Graduate Institute of Oral Rehabilita-tion Sciences and Dental Department of Wan-Fang Hospital.
This study was supported by a grant (NSC 90-2314-B-038-038) from the National Science Council, Taipei, Taiwan.
Address correspondence and reprint requests to Dr Lee: 250 Wu-Hsing St, Graduate Institute of Oral Rehabilitation Sciences, Taipei Medical University, Taipei, Taiwan; e-mail: seanlee@ tmu.edu.tw
©2003 American Association of Oral and Maxillofacial Surgeons
0278-2391/03/6110-0013$30.00/0 doi:10.1016/S0278-2391(03)00680-3
implant resonance frequency (RF) values provide a meaningful clinical index for assessment of primary stability, but also RFs may constitute an important parameter for evaluating secondary stability. Addition-ally, because the technique is inherently noninvasive and nondestructive, it seems reasonable to suggest that the measurement is potentially a useful clinical tool for the prevention, diagnosis, and prediction of implant failure and for the facilitation of post-treat-ment maintenance of viable prostheses.15Recently, a
new apparatus for resonance frequency analysis (RFA) of implants has been developed (Osstell; Inte-gration Diagnostics, Go¨teborgsva¨gen, Sweden). Scien-tific investigations of the association of structural con-ditions of the alveolar bone with the dynamic behavior of dental implants have not yet been re-ported, however.
Thus, in this study, the influence of various factors, such as the height, width, and/or density of the alve-olar bone, on the measured RF of an implant for various simulated boundary conditions was investi-gated using a modal testing technique. The results were then analyzed statistically.
Materials and Methods
Modal analysis was used to assess the frequency response of dental implants, with the RFs measured for a number of simulated boundary conditions. The fixture bodies of the test implants (Brånemark System; Nobel Biocare AB, Goteborg, Sweden) were 3.75 mm in diameter and 10 mm in length, with a 3-mm healing abutment. Before RF measurement, the test implants were embedded into gypsum blocks, which were used to simulate the mass effect of alveolar bone. To test the effects of boundary strength on the RF value of the implant, 2 types of gypsum were used, classi-fying the testing implants into 2 groups. Group I
implants were embedded into a type I stone with a density of 1.90 g/cm3. Type III stone, with a density of 1.45 g/cm3, was used as the embedding material for the group II variants. Further, to test the influence of block width on the RF values of the implants, widths of 20, 15, 10, 8, and 6 mm were tested for each of the groups. The height and length of the stone blocks were fixed at 18 and 100 mm, respectively. Addition-ally, to evaluate the relationships for RF values and decreasing boundary height (DBH), the RF value for each of the tested implants was recorded with the DBH incrementally from 1 to 7 mm in 1-mm steps, resulting in progressive lessening in coverage of the implant. The stone ingredients were combined at a water/stone ratio of 0.3 in a vacuum mixer for 45 seconds, with 5 test samples prepared for each con-dition for RF measurements.
The test samples were fixed in a clamping stand with a torque force of 20 N-cm. Vibration of the implant was induced using a transient force produced by an impulse-force hammer (GK291C80; PCB Pi-ezotronics, Buffalo, NY). The induced vibration signal was detected by a noncontacting acoustic micro-phone (FM-10B, 20-kHz sensitivity; FC Electronics, Taipei, Taiwan). The signals were then recorded and processed by computer after digital conversion by a 2-channel A/D interface card (AD102 A; Prowave En-gineering, Hsinchu, Taiwan), and the RFs of the sam-ple implants were determined using FFT software (SD200N, Signal Doctor; Prowave Engineering, Hsin-chu, Taiwan) (Fig 1). Three induction trials were conducted for each sample, and results were aver-aged to reduce artifacts caused by noise and human error. Testing for each condition was repeated 5 times, once for every sample, and the mean and stan-dard deviation were calculated for later comparison and discussion. One-way analysis of variance with Tukey’s HSD test was used to test the association of FIGURE 1. Schematic diagram of data acquisition system.
the RF values and the boundary attachment level, for various boundary thicknesses, and the 2 block densi-ties.
Results
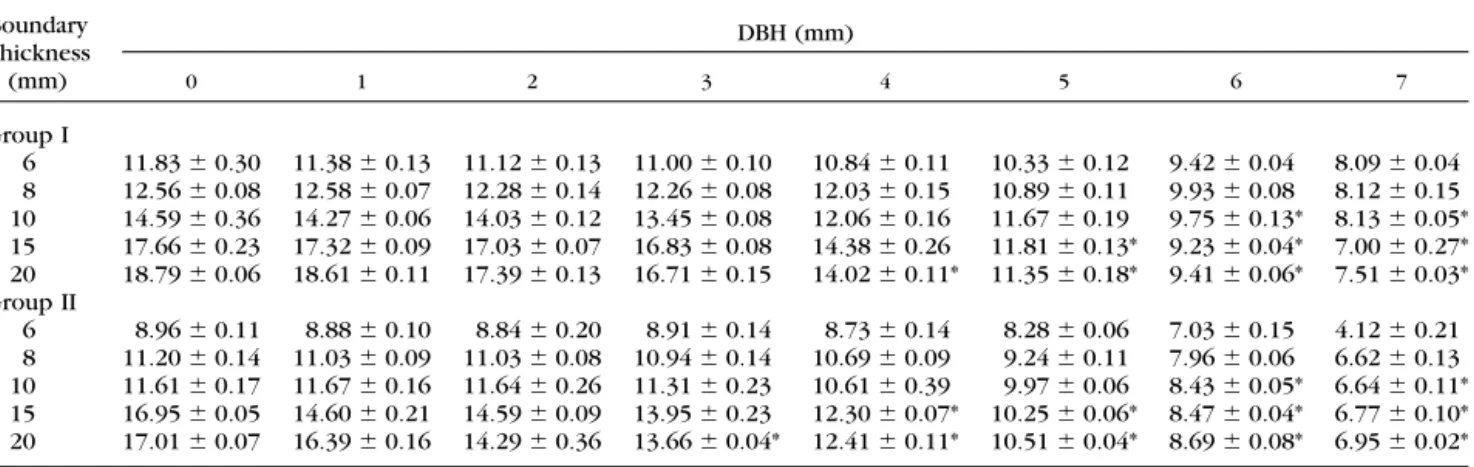
Table 1 lists the RFs of dental implants tested for the simulated bony conditions, in vitro. The mean derived frequency ranges were from 7 to 19 kHz for group I implants (Table 1, group I) and from 4 to 17 kHz for group II analogs (Table 1, group II). Fre-quency ranges for the group I implants were higher than those of the analogous group II implants. By contrast, regardless of the boundary thickness of the tested implant, RF values decreased as DBH of the implants were increased.
Relationships between RF and DBH values at vari-ous thicknesses are plotted in Figures 2 and 3 for group I and II implants, respectively. For group I implants, significant differences (P⬍ .05) in RF values were demonstrated at DBH of 6, 5, and 4 mm for
boundary thicknesses of 10, 15, and 20 mm, respec-tively (Table 1, group I). Significant differences (P⬍ .05) were also shown for analogous group II implants where respective DBH of the implants were 6, 4, and 3 mm (Table 1, group II).
Discussion
Clinical observations have indicated that after re-storative superstructures have been established, phys-iologic responses to occlusal stress and associated inflammation may lead to changes in alveolar bone height and width. According to Ericsson et al,2
alve-olar recession of 3 mm is a critical threshold for assessment of the failure of a dental implant. Shilling-burg et al21suggested an ideal crown-to-root ratio for
restoration of 1:1; otherwise, the prosthesis may fail due to an unfavorable cantilever effect. An abutment with a length of 3 mm was used for the present study, giving a total length for our test implant (fixture and abutment) of 13 mm. When the DBH values of the Table 1. RESONANCE FREQUENCIES (MEANⴞ SD, KHZ) OF TESTED IMPLANTS FOR DECREASING BOUNDARY
HEIGHTS (DBH) AND THICKNESS IN THE GROUP I AND II IMPLANTS
Boundary Thickness (mm) DBH (mm) 0 1 2 3 4 5 6 7 Group I 6 11.83⫾ 0.30 11.38 ⫾ 0.13 11.12 ⫾ 0.13 11.00 ⫾ 0.10 10.84⫾ 0.11 10.33⫾ 0.12 9.42⫾ 0.04 8.09⫾ 0.04 8 12.56⫾ 0.08 12.58 ⫾ 0.07 12.28 ⫾ 0.14 12.26 ⫾ 0.08 12.03⫾ 0.15 10.89⫾ 0.11 9.93⫾ 0.08 8.12⫾ 0.15 10 14.59⫾ 0.36 14.27 ⫾ 0.06 14.03 ⫾ 0.12 13.45 ⫾ 0.08 12.06⫾ 0.16 11.67⫾ 0.19 9.75⫾ 0.13* 8.13 ⫾ 0.05* 15 17.66⫾ 0.23 17.32 ⫾ 0.09 17.03 ⫾ 0.07 16.83 ⫾ 0.08 14.38⫾ 0.26 11.81⫾ 0.13* 9.23 ⫾ 0.04* 7.00 ⫾ 0.27* 20 18.79⫾ 0.06 18.61 ⫾ 0.11 17.39 ⫾ 0.13 16.71 ⫾ 0.15 14.02⫾ 0.11* 11.35 ⫾ 0.18* 9.41 ⫾ 0.06* 7.51 ⫾ 0.03* Group II 6 8.96⫾ 0.11 8.88⫾ 0.10 8.84⫾ 0.20 8.91⫾ 0.14 8.73⫾ 0.14 8.28⫾ 0.06 7.03⫾ 0.15 4.12⫾ 0.21 8 11.20⫾ 0.14 11.03 ⫾ 0.09 11.03 ⫾ 0.08 10.94 ⫾ 0.14 10.69⫾ 0.09 9.24⫾ 0.11 7.96⫾ 0.06 6.62⫾ 0.13 10 11.61⫾ 0.17 11.67 ⫾ 0.16 11.64 ⫾ 0.26 11.31 ⫾ 0.23 10.61⫾ 0.39 9.97⫾ 0.06 8.43⫾ 0.05* 6.64 ⫾ 0.11* 15 16.95⫾ 0.05 14.60 ⫾ 0.21 14.59 ⫾ 0.09 13.95 ⫾ 0.23 12.30⫾ 0.07* 10.25 ⫾ 0.06* 8.47 ⫾ 0.04* 6.77 ⫾ 0.10* 20 17.01⫾ 0.07 16.39 ⫾ 0.16 14.29 ⫾ 0.36 13.66 ⫾ 0.04* 12.41 ⫾ 0.11* 10.51 ⫾ 0.04* 8.69 ⫾ 0.08* 6.95 ⫾ 0.02* *P⬍ .05.
FIGURE 2. Plot of resonance frequency against decreasing boundary
implants reached 3.5 mm, the height ratio of the exposed to embedded parts of the implant was 1:1. As shown in Figures 2 and 3, where the DBH value is greater than 3 mm, the decreasing RF value is more obvious, especially where the boundary thicknesses of the implant model are less than 15 mm. If we assume that 3 mm of alveolar bone loss is important in terms of prediction of the success of an implantation, then the feasibility and practicality of evaluation of the bone-implant boundary using RF measurement can also be proposed.
Within the oral cavity, one end of an implant is exposed to air while, under normal conditions, the other end is firmly constrained within the alveolar bone. Thus we can evaluate an implant’s RF by applying the formula for a cantilevered beam as follows:16,22
fn⫽ ␣
冑
EI l4
where fn is the RF of the beam, l is the effective vibrational length of the beam, E is Young’s modulus, I is the moment of inertia, is the mass per unit effective vibrational length, and␣ is a constant related to boundary conditions. From the formula, it is clear that as the boundary density of the implant increases, the value of ␣ will also increase with an associated tendency for the RF value to increase. In our simula-tion, 2 types of gypsum matrix of different densities were used as the embedding material. Our results show that the RF values for implants embedded within the higher-density matrix were greater than those for analogous lower-density variants (Table 1). Furthermore, previous studies have also shown asso-ciations between the boundary attachment level of implants and RF values, with lower values shown for DBH in comparison to healthy implants, due to the larger l value for the less-healthy variants.15,23 Our
measurements were also consistent with these re-sults.
Furthermore, statistical analysis of our data revealed that boundary thickness is a factor influencing the measured RF values of dental implants in vitro. Kaneko24 reported that pulsed oscillation testing,
which applies a dynamic load to the implant itself, will induce vibration in the surrounding bone. Fur-ther, this induction effect has been confirmed by Lee et al,25with these researchers using the finite element
method to analyze the RF values and vibration mode for natural teeth and surrounding bone. In this study, an impulse force was used to trigger implant vibra-tion, and it was expected that resonance would be induced in the boundary material when the impulse force was applied. According to the formula ex-pressed above, increased block thickness should be
reflected in increased moment of inertia (I), resulting in an increased RF values for the tested sample.
Further, when the boundary attachment level was reduced by 3 mm, a significant difference was only shown for RF values of goup II implants with a 20-mm boundary thickness. A similar statistical effect was also noted when comparing RF values for implants of both tested groups with a 15-mm boundary thickness, as shown in Table 1. This suggests that greater sensi-tivity, in terms of RF value changes, may be shown for implants surrounded by lower-density stone as the boundary attachment level is lowered.
Additionally, a reduction of 3 to 4 mm in alveolar bone may lead to implant failure due to unfavorable stress concentrations.26,27Thus, when using RF
mea-surements to provide an indicator of implant stability, it is important to evaluate the sensitivity to bony recession of 3 to 4 mm. We found that sensitivity to frequency changes increases with increasing bound-ary width, regardless of density. Therefore, we sug-gest that it is reasonable to conclude that the RF value of an implant is a useful indicator for implant status assessment, especially for patients with greater alve-olar bone width.
The results of our simulation indicate that signifi-cant differences in RF values for reductions in bound-ary attachment level of 3 to 4 mm will only occur where the width of the investing material reaches 15 mm. This exceeds the typical measurement for alve-olar bone, however. As described earlier, the sensitiv-ity of RF values for implant-bone interface assessment is greater for implants surrounded by lower-density embedding material. Therefore, the sensitivity of this technique must be improved when applied in the oral cavity because the density of the cancellus bone (1.0 to 1.4 g/cm3) is lower than that of the investing stones (1.90 g/cm3for type I stone and 1.45 g/cm3for type III stone) used in this study.28,29
Although useful data were obtained from this inves-tigation, the quantitative results may have limited ap-plication because real bone tissue was not used and densities of the investing materials were not similar. Nonetheless, analysis of our findings provides useful qualitative conclusions regarding the significance of boundary-height, width, and density factors and their influence on dental implant RFs. Further evaluation of these boundary dimensions may lead to additional useful information on the effects of RF alterations. We hope that this study can serve as a useful reference for further, more advanced studies elaborating the RF characteristics of dental implants.
Acknowledgments
The authors wish to thank BioTech One, Inc, Taipei, Taiwan, for their assistance and for providing instrumentation for use in this study.
References
1. Albrektsson T, Jacobsson M: Bone-metal interface in osseointe-gration. J Prosthet Dent 57:597, 1987
2. Ericsson I, Johansson CB, Bystedt H, et al: A histomorphometric evaluation of bone-to-implant contact on machine-prepared and roughened titanium dental implants. A pilot study in the dog. Clin Oral Implants Res 5:202, 1994
3. Johansson CB, Albreksson T: Integration of screw implants in the rabbits: A one-year follow-up of removal torque of titanium implants. Int J Oral Maxillofac Implants 2:69, 1987
4. Sennerby L, Thomsen P, Ericson LE: A morphometric and biomechanic comparison of titanium implants inserted in rab-bit cortical and cancellous bone. Int J Oral Maxillofac Implants 7:62, 1992
5. Sennerby L, Thomsen P, Ericson LE: Early tissue response to titanium implants inserted in rabbit cortical bone. Part I: Light microscopic observations. J Mater Sci Mater Med 4:240, 1993 6. Meredith N: Assessment of implant stability as a prognostic
determinant. Int J Prosthodont 11:491, 1998
7. Carlsson L, Rostlund T, Albrektsson B, et al: Removal torques for polished and rough titanium implants. Int J Oral Maxillofac Implants 3:21, 1988
8. Johansson CB, Sennerby L, Albrektsson T: A removal torque and histomorphometric study of bone tissue reactions to com-mercially pure titanium and vitallium implants. Int J Oral Max-illofac Implants 6:437, 1991
9. Wennerberg A, Albrektsson T, Andersson B, et al: A histomor-phometric and removal torque study of screw-shaped titanium implants with three different surface topographies. Clin Oral Implants Res 6:24, 1996
10. Brånemark PI, Zarb GA, Albrektsson T: Clinical Density, Chi-cago, IL, Quintessence, 1985, pp 199-209
11. Olive J, Aparicio C: Periotest method as a measure of osseointe-grated oral implant stability. Int J Oral Maxillofac Implants 5:390, 1990
12. Teerlinck J, Quirynen M, Darius P, et al: Periotest: An objective clinical diagnosis of bone apposition toward implants. Int J Oral Maxillofac Implants 6:55, 1991
13. Caulier H, Naert I, Kalk W, et al: The relationship of some histologic parameters, radiographic evaluations, and Periotest measurements of oral implants: An experimental animal study. Int J Oral Maxillofac Implants 3:380, 1997
14. Elias JJ, Brunski JB, Scarton HA: A dynamic modal testing technique for noninvasive assessment of bone-dental implant interfaces. Int J Oral Maxilofac Implants 11:728, 1996 15. Huang HM, Pan LC, Lee SY, et al: Assessing the implant/bone
interface by using natural frequency analysis. Oral Surg Oral Med Oral Pathol Oral Radiol Endod 90:285, 2000
16. Meredith N, Alleyne D, Cawley P: Quantitative determination of the stability of the implant-tissue interface using resonance frequency analysis. Clin Oral Implants Res 7:261, 1996 17. Meredith N, Shagaldi F, Alleyne D, et al: The application of
resonance frequency measurements to study the stability of titanium implants during healing in the rabbit tibia. Clin Oral Implants Res 8:234, 1997
18. Meredith N, Book K, Friberg B, et al: Resonance frequency measurements of implant stability in vivo. A cross-sectional and longitudinal study of resonance frequency measurements on implants in the edentulous and partially dentate maxilla. Clin Oral Implants Res 8:226, 1997
19. Meredith N, Friberg B, Sennerby L, et al: Relationship between contact time measurements and PTV values when using the Periotest to measure implant stability. Int J Prosthodont 11: 269, 1998
20. Meredith N, Sennerby L: Resonance frequency analysis: Mea-suring implant stability and osseointegration. Compendium 10:493, 1998
21. Shillingburg HT, Hobo S, Whitsett LD, et al: Fundamentals of Fixed Prosthodontics. Chicago, IL, Quintessence, 1997, pp 89-93
22. Lowet G, van Audekercke R, van der Perre G, et al: The relation between resonant frequencies and torsional stiffness of long bones in vitro validation of a simple beam model. J Biomech 26:689, 1993
23. Huang HM, Lee SY, Yeh CY, et al: Resonance frequency assess-ment of dental implant stability with various bone qualities: A numerical approach. Clin Oral Implants Res 13:65, 2002 24. Kaneko T: Pulsed oscillation technique for assessing the
me-chanical state of the dental implant-bone interface. Biomateri-als 12:555, 1991
25. Lee SY, Huang HM, Lin CY, et al: In vivo and in vitro natural frequency analysis of periodontal conditions: An innovative method. J Periodontol 71:632, 2000
26. Huang HM, Wu LD, Lee SY, et al: Stress analysis of different wall thickness of implant fixture with various boundary levels. J Med Eng Technol 24:267, 2000
27. Ericsson I, Lekholm U, Brånemark PI, et al: A clinical evaluation of fixed bridge restorations supported by combination of teeth and osseointegrated titanium implants. J Clin Periodontol 4:307, 1986
28. Hiroko HM, Kimie O, Ryoji M, et al: Numeric approach to the biomechanical analysis of thermal effects in coated implants. Int J Prosthodont 6:564, 1993
29. Bronzino JD: The Biomedical Engineering Handbook. Boca Raton, FL, CRC, 1995, pp 704-723