科技部補助專題研究計畫成果報告
期末報告
在 COSO-ERM 架構下企業風險文化、公司治理與公司冒險策
略之關係
計 畫 類 別 : 個別型計畫 計 畫 編 號 : MOST 103-2410-H-004-081- 執 行 期 間 : 103 年 08 月 01 日至 104 年 07 月 31 日 執 行 單 位 : 國立政治大學風險管理與保險學系 計 畫 主 持 人 : 陳彩稚 計畫參與人員: 碩士班研究生-兼任助理人員:游儷容 碩士班研究生-兼任助理人員:劉佳卿 碩士班研究生-兼任助理人員:王雅玲 處 理 方 式 : 1.公開資訊:本計畫涉及專利或其他智慧財產權,1 年後可公開查詢 2.「本研究」是否已有嚴重損及公共利益之發現:否 3.「本報告」是否建議提供政府單位施政參考:否中 華 民 國 104 年 08 月 31 日
中 文 摘 要 : 依據 COSO-ERM 架構,企業之策略目標乃與其企業風險管理 (ERM)之程序要素密切關聯, 包括風險文化與董事會。本文 應用三階段最小平方法模型(3SLS)分析企業冒險策略、風險 文化與公司治理之關係。研究結果顯示:(1)企業較重視風險 管理(較保守之風險文化),可能使其選擇較低風險之策略, 並且降低董事會之獨立性;(2)董事會獨立性對於風險管理 重視度及冒險策略有負面影響力;(3)企業在採用冒險策略 時,可能降低其風險管理重視度與董事會獨立性。 本文依據 3SLS 所獲得之結果與傳統 OLS 模型研究有所差 異,而 3SLS 之研究結果與理論預期較為一致。由此可知, 風險文化、公司治理與冒險策略的確彼此互有影響,必須將 其視為一整體系統,而非獨立變數。因此,本研究印證 COSO-ERM 架構之主張。 中文關鍵詞: 企業風險管理、公司治理、風險文化、COSO-ERM 英 文 摘 要 : According to COSO-ERM framework, the strategic
objective is connected to the components of its ERM process, including the risk culture and the board of directors. This paper applies 3SLS simultaneous equations models to analyze the relationship between risk-taking strategies, risk culture and corporate governance because these three elements must be studied as a system with consideration of their endogeneity.
The result shows that risk management (RM) attention has a significant and negative impact on board independence and firms risk-taking strategies. Next, board independence has a significant and
negative impact on RM attention and risk-taking
strategies. Additionally, risk-taking strategies have a significant and negative relation with RM attention and board independence. Conservative risk culture and board independence both restrict risk-taking;
however, they are not equivalent to each other. The empirical result based on 3SLS SEM is different from that based on OLS, and is more consistent with theoretical prediction. The finding implies that risk culture, corporate governance, and risk-taking
strategies are endogenous to one another and must be analyzed as a system as suggested by COSO-ERM
framework.
英文關鍵詞: enterprise risk management, corporate governance, risk culture, COSO-ERM.
在 COSO-ERM 架構下企業風險文化、公司治理與公司冒險策略之關係 摘要 依據COSO-ERM 架構,企業之策略目標乃與其企業風險管理(ERM)之程序要 素密切關聯, 包括風險文化與董事會。本文應用三階段最小平方法模型(3SLS)分 析企業冒險策略、風險文化與公司治理之關係。研究結果顯示:(1)企業較重視風 險管理(較保守之風險文化),可能使其選擇較低風險之策略,並且降低董事會之獨 立性;(2)董事會獨立性對於風險管理重視度及冒險策略有負面影響力;(3)企業 在採用冒險策略時,可能降低其風險管理重視度與董事會獨立性。 本文依據3SLS 所獲得之結果與傳統 OLS模型研究有所差異,而3SLS 之研 究結果與理論預期較為一致。由此可知,風險文化、公司治理與冒險策略的確彼 此互有影響,必須將其視為一整體系統,而非獨立變數。因此,本研究印證 COSO-ERM架構之主張。 關鍵字: 企業風險管理、公司治理、風險文化、COSO-ERM。
Risk Culture, Corporate Governance and Firm Risk-Taking under COSO-ERM Framework
Abstract
According to COSO-ERM framework, the strategic objective is connected to the components of its ERM process, including the risk culture and the board of directors. This paper applies 3SLS simultaneous equations models to analyze the relationship between risk-taking strategies, risk culture and corporate governance because these three elements must be studied as a system with consideration of their endogeneity. The result shows that risk management (RM) attention has a significant and negative impact on board independence and firms risk-taking strategies. Next, board independence has a significant and negative impact on RM attention and risk-taking strategies. Additionally, risk-taking strategies have a significant and negative relation with RM attention and board independence. Conservative risk culture and board independence both restrict risk-taking; however, they are not equivalent to each other.
The empirical result based on 3SLS SEM is different from that based on OLS, and is more consistent with theoretical prediction. The finding implies that risk culture, corporate governance, and risk-taking strategies are endogenous to one another and must be analyzed as a system as suggested by COSO-ERM framework.
Keywords: enterprise risk management, corporate governance, risk culture,
Risk Culture, Corporate Governance and Firm Risk-Taking under COSO-ERM Framework
1. Introduction
The Sarbanes-Oxley Act (SOX) Section 404 regulations have significantly influenced the adoption of enterprise risk management (ERM). According to the SOX regulations, corporate governance and ERM are connected to each other and critical to firm performance and risk-taking strategies. ERM emphasizes the integration of risks and a holistic risk-based management approach. As today’s business environments become more complicated and fast-changing, the micro- and macro-economic risks are frequently mingled together. The traditional silo approach cannot properly solve the issues related to risks. Firms need the ERM holistic approach to handle the mingled risks in the new business environment.
Risk-taking is a must for a firm to compete in the market and thus risk management becomes an unavoidable process in business operations. The correct perception and serious concern on risks are critical for a firm to survive and success in the market competition. ERM is a new concept which integrates several aspects of business risks, including strategic risk, operational risk, financial risk and hazard risk (Slywotzky and Drzik, 2005). The unexpected failures of several large public companies (e.g., Enron) in recent years have urged the investors to pay more attentions to a firm’s corporate governance and risk management. Managing the integrated business risks has increasingly become an important issue since business risks are more diversified nowadays (Nocco and Stulz, 2006). The ERM’s view of risk is different from traditional risk management which considers risk as a hazard and negative to a firm’s profitability. In ERM, risks are embedded in all aspects of business strategies
and operations. That is, risk can be an opportunity that makes a firm profitable and successful, in addition to a hazard impairing the business operations. Today most of the rating agencies such as Standard & Poor’s and Moody’s regard ERM as an important factor for credit rating.
The U.S. accounting organization Committee of Sponsoring Organizations of the Treadway Commission (COSO) has already provided a framework of ERM and replaced it for internal control and auditing. This COSO-ERM framework is composed of three dimensions: business objectives, entity units, and ERM process components (COSO, 2004). The specialty of COSO-ERM is the inclusion of strategic objective, which distinguish ERM framework from previous internal control framework. ERM lifts up the role of risk management to a higher level in a business. It includes strategic risk and the board, compared with the traditional role which just focuses on operational risk and the departments. Most companies are eager to establish their ERM strategies. However, the experiences of ERM are still new and the academic research related to its impact is limited (Paladino, Cuy, and Frigo, 2009). As more unexpected corporate failures occurred not simply resulting from financial risk, the business decision makers now pay greater attentions to ERM. Many firms set up an ERM committee under the board of directors to monitor the aggregate business risks because the firm’s risk-taking strategies are critical to the protections for investors.
According to the definition of ERM in COSO (2004, p16), “Enterprise risk management is a process, effected by an entity’s board of directors, ……, manage risk to be within its risk appetite, to provide reasonable assurance regarding the achievement of entity objectives.” COSO frames ERM as a cube with three dimensions: entity objectives, business unit, and ERM process. In COSO’s 8-step ERM process, the foundation for a firm to implement risk management policy is its internal environment which includes risk culture, risk appetite, the board, etc. That is, the qualitative risks of
business strategies are also critical to a firm’s survival and success in addition to quantitative (financial) risks. Frigo and Anderson (2011) suggest that strategic risk management process and capabilities are important foundation for improving risk management and governance.
The risk management policy of a firm can contribute to the relationship between corporate success and their business strategies for several reasons. First, risk-taking of a firm results from the strategic decisions made by the directors and top management. Second, the outcomes of risk-taking decision turn out to influence firm value and consequently the investors’ support. Third, the firm’s risk-taking strategies affect financial and economic fragility, which intensifies interest in understanding the impact of risk management strategies on corporate social responsibility (Godfrey, Merrill, and Hansen, 2009).
Numerous studies have investigated the relationship between board structure and firm risk-taking (Akhigbe and Martin, 2008; Pathan, 2009). Additionally, many studies focus on the impact of managerial compensation on firm risk-taking (Low, 2009; Coles, Daniel, and Naveen, 2006). Although the board and top management are important to firm risk-taking, they are not the overall scope of ERM. The purpose of SOX and its requirements in corporate governance in fact are to provoke the attention to risk management which stabilizes business operation and prevents unexpected failure (section 404 of SOX; Chapman, 2006). That is, through the process of ERM which includes board structure, risk culture and risk management methods, a firm can achieve its ultimate goal of corporate governance and corporate social responsibility.
The purpose of this paper is to study the relationship between firm’s risk-taking strategies, corporate governance and its risk culture under COSO-ERM framework. COSO-ERM framework provides an integrated view for the stability of business operation and profitability, which is more realistic in reflecting business practice.
Risk-taking strategies are to achieve the strategic objective of an entity (the first dimension of ERM framework) and may cause strategic risks. In the second dimension of COSO-ERM framework composed of 8 steps for risk management process, the internal environment is the fundamental one. The full scope of internal environment is too broad to study within one paper. This paper will focus on risk culture and the board of directors because they are the primary elements of internal environment according to COSO-ERM (COSO, 2004, pp 27-29). The third dimension about business unit studied in this paper is simply the firm itself.
In this paper risk culture is presented by the attention to risk management which influences the judgment in risk-taking strategies. The board of directors is the center for firm risk-taking decisions and crucial for corporate governance. The board decides risk appetite that a firm is willing to accept in pursuit of its value, and in turn influences its operating style. It is expected that a firm will take less risky strategies if it pays more attentions to risk management.
The risk-taking strategies considered in this paper include several aspects of a business: (1) risks related to stock price volatility, (2) risky investments such as capital expenditure and R&D expenditure for future growth, (3) liquidity and volatility in business incomes, and (4) bankruptcy risk. Because a firm is a nexus of many stakeholders including shareholders, employees, customers, etc., its risk-taking strategies must take into consideration of all these stakeholders as emphasized in ERM. Therefore both the risks related to stock returns and the risks related to business operations are investigated in this paper.
This paper analyzes the association among risk management attention (risk culture), the board of directors (corporate governance), and risk-taking strategies based on 3-statege least squares (3SLS) simultaneous equation models because system estimation method is generally more efficient than estimating each equation by OLS or
2SLS (Wooldridge, 2002). The result shows that RM attention has a significant and negative relation with board structure when firms make risk-taking strategies. Next, board independence has a significant and negative impact on RM attention and the risk-taking strategies. Additionally, risk-taking strategies has a significant and negative relation with RM attention and board independence. The empirical result based on 3SLS SEM is more consistent with theoretical prediction than that based on OLS. The finding implies that risk culture, corporate governance, and risk-taking strategies are connected to each other and must be analyzed as a system as suggested by COSO-ERM framework.
The remainder of this paper is organized as follows. Section 2 reviews previous literature and develops the testing hypotheses. Section 3 presents sample data and research methodology. The empirical results are discussed in section 4, and then the conclusions are provided in the section 5.
2. Literature Review and Hypotheses Development
Nowadays the stakeholders and investors express more concerns about the risks encountered by a firm and how the firm manages those risks. According to COSO-ERM framework (COSO, 2004), ERM process can be applied to achieve the strategic objectives of an entity because strategic objectives are usually involved with risk-taking strategy. The foundation of ERM process is the firm’s internal environment which includes two important elements: (1) risk culture, and (2) the board of directors. The board is the key of corporate governance and the decision maker for risk-taking strategies. Risk culture is the implicit atmosphere inside a firm regarding the attention to risk management. Although risk culture cannot be measured directly, it is an underlying factor for risk-taking strategy. On the other hand, the board of directors
directly influences risk-taking decision. The three constructs connect with one another and thus an integrated approach of risk management is required in order to maintain efficient business operations.
Previous studies have investigated the relationship between corporate governance and firm risk-taking. Pathan (2009) finds that strong board positively affects bank risk-taking but CEO power has a negative impact. Wang (2012) shows that smaller board can encourage more risky investment. On the other hand, Akhigbe and Martin (2008) find negative relation between board structure and bank risks. Cheng (2008) suggests that board size has an impact on the variability of corporate performance. Andres and Vallelado (2008) also indicate that board structure is relevant to bank performance.
According to the previous literature, the empirical evidences about the effect of corporate governance on firm risk-taking are inconclusive. Some suggest better board (e.g., more independent directors) will encourage risk-taking because the outsiders are not as risk-averse as the managers who concern their compensation. On the other hand, some studies find that better board takes less risky strategies because new regulations impose more liability on the independent directors. This inconsistence probably arises from the data which focus on quantitative information of board composition. The qualitative aspects of board decision and risk culture on firm risk-taking have not been analyzed. It is reasonable to expect that a firm’s risk management attention has an impact on its board decision and at the same time is affected by the board members. As indicated in COSO (2004), the risk management philosophy of a firm may influence its corporate governance and risk-taking strategy. Although aggressive risk-taking may create profits for shareholders, an impetuous risk-taking can destroy a firm. To achieve its business objectives, a firm will select the board of directors to accommodate to its risk culture and take its favored business strategies. For example,
firms with high risk and high growth opportunities have significantly fewer outside directors, as indicated by Lehn, Patro and Zhao (2008).
Basel II (Basel Committee, 2005) has identified the board of directors is an integral part of risk management. Numerous studies suggest that the board structure and top management significantly influence the firm risk-taking. (Wright, Ferris, Sarin, and Awasthi, 1996; Adams, Almeida, and Ferreira, 2005; Andres and Vallelado, 2008). However, risk-taking in fact is not only affected by the quantitative numbers, such as board size and boar independence, but also the qualitative culture about risk. .
When a firm inclines to conservative risk management philosophy is emphasized, the board may take less risky strategies. Although the direct studies on risk culture effect are not available, Bargeron, Lehn, and Zutter (2010) show that the adoption of SOX is associated with a subsequent decline in corporate risk-taking. Because SOX legislation emphasizes risk management (section 404),1 it can create an adverse effect on firm risk-taking. It is expected that risk management philosophy will influence the board structure and consequently the risk-taking strategies. Traditional literature (e.g., Pathan, 2009) usually suggests that better board (more independent directors) will take more risk in order to increase investment returns for the shareholders because outsiders are not so risk averse as the managers. Therefore a firm will invite less independent directors when it is more conservative in risk culture and taking risks. The testing hypotheses are stated as follows.
H1a: Risk management attention has a negative impact on the board independence (corporate governance).
H1b: Risk management attention will result in less risk-taking for a firm.
1 Section 404 of SOX requires public companies to evaluate and disclose the adequacy of their internal controls in
annual reports. The companies are required to disclose the information about internal control and enterprise risk management in their annual reports, including (1) a statement of management's responsibility for establishing and maintaining adequate risk management, (2) identification of the framework to evaluate the adequacy of enterprise risk management, and (3) disclosure of any “material weaknesses" in the system of internal controls.
On the other hand, the board of directors can influence the risk culture because the directors make decisions for the firm. Ge and McVay (2005) show that the regulations have increased disclosure requirements related to risk and effectiveness of internal control. The newly updated corporate governance regulations, such as SOX (US) and Turnbull Report (UK), all require more disclosures on risk information and risk management policies since these disclosures are relevant for investors and other stakeholders. The board must pay more attention to risk management and will disclose more information of risk management policy on their annual report.
Shadab (2008) shows a negative relation between SOX and corporate risk-taking because SOX enhances the role of independent directors in corporate governance which influence risk-taking. The increased liability for independent directors is likely to adversely affect corporate risk-taking. Previous research showed evidences that new regulations of corporate governance which emphasize on internal control and enterprise risk management discourage corporate risk-taking. Graham, Harvey, and Rajgopal (2003), Wintoki (2007) and Litvak (2007) find evidences consistent with the view that SOX has adversely affected corporate risk-taking. Since traditional literature suggests that independent directors prefer more risk-taking but the new governance regulations may discourage them, the testing hypotheses about the effect of corporate governance in ERM are:2
H2a: The board independence has a negative relation with risk management attention.
H2b: The board independence has a negative relation with risk-taking strategies.
2 In literature corporate governance is usually represented by board composition including independence,
duality, and size. However, board independence is the most emphasized variable in regulations and its empirical evidences are more consistent than the other two. Therefore this paper will focus on board independence for corporate governance.
Since new regulations require companies to evaluate and disclose the adequacy of their internal control and enterprise risk management. The costs of disclosing will be higher for those firms with more risk-taking strategies. As indicated by Ashbaugh-Skaife, Collin, and Kinney (2007) and Doyle Ge, and McVay (2007) the costs of disclosing will be higher for the high-growth firms. The expected costs of complying with section 404 of SOX are directly related to risk level and consequently reduce the incentives of firms to invest in risky projects. Cohen et al. (2007) show a negative relation between SOX and corporate risk-taking. On the other hand, the risk appetite of a firm may have an impact on its composition of the board. Linck, Netter, and Yang (2008) find that boards of publicly traded US corporations are larger and consist of more outside directors after SOX.
Previous evidences showed that new regulations of corporate governance with emphasis on ERM have discouraged corporate risk-taking. However, most of the studies are based on the comparison of data before and after SOX. It is unknown about the differences in risk-taking among firms after SOX and their impacts on risk management attention and the board structure. Does a firm with more risky strategies may invite less independent directors because they worry about potential liabilities and thus reject to serve in the board? Does growing firms prefer more aggressive risk culture and less independent directors? The answers to these questions are unknown yet. Based on the literature, we expect that a firm with more aggressive risk-taking will have less risk management attention and less independent directors. The testing hypotheses are:
H3a: Firms with more risk-taking have less risk management attention. H3b: Firms with more risk-taking have lower board independence.
In literature risk-taking strategy is investigated in different aspects. Some studies emphasize on risk-taking in business strategies, such as more capital and R&D expenditures, riskier investment, and more liquidity, etc. (Low, 2009; Coles, Daniel, and Naveen, 2006). Because the board plays a critical role in making these decisions, the corporate governance has been greatly emphasized in business practice and academic research since the passage of SOX. Bargeron et al. (2010) find that risk-taking in R&D and investment strategies is reduced for the US companies after SOX. Coles et al. (2008) find a positive relation between R&D expenditures and the proportion of inside directors on the board. The arguments for the relationship between risk-taking and capital expenditure are inconsistent. Bargeron et al. (2010) expect more risk-taking for higher capital expenditure, but Coles et al. (2006) consider more risk-taking for less capital expenditure. Less liquidity usually imply higher financial risk. Since SOX especially emphasizes on the concerns of firm failure, it is expected that firms with more risk management attention will present higher liquidity, which is confirmed by Bargeron et al. (2010).
On the other hand, some studies focus firm risk-taking on the level of riskiness a firm faced, such as bankruptcy risk, assets return risk, and stock return risk (e.g, Pathan, 2009; Low, 2009), where the risk management policies may influence these risks. This paper considers eight aspects of risk-taking strategies as follows. Risky investments (e.g., capital and R&D expenditure) can be regarded as ex ante risk since the strategies are decided before business operation. Liquidity is the risk during the operation. Bankruptcy risk, assets return volatility, and stock return fluctuation are ex post risks because they are the outcomes of business operation. The board of directors is usually expected to take more risky investment so as to earn higher profits, to maintain reasonable liquidity for smooth operation, and to reduce bankruptcy risk and volatility in asset returns or stock returns for long-term financial stability.
3. Sample and Research Methodology
3.1 Sample and Data
This paper retrieved the annual reports of all the publicly listed and OTC firms in Taiwan from the public information data bases, including the Taiwan Economic Journal (TEJ), Taiwan Stock Exchange Corp. (TSEC), and Market Observation Post System (MOPS) for years 2007-2010. The total number of firms is 5309. However, financial institutions are excluded because risk management is required by the regulations. Finally the number of firms included in the sample is 5136.
A firm’s risk culture usually cannot be measured directly. We can only make indirect observation through its attention to risk management. Therefore this paper applies the methodology of content analysis as Linsley and Shrives (2006) to find the message of risk culture. The key word “risk management” is searched in the annual reports of firms. The rationale is that a firm will frequently use this term in describing its business policies and strategies if its risk culture regards risk management important. Because the formats of some annual reports cannot fit for the search technique, there are finally 3891 observations available for the empirical analysis. The risk management attention is identified through the following procedure. If the term “risk management” appears at least once, the dummy variable (RMyes) is equal to 1, otherwise RMyes=0.
In addition to the variable of RM attention, the variables for corporate governance, risk-taking strategies, and firm characteristics are also retrieved from the public data. Corporate governance of a firm is represented by its board structure because the board is the center for decision-making. According to Linck et al. (2008), the board structure includes on three elements: board independence, leadership duality, and board size; however, board independence is the most emphasized one. Board independence (IND)
is defined as the proportion of the outside directors in the board. Leadership duality (DU) means the CEO also the chairman of the board (COB), which is a dummy variable equal to 1 if CEO=COB and zero otherwise. Board size (BSize) is the total number of directors on the board.
The firm’s risk-taking strategies (RISK) for business continuation include (1) capital expenditure ratio (CAPEXr), (2) research and development expenditure ratio (R&Dr), both of them implies risky investment, (3) holding of cash and short term securities ratio (CASHr) to maintain liquidity. These three ratios are their dollar amounts divided by total assets to mitigate the effect of firm size as suggested by Bargeron et al. (2010). According to Panthan (2009), the risk-taking strategies related to volatility of stock returns are (1) total risk of stock returns (standard deviation of daily stock returns, TR), (2) idiosyncratic risk of stock returns (standard deviation of error terms in forecasting equation for daily stock returns, IDIOR), and (3) systematic risk of stock returns (beta on market portfolio, SYSR). The risk-taking strategies related to stability of business returns include (1) volatility of return on assets (standard deviation of ROA, StdROA), and (2) bankruptcy risk. Bankruptcy risk is calculated based on
Z-score as in Boyd, Graham and Hewitt (1993), where Z = 1/{[ROA +
equity/assets)]/StdROA}.
Several firm characteristics variables are included to control the individual differences in firms. This paper includes the stock-holding percentage by all directors (DIR), and D&O insurance amount (D&O) and purchase decision dummy (DOyes) as the firm characteristic variables because they are relevant to corporate governance (Core, 1997). The variables for measuring the financial strength of a firm are debt ratio. The debt ratio (DEBTr) is equal to the book value of debts to book value of assets. Firms with potential growth opportunity usually take more risky strategies and thus market-to-book value of equities (MTB) is included as the proxy for growth opportunity
as Gaver and Gaver (1993). adjROA is firm’s ROA adjusted by its industry ROA, which traditionally is an accounting measurement for business returns. adjAVGR is firm’s average stock returns adjusted by its industry average stock returns, which is usually associated with the risk of stock returns. These two variables are applied alternatively for risk strategies related to accounting returns or stock returns, instead of in the same equation. High technology firms usually have more risky investments and higher fluctuations in stock returns or business returns. Therefore, a dummy variable
TECH is assigned one for high-technology firms and zero for the others. The
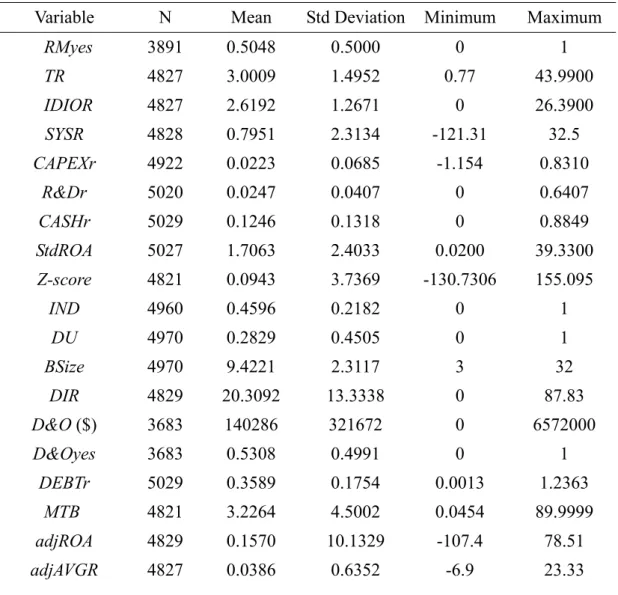
descriptive statistics of the sample are summarized in table 1. The definitions of variables are listed in appendix 1.
Table 1 Summary Statistics for the Sample
Variable N Mean Std Deviation Minimum Maximum
RMyes 3891 0.5048 0.5000 0 1 TR 4827 3.0009 1.4952 0.77 43.9900 IDIOR 4827 2.6192 1.2671 0 26.3900 SYSR 4828 0.7951 2.3134 -121.31 32.5 CAPEXr 4922 0.0223 0.0685 -1.154 0.8310 R&Dr 5020 0.0247 0.0407 0 0.6407 CASHr 5029 0.1246 0.1318 0 0.8849 StdROA 5027 1.7063 2.4033 0.0200 39.3300 Z-score 4821 0.0943 3.7369 -130.7306 155.095 IND 4960 0.4596 0.2182 0 1 DU 4970 0.2829 0.4505 0 1 BSize 4970 9.4221 2.3117 3 32 DIR 4829 20.3092 13.3338 0 87.83 D&O ($) 3683 140286 321672 0 6572000 D&Oyes 3683 0.5308 0.4991 0 1 DEBTr 5029 0.3589 0.1754 0.0013 1.2363 MTB 4821 3.2264 4.5002 0.0454 89.9999 adjROA 4829 0.1570 10.1329 -107.4 78.51 adjAVGR 4827 0.0386 0.6352 -6.9 23.33
TECH 4829 0.6320 0.4823 0 1 MV of equity ($) 4828 15144746 74845336 31000 1839615000 Total assets ($) 5029 13245803 49345548 32450 1181868334 All variables of dollar amount are in NT$1000.
3.2 Research Methodology
The relationship between risk culture, corporate governance, and risk-taking strategies in fact is difficult to disentangle. The three elements are not formed and followed one after another in a single file, but influence one another. According to the COSO-ERM framework (COSO, 2004), it is expected that risk management attention has an impact on board structure and risk-taking strategies, and vice versa. To test hypotheses, this paper searches the text of annual report and uses the dummy variable “risk management” to represent the risk management attention (risk culture). It is expected that the term “risk management” will be used if the firm pays attention to risk management. Then eight risk-taking strategies are analyzed under internal risk environment, including risk culture and the board structure.
This paper first compares the board structure, firm characteristics, risk-taking strategies and earnings between the firms with and without RM attention. A firm is regarded as paying attention to RM if the dummy variable RMyes =1, otherwise is grouped as firms without attention on RM. This method is similar to the matched-sample method used by Chhaochharia and Grinstein (2007). T-test and nonparametric Wilcoxon test are applied to compare the means and medians of board structure and risk-taking strategies between these two groups of firms. These analyses provide initial knowledge on the relationship between RM culture and business operations.
risk-taking strategies (RISK), corporate governance (CG), and risk management attention (RM). These three equations are analyzed by 3-stage least squares (3SLS) simultaneous equations models to see the entangling connection among the three constructs due to their endogeneity. According to (Wooldridge, 2002), 3-statege least squares (3SLS) simultaneous equation models (SEM) is generally more efficient than estimating each equation by OLS or 2SLS. The testing models are listed as follows. RMit =α +β1RISKit + β2 CGit + Σβj FirmCharacteristicsit +εit (1)
CGit =α +λ1RISKit +λ2RMit + Σλj FirmCharacteristicsit +νit (2)
RISKit = α +φ1CGit +φ2 RMit + Σφj FirmCharacteristicsit +ωit (3)
In the above three equations, RM is presented by the dummy variable RMyes for the risk culture. Corporate governance (CG) in equations (1) included board independence, duality and board size. CG in equation (2) is dependent variable and thus simply represented by board independence because in the literature board independence is emphasized and its empirical findings are more consistent for than those for duality and board size (Linck et al., 2008). CG in equation (3) is also represented by board independence only since it is the most important CG measurement and many same variables as equation (1) may cause rank problem. In all three equations, RISK means the risk strategy and the eight risk strategies will be studied one by one.
The control variables for firm characteristics are somewhat different in the three equations to avoid the rank problem in simultaneous equations models where the same instruments cannot be used for every equation (Wooldridge, 2002). The variables of firm characteristics are chosen based on previous literature and selected through OLS and stepwise regression for each equation. Those candidates with higher explanation power and consistent prediction sign are taken as final variables for the 3SLS simultaneous equations models. The final models for empirical testing are listed as
follows.3
RMyesit =α +β1RISKit + β2 INDit +β3 DUit +β4 BSizeit + β5 DOit +β6 DIRit +εit (1’)
INDit=γ+λ1RISKit +λ2RMyesit +λ3DOyesit +λ4 adjROAit +λ5TECit +νit (2’)
RISKit =π+φ1RMyesit +φ2 INDit +φ3DOit +φ4DEBTrit+φ5MTBit
+φ6 adjROAit +φ7TECit +ωit (3’)
4. Results
The comparisons in risk-taking strategies, corporate governance, and firm characteristics between the firms with and without RM attention are shown in Table 2. The finding shows that total risk and idiosyncratic risk of stock returns of firms with RM attention are significantly lower, but systematic risk is marginally significantly higher. The business strategies for R&D spending and cash holding are significantly lower in firms with RM attention but no significant difference in capital expenditure ratio. The income volatility (StdROA) is also significantly lower in firms with RM attention, but the difference in bankruptcy risk (Z-score) is not significant.
Regarding the corporate governance, the firms with RM attention show significantly lower board independence and duality, but no difference in board size. The difference in share holding % by all directors is not significant between two groups of firms. The D&O insurance amount purchased by the firms with RM attention is significantly higher than that of firms without RM attention. However, the purchase decision of D&O insurance is somewhat higher in the firms without RM attention.
In the financial aspects, neither debt ratio nor MTB is significantly different between the two groups of firms. The performance indicator adjROA shows that firms with RM attention significantly present better ROA. The adjusted average stock returns
3 The explanatory variable adjROA in equations (2’) and (3’) is replaced with adjAVGR when the
dependent variable RISK is related to stock returns, such as TR, IDIOR, and SYSR. If RISK is related accounting measurements, such as CAPEXr, R&Dr, CASHr, StdROA, and Z-score, then adjROA is used.
(adjAVGR) are significantly lower in the firms with RM attention, which is consistent with their lower volatility in stock returns (TR). Industry type does not show significant difference between two groups of firms. Firm size (total assets) and market value of equities both are significantly higher in the firms with RM attention.
In summary, the initial results based on t-test suggest that the firms with RM attention exhibit different risk-taking behavior from the other group of firms. Their R&D investment is more conservative, but their volatility of stock returns and business incomes both are also lower. The results based on nonparametric Wilcoxon test are almost the same and thus the discussion is omitted. Most of the explanatory variables are not highly correlated (ρ<0.5) and thus no multicollinearity problem in the regression analysis.
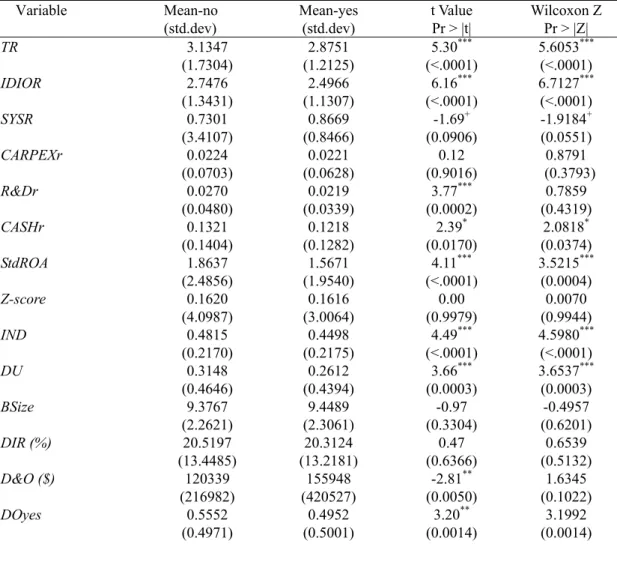
Table 2 Comparisons between the Firms with and without RM Strategies
Variable Mean-no (std.dev) Mean-yes (std.dev) t Value Pr > |t| Wilcoxon Z Pr > |Z| TR 3.1347 (1.7304) 2.8751 (1.2125) 5.30*** (<.0001) 5.6053*** (<.0001) IDIOR 2.7476 (1.3431) 2.4966 (1.1307) 6.16*** (<.0001) 6.7127*** (<.0001) SYSR 0.7301 (3.4107) 0.8669 (0.8466) -1.69+ (0.0906) -1.9184+ (0.0551) CARPEXr 0.0224 (0.0703) 0.0221 (0.0628) 0.12 (0.9016) 0.8791 (0.3793) R&Dr 0.0270 (0.0480) 0.0219 (0.0339) 3.77*** (0.0002) 0.7859 (0.4319) CASHr 0.1321 (0.1404) 0.1218 (0.1282) 2.39* (0.0170) 2.0818* (0.0374) StdROA 1.8637 (2.4856) 1.5671 (1.9540) 4.11*** (<.0001) 3.5215*** (0.0004) Z-score 0.1620 (4.0987) 0.1616 (3.0064) 0.00 (0.9979) 0.0070 (0.9944) IND 0.4815 (0.2170) 0.4498 (0.2175) 4.49*** (<.0001) 4.5980*** (<.0001) DU 0.3148 (0.4646) 0.2612 (0.4394) 3.66*** (0.0003) 3.6537*** (0.0003) BSize 9.3767 (2.2621) 9.4489 (2.3061) -0.97 (0.3304) -0.4957 (0.6201) DIR (%) 20.5197 (13.4485) 20.3124 (13.2181) 0.47 (0.6366) 0.6539 (0.5132) D&O ($) 120339 (216982) 155948 (420527) -2.81** (0.0050) 1.6345 (0.1022) DOyes 0.5552 (0.4971) 0.4952 (0.5001) 3.20** (0.0014) 3.1992 (0.0014)
DEBTr 0.3565 (0.1800) 0.3611 (0.1673) -0.82 (0.4112) -1.4489 (0.1474) MTB 3.2142 (4.0810) 3.3025 (4.7328) -0.61 (0.5448) -0.9465 (0.3439) adjROA -0.1768 (11.2950) 0.6780 (8.9488) -2.56* (0.0106) -1.2940 (0.1957) adjAVGR 0.0672 (0.8034) 0.0111 (0.4375) 2.65** (0.0081) 1.0182 (0.3086) TECH 0.6404 (0.4800) 0.6278 (0.4835) 0.79 (0.4297) 0.7898 (0.4297) Assets 8139950 (29791344) 17229269 (57340013) -6.13*** (<.0001) -8.2419*** (<.0001) MV of equities 9203505 (43846877) 20390036 (96632394) -4.49*** (<.0001) -6.6239*** (<.0001) Sample size 1798 1897
Note: Mean-yes is the mean for firms with RM attention (i.e., RMyes=1) and Mean-no is the mean for those without RM attention (i.e., RMyes=0). T-test and Wilcoxon test are for differences in means and medians. Sample size for testing of each variable is different as indicated in table 1 because of missing data. The numbers of sample size shown in table are those for total risk (TR). The numbers of observations for other variables may be different from those for TR due to missing data. However, the sample sizes for the Mean-yes and Mean-no are very close under each variable, about 50% of the observations for either case. Significance levels: + p<0.10; * p<0.05; ** p<0.01; *** p<0.001.
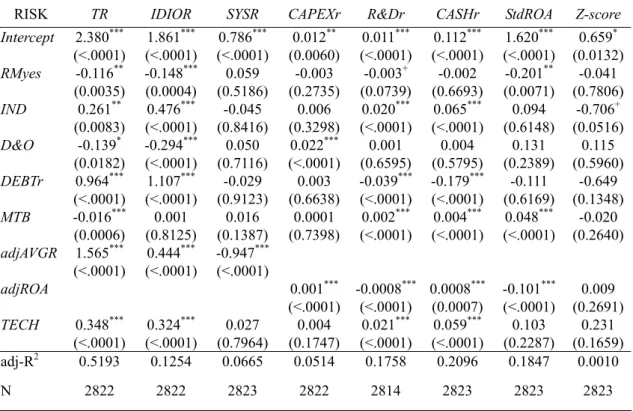
The empirical results based on OLS regression for the risk strategies are provided
in table 3 for a comparison with those based on 3SLS.4 The result of table 3 suggests
that RM attention has a negative impact on risk-taking strategies about total risk and idiosyncratic risk of stock returns, R&D expenditure, and volatility of incomes. The effect of RM attention on systematic risk, capital expenditure, cash holding and bankruptcy risk is insignificant. On the other hand, the board independence has a significant and positive impact on risk-taking strategies about total risk and idiosyncratic risk of stock returns, R&D expenditure, and cash holding, but no significant effect on systematic risk, capital expenditure and incomes volatility. These results seem inconsistent with the previous findings (Pathan, 2009; Bargeron et al. 2010) which suggest higher board independence has an adverse effect on risk-taking strategies. This inconsistence is possibly caused by the testing methodology, and it is corrected
when the analysis is conducted by 3SLS simultaneous equations models.
The results in table 3 show that D&O insurance is negatively related to total risk and idiosyncratic risk of stock returns, which implies the moral hazard of D&O insurance because it reduce the incentive of the directors to take risk. Debt ratio will increase total risk and idiosyncratic risk of stock returns and reduce R&D expenditure and cash-holding, which in general is consistent with theoretical prediction about poor financial strength. The variable of grow opportunity MTB has a positive relationship with R&D expenditure, cash-holding, and income volatility as predicted, but the negative relation with total risk of stock returns seems unreasonable. The average stock returns (adjAVGR) are positively related total risk and idiosyncratic risk, which is consistent with portfolio theory. However, adjAVGR is negatively related to systematic risk.
The business income adjROA has a positive relationship with capital expenditure and cash holding as expected. AdjROA has a negative relation with R&D expenditure probably because R&D expenditure will reduce business incomes in the short term. Besides, adjROA has a negative relation with the volatility of business incomes because firms with higher profitability usually have more stable business operations. Firms in high technology industry are more aggressive in risk-taking strategies and thus present higher total risk and idiosyncratic risk in stock returns and spend more R&D expenditure. High technology firms also have higher cash holding to support their liquidity.
In summary, the OLS regression analyses provide some initial outcomes of empirical testing. Although some of the results are consistent with theoretical predictions, some of them are not. The major problem is that the OLS analysis for bankruptcy risk (Z-score) is insignificantly associated with all the explanatory variables except for a marginal effect of board independence. It is believed that most firms are
very concerned with bankruptcy risk which is related to survivorship and is the fundamental item in the enterprise risk management. Therefore the OLS regression probably cannot tell the whole story of risk-taking strategies because OLS treats risk culture and corporate governance as exogenous explanatory variables and does not consider the endogeneity of these elements.
Table 3. OLS Regression for Risk Strategies, Depend Variable = Risk
RISK TR IDIOR SYSR CAPEXr R&Dr CASHr StdROA Z-score
Intercept 2.380*** (<.0001) 1.861*** (<.0001) 0.786*** (<.0001) 0.012** (0.0060) 0.011*** (<.0001) 0.112*** (<.0001) 1.620*** (<.0001) 0.659* (0.0132) RMyes -0.116** (0.0035) -0.148*** (0.0004) 0.059 (0.5186) -0.003 (0.2735) -0.003+ (0.0739) -0.002 (0.6693) -0.201** (0.0071) -0.041 (0.7806) IND 0.261** (0.0083) 0.476*** (<.0001) -0.045 (0.8416) 0.006 (0.3298) 0.020*** (<.0001) 0.065*** (<.0001) 0.094 (0.6148) -0.706+ (0.0516) D&O -0.139* (0.0182) -0.294*** (<.0001) 0.050 (0.7116) 0.022*** (<.0001) 0.001 (0.6595) 0.004 (0.5795) 0.131 (0.2389) 0.115 (0.5960) DEBTr 0.964*** (<.0001) 1.107*** (<.0001) -0.029 (0.9123) 0.003 (0.6638) -0.039*** (<.0001) -0.179*** (<.0001) -0.111 (0.6169) -0.649 (0.1348) MTB -0.016*** (0.0006) 0.001 (0.8125) 0.016 (0.1387) 0.0001 (0.7398) 0.002*** (<.0001) 0.004*** (<.0001) 0.048*** (<.0001) -0.020 (0.2640) adjAVGR 1.565*** (<.0001) 0.444*** (<.0001) -0.947*** (<.0001) adjROA 0.001*** (<.0001) -0.0008*** (<.0001) 0.0008*** (0.0007) -0.101*** (<.0001) 0.009 (0.2691) TECH 0.348*** (<.0001) 0.324*** (<.0001) 0.027 (0.7964) 0.004 (0.1747) 0.021*** (<.0001) 0.059*** (<.0001) 0.103 (0.2287) 0.231 (0.1659) adj-R2 0.5193 0.1254 0.0665 0.0514 0.1758 0.2096 0.1847 0.0010 N 2822 2822 2823 2822 2814 2823 2823 2823
Parameter estimates are listed with p-values in the parentheses. *** sig. at 0.1%; ** sig. at 1%; * sig. at 5%; + sig. at 10%.
Under COSO-ERM framework the strategic objectives of a firm are connected with its risk culture and corporate governance since these three elements influence one another. When the 3SLS simultaneous equations models are applied, the empirical results are very different. Table 4 shows that RM attention is negatively related to total risk of stock returns and board independence. The higher volatility of stock returns implies less RM attention and less board independence (corporate governance), which
is consistent with theory and previous literature that more RM attention and better corporate governance will reduce firm risk-taking. Additionally, the finding indicates that D&O insurance and equities holding % by all directors may encourage RM attention, which implies that the board of directors has an impact on RM philosophy. D&O insurance purchase decision may encourage board independence, and firms with higher profitability (adjROA) and in high technology industry also exhibit higher board independence. The effects of firm characteristic variables for the equations of RM attention (eq. 1’) and board independence (eq. 2’) are very close for all the eight risk-taking strategies. Therefore their discussions are omitted in the following paragraphs.
Table 4 3SLS SEM for Total Risk and Idiosyncratic Risk of Firms
RISK TR IDIOR
Variable RMyes IND TR RMyes IND IDIOR
Intercept 0.707*** (<.0001) 0.893*** (<.0001) 8.537*** (<.0001) 0.863*** (<.0001) 0.976*** (<.0001) 9.519*** (<.0001) RISK -0.033*** (<.0001) -0.018*** (0.0007) -0.088*** (<.0001) -0.048*** (<.0001) IND -0.278** (0.0062) -5.431*** (<.0001) -0.303** (0.0025) -6.936*** (<.0001) DU 0.008461 (0.4961) 0.010 (0.3965) BSize -0.00178 (0.3747) -0.00198 (0.3154) D&O 0.0490* (0.0208) 0.194* (0.0239) 0.037+ (0.0605) 0.109 (0.2519) DIR 0.002*** (<.0001) 0.002*** (<.0001) DOyes 0.036*** (0.0003) 0.030** (0.0012) RMyes -0.909*** (<.0001) -7.743*** (<.0001) -0.925*** (<.0001) -9.012*** (<.0001) adjROA 0.002*** (<.0001) 0.001*** (<.0001) TECH 0.118*** (<.0001) 0.932 (<.0001) 0.120*** (<.0001) 1.008*** (<.0001) DEBTr 0.852*** (<.0001) 0.632*** (<.0001) MTB 0.002 (0.6988) 0.017** (0.0011) adjAVGR 1.335 (<.0001) *** 0.221 *** (<.0001)
adj-R2 0.1961 0.0850
Sample size 2821 2821
Parameter estimates are listed with p-values in the parentheses. *** sig. at 0.1%; ** sig. at 1%; * sig. at 5%; + sig. at 10%.
The total risk is negatively related to board independence and positively related to D&O insurance, which are the major difference between the analyses based on 3SLS and OLS methods. This result indicates that total stock volatility may increase when corporate governance is weakened due to lower board independence and increased protection from D&O insurance. The effect of other firm characteristics variables is similar to that of OLS regression and the discussions are omitted. The empirical result for idiosyncratic risk is very close to that for total risk. The relationship between idiosyncratic risk and board independence also is changed to negative but the D&O insurance effect becomes insignificant under 3SLS. This result indicates that idiosyncratic stock volatility can be reduced by better corporate governance (higher board independence).
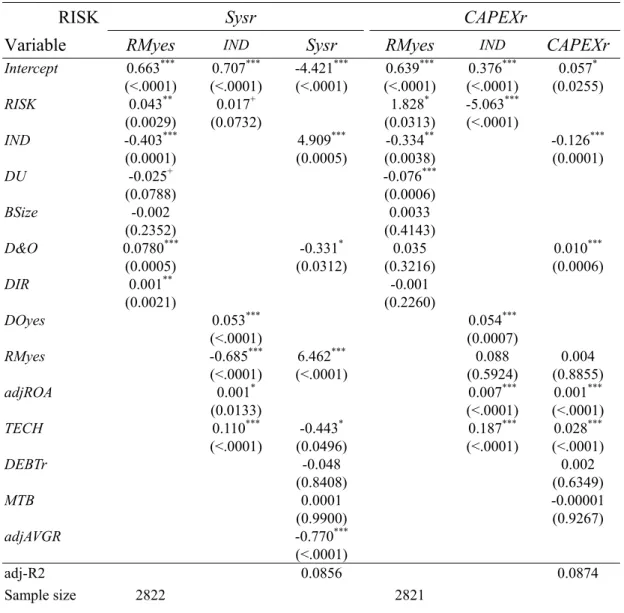
The empirical result for systematic risk of stock returns is show in table 5. The systematic risk is significantly and positively related to RM attention and board independence under 3SLS, which is very different from OLS regression where no significant association is presented. It is reasonable to see that RM attention and corporate governance will be enhanced when the volatility of stock returns is highly affected by the market risk. The relationship between RM attention and board independence remains negative when systematic risk appears.
The empirical result for capital expenditure ratio suggests that the RM attention increases with more capital expenditure, but more RM attention does not raise capital expenditure ratio. The board independence has a negative relationship with capital
expenditure ratio, which implies firms with more independent directors would restrict the capital expenditure and independent directors would not like to serve in the firms with higher capital expenditure to avoid potential litigation risk from shareholders since capital expenditure associated with long-term growth.
Table 5 3SLS SEM for Systematic Risk and Capital Expenditure of Firms
RISK Sysr CAPEXr
Variable RMyes IND Sysr RMyes IND CAPEXr
Intercept 0.663*** (<.0001) 0.707*** (<.0001) -4.421*** (<.0001) 0.639*** (<.0001) 0.376*** (<.0001) 0.057* (0.0255) RISK 0.043** (0.0029) 0.017+ (0.0732) 1.828* (0.0313) -5.063*** (<.0001) IND -0.403*** (0.0001) 4.909*** (0.0005) -0.334** (0.0038) -0.126*** (0.0001) DU -0.025+ (0.0788) -0.076*** (0.0006) BSize -0.002 (0.2352) 0.0033 (0.4143) D&O 0.0780*** (0.0005) -0.331* (0.0312) 0.035 (0.3216) 0.010*** (0.0006) DIR 0.001** (0.0021) -0.001 (0.2260) DOyes 0.053*** (<.0001) 0.054*** (0.0007) RMyes -0.685*** (<.0001) 6.462*** (<.0001) 0.088 (0.5924) 0.004 (0.8855) adjROA 0.001* (0.0133) 0.007*** (<.0001) 0.001*** (<.0001) TECH 0.110*** (<.0001) -0.443* (0.0496) 0.187*** (<.0001) 0.028*** (<.0001) DEBTr -0.048 (0.8408) 0.002 (0.6349) MTB 0.0001 (0.9900) -0.00001 (0.9267) adjAVGR -0.770*** (<.0001) adj-R2 0.0856 0.0874 Sample size 2822 2821
Parameter estimates are listed with p-values in the parentheses. *** sig. at 0.1%; ** sig. at 1%; * sig. at 5%; + sig. at 10%.
The empirical result for R&D expenditure ratio in table 6 suggests that the RM attention has no significant relationship with R&D expenditure, which is different from
OLS regression result that RM attention may reduce R&D expenditure. Board independence may encourage R&D expenditure, but R&D expenditure does not significantly influence board independence. RM attention and board independence are negatively related when R&D expenditure risk is considered.
Table 6 3SLS SEM for R&D expenditure and Liquidity Risk of Firms
RISK R&Dr Cashr
Variable RMyes Ind R&Dr RMyes Ind Cashr
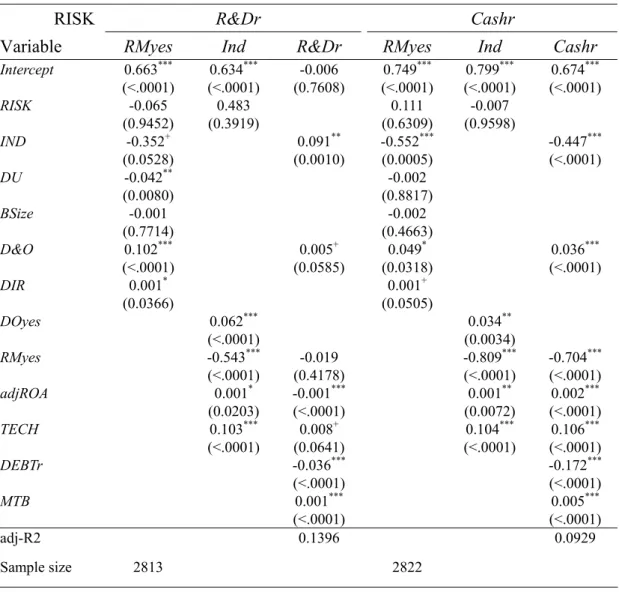
Intercept 0.663*** (<.0001) 0.634*** (<.0001) -0.006 (0.7608) 0.749*** (<.0001) 0.799*** (<.0001) 0.674*** (<.0001) RISK -0.065 (0.9452) 0.483 (0.3919) 0.111 (0.6309) -0.007 (0.9598) IND -0.352+ (0.0528) 0.091** (0.0010) -0.552*** (0.0005) -0.447*** (<.0001) DU -0.042** (0.0080) -0.002 (0.8817) BSize -0.001 (0.7714) -0.002 (0.4663) D&O 0.102*** (<.0001) 0.005+ (0.0585) 0.049* (0.0318) 0.036*** (<.0001) DIR 0.001* (0.0366) 0.001+ (0.0505) DOyes 0.062*** (<.0001) 0.034** (0.0034) RMyes -0.543*** (<.0001) -0.019 (0.4178) -0.809*** (<.0001) -0.704*** (<.0001) adjROA 0.001* (0.0203) -0.001*** (<.0001) 0.001** (0.0072) 0.002*** (<.0001) TECH 0.103*** (<.0001) 0.008+ (0.0641) 0.104*** (<.0001) 0.106*** (<.0001) DEBTr -0.036*** (<.0001) -0.172*** (<.0001) MTB 0.001*** (<.0001) 0.005*** (<.0001) adj-R2 0.1396 0.0929 Sample size 2813 2822
Parameter estimates are listed with p-values in the parentheses. *** sig. at 0.1%; ** sig. at 1%; * sig. at 5%; + sig. at 10%.
Cash holding is negatively related to RM attention. This result implies that more cash holding may reduce RM attention because of less liquidity risk, and that more RM attention will need less cash holding due to less unexpected cash outflows. On the other
hand, cash holding has no significant impact on board independence because firm characteristics variables, such as adjROA and industry type, are more important factors for cash holding. Additionally, cash holding may adjust each year according the business operation, but the board structure of a firm is usually quite stable over time. However, board independence has a negative impact on cash holding which probably implies better corporate governance reduces liquidity risk and requires less cash holding. Besides, D&O insurance may encourage more cash holding to avoid liquidity risk. Compared with the result based on OLS in table 3, where RM attention and D&O insurance have no effect but board independence has a positive impact on cash holding, the result based on 3SLS sounds is more reasonable.
The result in table 7 shows that income volatility is negatively related to RM attention. Lower income volatility usually implies more RM attention so as to maintain stable business operation. One the other hand, RM attention may urge the firms to control income volatility at a lower level. Similar to cash holding strategy, income volatility has no significant impact on board independence probably because different industry types of firms exhibit diverse income streams. However, board independence has a negative impact on income volatility because better corporate governance can maintain more stable business. Besides, D&O insurance has a positive impact on income volatility. Compared with the result based on OLS, where board independence and D&O insurance has no effect on income volatility, the result based on 3SLS are more consistent with previous studies.
The empirical result based on 3SLS for bankruptcy risk in table 7 is very different from that based on OLS where bankruptcy risk is not related any explanatory variables except for a little connection with board independence. Table 7 shows that bankruptcy risk is significantly and negatively related to RM attention. High bankruptcy risk implies low RM attention, and lower RM attention may result in higher bankruptcy risk,
which is consistent with theoretical prediction. The result also shows that bankruptcy risk is significantly and negatively related to board independence. This result is reasonable because high bankruptcy risk usually implies poor corporate governance and poor corporate governance may cause bankruptcy risk. Additionally D&O insurance is has a positive impact on bankruptcy risk because of moral hazard effect of insurance protection, which is not indicated under OLS regression.
Table 7 3SLS SEM for Income Volatility and Bankruptcy Risk of Firms
RISK StdROA Z-score
Variable RMyes IND StdROA RMyes IND Z-score
Intercept 0.724*** (<.0001) 0.714*** (<.0001) 8.468*** (<.0001) 0.670*** (<.0001) 0.764*** (<.0001) 5.939*** (<.0001) RISK -0.026** (0.0090) -0.018 (0.1610) -0.058 (0.2618) -0.076+ (0.0859) IND -0.385*** (0.0002) -7.363*** (<.0001) -0.298* (0.0151) -5.010** (0.0081) DU -0.040** (0.0071) -0.050** (0.0028) BSize -0.001 (0.6219) -0.002 (0.4158) D&O 0.090*** (<.0001) 0.577*** (<.0001) 0.075** (0.0015) 0.518* (0.0120) DIR 0.001** (0.0019) 0.001+ (0.0657) DOyes 0.059*** (<.0001) 0.060*** (<.0001) RMyes -0.618*** (<.0001) -7.997*** (<.0001) -0.757*** (<.0001) -7.323*** (<.0001) adjROA 0.0003 (0.7667) -0.079*** (<.0001) 0.001+ (0.0700) 0.017* (0.0431) TECH 0.112*** (<.0001) 0.932*** (<.0001) 0.116*** (<.0001) 0.605+ (0.0536) DEBTr 0.018 (0.9309) -0.190 (0.5885) MTB 0.049*** (<.0001) -0.014 (0.3169) adj-R2 0.1113 0.0564 Sample size 2822 2822
Parameter estimates are listed with p-values in the parentheses. *** sig. at 0.1%; ** sig. at 1%; * sig. at 5%; + sig. at 10%.
comparison with table 3 of OLS regression. The major differences between the two tables are the effects of RM, board independence and D&O insurance. Under OLS RM attention only influences stock returns TR and IDOR and income stability StdROA, but not other risk-taking strategies. The result of 3SLS shows that RM attention has significant and negative relation with most of the risk-taking strategies, which can support hypothesis 1b. The effect of RM attention on capital expenditure and R&D is not significant because firms in different industries may have diverse strategies on long term investment.
Board independence has a positive impact on risk-taking on stock returns, R&D, and cash holding, but no significant effect on income stability and bankruptcy risk under OLS. On the other hand, the effect of board independence has a significant relation with all the risk-taking strategies, negative for most but positive for SYSR and R&D under 3SLS. According to theory, better corporate governance is expected to reduce risk-taking, especially for income volatility and bankruptcy risk. The empirical finding by Bargenron et al (2010) also proved this argument. Therefore the empirical result based on 3SLS SEM is more reliable than that based OLS, and supports hypothesis 2b. The outcome implies that risk culture, corporate governance, and risk-taking strategies are connected to each other and must be analyzed as a system as suggested by COSO-ERM framework, instead of treating risk culture and corporate governance as exogenous explanatory variables.
The control variable D&O insurance has important relationship with corporate governance as indicated by Core (2000), Baker and Griffith (2007), and Wynn (2008) and thus the consequent risk-taking strategies. The effect of D&O insurance is insignificant for most of risk-taking variables under OLS analysis. On the other hand D&O insurance has a significant and positive effect on most of the risk-taking strategies under 3SLS, which implies a moral hazard of insurance protection and is
consistent with the study of Core (1997). Again, this additional finding of D&O insurance effect suggests that risk-taking strategies must be analyzed as a system with risk culture and relevant corporate governance variables because they are connected to one another.
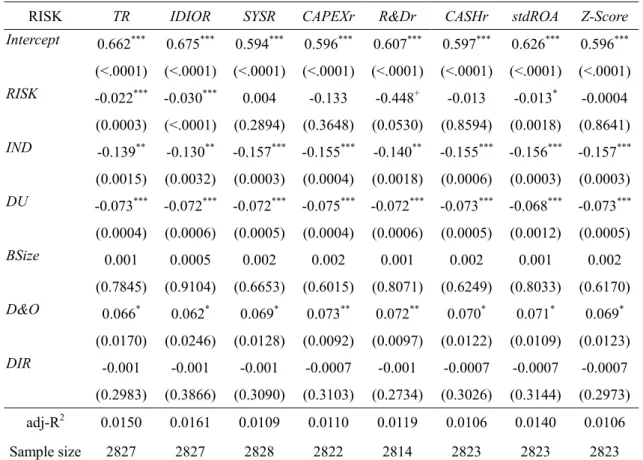
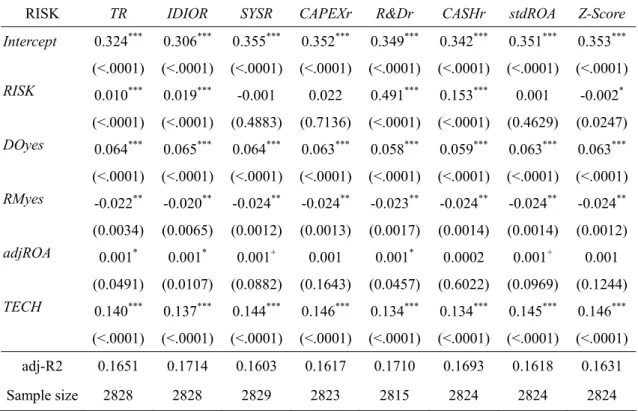
The hypotheses 1a and 2a about the negative relationship between RM attention and board independence are supported for all the eight risk-taking strategies under both OLS and 3SLS methods (see appendix1). The firms with more risk-taking present lower RM attention for stock returns risk TR and IDOR and income volatility StdROA under both methods, but not other five strategies. That is, hypothesis 3a is only partially supported. The hypothesis 3b that firms with more risk-taking present lower board independence is also partially supported only for stock returns risk TR and IDOR and capital expenditure CAPEXr under 3SLS, and insignificant relation for other risks. The risk-taking and corporate independence presents positive relation if based on OLS.
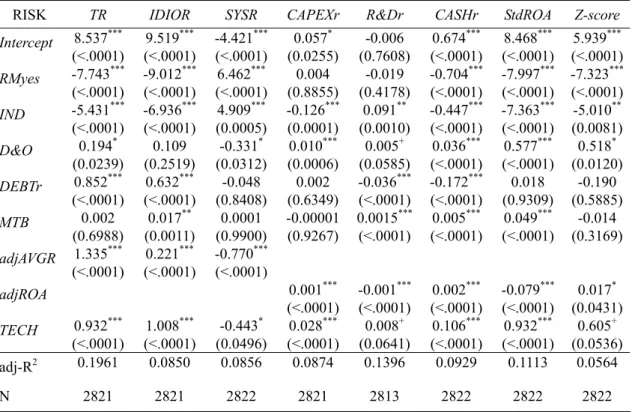
Table 8. 3SLS SEM for Risk Strategies, Depend Variable = Risk
RISK TR IDIOR SYSR CAPEXr R&Dr CASHr StdROA Z-score
Intercept 8.537*** (<.0001) 9.519*** (<.0001) -4.421*** (<.0001) 0.057* (0.0255) -0.006 (0.7608) 0.674*** (<.0001) 8.468*** (<.0001) 5.939*** (<.0001) RMyes -7.743*** (<.0001) -9.012*** (<.0001) 6.462*** (<.0001) 0.004 (0.8855) -0.019 (0.4178) -0.704*** (<.0001) -7.997*** (<.0001) -7.323*** (<.0001) IND -5.431*** (<.0001) -6.936*** (<.0001) 4.909*** (0.0005) -0.126*** (0.0001) 0.091** (0.0010) -0.447*** (<.0001) -7.363*** (<.0001) -5.010** (0.0081) D&O 0.194* (0.0239) 0.109 (0.2519) -0.331* (0.0312) 0.010*** (0.0006) 0.005+ (0.0585) 0.036*** (<.0001) 0.577*** (<.0001) 0.518* (0.0120) DEBTr 0.852*** (<.0001) 0.632*** (<.0001) -0.048 (0.8408) 0.002 (0.6349) -0.036*** (<.0001) -0.172*** (<.0001) 0.018 (0.9309) -0.190 (0.5885) MTB 0.002 (0.6988) 0.017** (0.0011) 0.0001 (0.9900) -0.00001 (0.9267) 0.0015*** (<.0001) 0.005*** (<.0001) 0.049*** (<.0001) -0.014 (0.3169) adjAVGR 1.335*** (<.0001) 0.221*** (<.0001) -0.770*** (<.0001) adjROA 0.001*** (<.0001) -0.001*** (<.0001) 0.002*** (<.0001) -0.079*** (<.0001) 0.017* (0.0431) TECH 0.932*** (<.0001) 1.008*** (<.0001) -0.443* (0.0496) 0.028*** (<.0001) 0.008+ (0.0641) 0.106*** (<.0001) 0.932*** (<.0001) 0.605+ (0.0536) adj-R2 0.1961 0.0850 0.0856 0.0874 0.1396 0.0929 0.1113 0.0564 N 2821 2821 2822 2821 2813 2822 2822 2822
Parameter estimates are listed with p-values in the parentheses. *** sig. at 0.1%; ** sig. at 1%; * sig. at 5%; + sig. at 10%.
5. Conclusion
This paper is to study the relationship between firm’s ERM policy and its risk-taking strategies, which has important implications for the stability of business operations and profitability. According to COSO-ERM framework, the strategic objectives are connected to its internal environment, including risk culture and the board of directors. Therefore this paper applies 3SLS simultaneous equations models to analyze the relationship among the three elements because they of their endogeneity. The result shows that RM attention has a significant and negative impact on corporate governance when firms make risk-taking strategies. This finding suggests that firms with more RM attention (conservative risk culture) may invite less outside directors because outsiders probably are not so risk averse as managers. The result shows that RM attention has a significant and negative impact on most risk-taking strategies. RM attention reduces volatility in stock returns, cash holding, income volatility, and bankruptcy risk as expected. In fact, that is the purpose of ERM emphasized in SOX.
Next, corporate governance has a significant and negative relation with RM attention for most of the risk-taking strategies. Among the three elements of board composition, the effect of board independence is most prominent, and is significant for all the eight risk strategies. The effect of leadership duality is significant and negative for some strategies, such as income volatility and bankruptcy risk. The effect of board size is insignificant for all the risk-taking strategies. Furthermore, the board independence has a significant impact on all the eight risk-taking strategies. The impact is negative for seven of the risk-taking strategies, with the only exception for positive impact on systematic risk.
with RM attention. The higher total risk and idiosyncratic risk of stock returns and incomes volatility usually implies a lower RM attention, while the greater systematic risk and capital expenditure may call for a higher RM attention. Some risk-taking strategies also have a significantly negative relation with board independence. The firms with higher level of total risk and idiosyncratic risk of stock returns, capital expenditure, and bankruptcy risk invites less independent directors probably because the risky firms do not like monitoring or because outsiders would not like to serve on the board of risky firms.
The empirical result based on 3SLS models is very different from that based on OLS. The major differences between the two methods are the effects of board independence and D&O insurance. Board independence has a positive impact or no effect on risk-taking strategies under OLS, but a negative impact under 3SLS. According to theory, better corporate governance is expected to reduce income volatility and bankruptcy risk since they are the purpose of governance. Previous empirical evidences also approved such negative relationship. Therefore 3SLS is more appropriate approach to study the issue of corporate governance because it considers the endogeneity among the variables.
Another major difference between the two analytical approaches is regarding D&O insurance. The effect of D&O insurance is insignificant for most risk-taking variables under OLS analysis, which is not consistent with previous studies. D&O insurance usually has important relationship with corporate governance and the consequent risk-taking strategies. When the analysis is conducted under 3SLS, D&O insurance shows a significantly positive effect on most of the risk-taking strategies which implies a moral hazard of insurance protection and is consistent with previous literature.
OLS. This outcome indicates that risk culture, board composition, and risk-taking strategies are connected to one another and must be analyzed as a system due to their endogeneity. Such 3SLS analytical approach is consistent with the rationale of three-dimensional COSO-ERM framework. The empirical finding of this paper suggests that risk-taking strategies of a firm must be established with consideration of its own internal environment, such as its risk culture and board composition. Because the internal environment is different among firms, every firm (even in the same industry) must set up its own ERM policy to achieve its business objectives and avoid the strategic risks.
References
Adams, R.B., Almeida, H ., and Ferreira, D . 2005. Powerful CEOs and their impact on corporate performance. Review of Financial Studies, 18(4): 1403-1432.
Akhigbe, A . and Martin, A.D . 2008. Influence of disclosure and governance on risk of US financial services firms following Sarbanes-Oxley. Journal of Banking
and Finance, 32(10): 2124-2135.
Andres, P . and Vallelado, E . 2008. Corporate governance m banking: The role of board of directors. Journal of Banking and Finance, 32(12): 2570-2580. Ashbaugh-Skaife, H., Collin, D., and Kinney, W. 2007. The discovery and reporting of
internal control deficiencies prior to SOX-mandated audits. Journal of
Accounting and Economics, 44(1): 166-192.
Baker, T. and Griffith, S. 2007. Predicting corporate governance risk: Evidence from the directors’ and officers’ liability insurance market. University of Chicago Law
Review, 74(2): 487-544.
Bargeron, L., Lehn, K., and Zutter, C. 2010. Sarbanes-Oxley and corporate risk-taking. Journal of Accounting and Economics, 49(1): 34-52. BIS. 2005. International convergence of capital measurement and capital
standards: A revised framework. Discussion Paper. Basel Committee on Banking Supervision, Basel, November 2005.
Boyd. J.H ., Graham. S.L., and Hewitt. R.S. 1993. Bank holding company mergers with nonbank financial firms: Effects on the risk-failure. Journal
of Banking and Finance, 17(1): 43-63.
Chapman R. 2006. Simple Tools and Techniques for Enterprise Risk Management. Sussex, England: John Wiley & Sons Ltd.
Journal of Fiancial Economics, 87(1): 157-176.
Chhaochharia, V., and Grinstein, Y. 2007. Corporate governance and firm value: The Impact of the 2002 Governance Rules. Journal of Finance, 62(4): 1789-1825. Cohen, D., Dey, A., and Lys, T. 2007. The Sarbanes-Oxley Act of 2002: implications
for compensation contracts and managerial risk-taking. working paper,
Northwestern University.
Coles, J. Daniel, N., and Naveen, L. 2006. Managerial incentives and risk-taking.
Journal of Financial Economics, 79(2): 431-468.
Coles, J. Daniel, N., and Naveen, L. 2008. Boards: does one size fit all? Journal of
Financial Economics, 87(2): 329-356.
COSO (Committee of Sponsoring Organizations of the Treadway Commission). 2004.
Enterprise Risk Management - Integrated Framework: Application Techniques.
COSO, NJ.
Core, J. 1997. On the corporate demand for directors’ and officers’ insurance. Journal
of Risk and Insurance, 64(1): 63-87.
Core, J. 2000. The directors’ and officers’ insurance premium: An outside assessment of the quality of corporate governance. The Journal of Law Economics, &
Organization, 16(2): 449-477.
Doyle, J. , Ge., W., and McVay, S. 2007. Determinants of weaknesses in internal control over financial reporting. Journal of Accounting and Economics, 44(1): 193-223. Frigo, M. and Anderson, R. 2011. Strategic risk management: A foundation for
improving enterprise risk management and governance. Journal of Corporate
Accounting & Finance, 22(3): 81-.88.
Gaver, J. and Gaver, K. 1993. Additional evidence on the association between the investment opportunity set and corporate financing, dividend, and compensation policies. Journal of Financial Economics, 16 (1): 125-160.
Ge, W. and McVay, S. 2005. The disclosure of material weaknesses in internal control after the Sarbanes-Oxley Act. Accounting Horizons, 19(3): 137-158.