行政院國家科學委員會專題研究計畫 成果報告
台灣期貨商成本特性與經營效率之研究
計畫類別: 個別型計畫 計畫編號: NSC94-2416-H-004-043- 執行期間: 94 年 08 月 01 日至 95 年 07 月 31 日 執行單位: 國立政治大學經濟學系 計畫主持人: 王國樑 計畫參與人員: 王國樑 報告類型: 精簡報告 處理方式: 本計畫涉及專利或其他智慧財產權,2 年後可公開查詢中 華 民 國 95 年 7 月 31 日
Scale and Scope Economies of
Futures Commission Merchants in Taiwan
Chih-Chiang Weng* and
Kuo-Liang Wang**
*Department of Accounting, Shih Chien University **Department of Economics, National Chengchi University
**Correspondence:
Professor Kuo-Liang Wang, Department of Economics, National Chengchi University Address: No.64, Sec. 2, Jhihnan Rd., Wunshan District, Taipei City 116, Taiwan Tel: 886-2-29387304
Fax: 886-2-29390344 E-mail: [email protected]
Scale and Scope Economies of
Futures Commission Merchants in Taiwan
Abstract
Based on the survey data of Taiwan’s futures commission merchants in 2004, this paper applies Zellner’s seemingly unrelated regression technique to a simultaneous system of a translog multi-product cost function and its corresponding factor share equations to investigate the extents of scale and scope economies of Taiwan’s FCMs. The empirical results show that product-specific scale economies exist for brokerage service, as well as proprietary and other services. Ray scale economies are significantly present. Economies of scope exist in providing brokerage service as well as proprietary and other services jointly.
Keywords: scale economies, scope economies, seemingly unrelated regression.
1. Introduction
Taiwan Futures Exchange (TAIFEX) was established and the first futures contract, Taiwan Stock Exchange Capitalization Weighted Stock Index (TAIEX) futures, was introduced in 1998. With the introduction of new products, easier access via electronic trading system, and deregulation in financial markets, Taiwan futures markets has attracted increasing numbers of individuals and institutions looking for ways to manage their financial risk.1 By the end of 2004, products traded at TAIFEX include electronic and finance sector indices futures, TAIEX futures and options, mini TAIEX futures, equity options, Taiwan 50 futures, 10-year government bonds, and 30-day commercial papers. Taiwan’s futures market has been experiencing rapid growth and moving in world ranking. Global futures and options exchange statistics show that TAIEX options at TAIFEX increased 22.10 percent to 43.82 million contracts traded in 2004, and ranked seventh on the top ten largest increases in trading volume, which was the only one not in Europe or the Americas on that ranking. In addition, trading volume (including futures and options exchanges) in TAIFEX increased from 31.87 million contracts, ranking twenty-seventh, in 2003 to 59.15 million contracts, ranking twentieth, in 2004.
Firms intend to trade at the TAIFEX must engage in a contractual relationship with the TAIFEX by signing an agreement to satisfy the operational requirements. In Taiwan, futures commission merchants (FCMs) conduct brokerage and proprietary business for all contracts at TAIFEX and designated foreign contracts according to the Article 5 of the Futures Trading Law. Practically, most of FCMs have extensive research departments and can provide current information and analysis concerning
1
The authorities opened the futures market to Qualified Foreign Institutional Investors (QFIIs), overseas Chinese, and foreign nationals to engage in futures trade for hedging purpose in 2000. Furthermore, the restrictions on foreign investments in the securities market were relaxed and the QFII system was cancelled in 2003. As a result, foreign institutions that intend to invest in Taiwan securities market only need to register with Taiwan Stock Exchange (TSEC) instead of applying to the authorities for approval.
market development as well as specific trading suggestions to futures traders. According to Taiwan’s futures markets statistics, although trading volume and trading accounts for the past five years grew substantially, the number of brokerage firms, including FCMs, securities firms with concurrent operations in futures trading business (SFs), and introducing brokers (IBs), had been decreasing gradually(See Table1). It could be reasonably inferred that some firms might quit the market due to fierce price competition, or some firms might be acquired or merged. In the face of continuing pressure from dropping commission rates, the primary challenge for FCMs is how to exploit cost advantages in the process of different services providing to survive or even to be profitable. This motivates our interest in the issues concerning the magnitude of cost advantages that FCMs in Taiwan can realize as a result of both their greater sizes and their ability to engage in the joint production of a broad as opposed to a more narrow line of services.
Previous studies regarding Taiwan futures market are primarily concentrated on the issues of investigating the impacts of foreign investment liberalization on the price discovery function and volatility of markets, the behavior and performance of different trader types, as well as the price discovery of the index futures contracts (Chiang and Kuo, 2004; Lin et al., 2005; Chan et al., 2004). There has been no empirical evidence in the literature on FCMs’ economies of scale and scope. This paper attempts to provide the first empirical analysis to investigate if FCMs in Taiwan are subject to economies of scale, which are evident when the firm’s average cost decline as its output expands, and/or economies of scope, which appear when cost savings can be realized by a single firm providing several services jointly, as compared to many firms each specializing in a single service.2 Hopefully, the results will be expected to provide a useful basis to discuss: (1) the magnitude of cost
2
Baumol et al. (1982) have shown that, in an unregulated market, the presence of multi-product firms is evidence of at least weak economies of scope over the set of products that they produce. In addition, Maurice et al. (1992, pp.624-636) also claim that many firms in the United States produce multiple products mainly because these products are complements in production or consumption.
advantages associated with increasing firm sizes; (2) the range of the services FCMs can efficiently provide to customers; and (3) the economic rationales underlying FCMs’ mergers and acquisitions.
The rest of this paper is organized as follows. Section 2 builds an empirical model composed of a translog multi-product cost function (TMCF) and its associated factor share equations. Data description, estimation procedures and empirical results are presented in Section 3. Section 4 concludes the paper.
2. The empirical model
According to the duality theory, cost and production functions which are dual to each other contain the same information regarding production possibilities given certain regularity conditions (Shephard, 1953). The structure of production can be studied empirically using either a production function or a cost function. Since functional forms developed for cost functions imply derived demand equations that are linear in the parameters, and at the same time represent very general production structures, estimation of the cost function is more attractive than direct estimation of the production function for studying the issues of economies of scale and scope.
Although there are a variety of flexible functional forms (e.g., generalized Leontief, translog, quadratic and CES) for empirical estimation of the production technology, the translog form proposed by Christensen et al. (1973) will be used in this paper due to its empirical practicality. The TMCF for futures commission merchants with m inputs and n outputs can be written as:
, , , , , , , , , ln ln ln ln ln ln ln ln ln 2 1 2 1 n 1 l k m 1 j i Q w Q Q w w Q w TC i k k i ik k l l k kl i j j i ij k k k i i i 0 K K = = + + + + + =
∑∑
∑∑
∑∑
∑
∑
δ θ γ β α α (1)where γij =γji , θkl =θlk , TC is the total cost, is the level of the kth output,
and is the price of the ith input. Corresponding to a well-behaved production function, the TMCF must be linearly homogeneous in input prices. This requires the
k
Q
i
following parameter restrictions: . , , 1 , 0 , , , 1 , , 0 , 1 i j m k n i ik j ij i i ij i = =
∑
= = K∑
= = K∑
α∑
γ γ δ (2)Though equation (1) contains all necessary information on the futures commission merchants’ technology, additional equations summarizing the futures commission merchants’ input choice need to be included in order to obtain accurate parameter estimates. Applying the Shephard’s lemma directly to equation (1) yields m factor share equations as follows:
∑
∑
+ = + = = = = k k ik j j ij i i i i i i i w Q i m w TC TC w TC w TC X w S ln ln , 1, , , ln ln ) / ( K δ γ α ∂ ∂ ∂ ∂ (3)where and indicate, respectively, the cost share and the level of input usage of the ith input. The set of factor share equations adds structural information but no additional unknown parameters. Equations (1)-(3) form a system to be estimated to explore the production properties of FCMs.
Si Xi
Ray scale economies (RSCE) are a straightforward extension of the concept of single-product scale economies and measure the proportional change in cost resulting from an equal proportional change in the levels of all outputs, holding the product mix unchanged. Therefore, the degree of ray scale economies is defined as:
, ln ln
∑
∑
≡ ≡ k k k k Q TC SCE RSCE ∂ ∂ (4) where . , , 1 , ln ln ln ln∑
∑
+ = + = i i ik l l kl k k n k w Q Q TC K δ θ β ∂ ∂ (5)SCEk, the measure of the product-specific scale economies as described in Panzar and Willig (1977), indicates how costs change as the level of one output changes, holding the levels of all other outputs constant. SCEk is greater than, equal to, or less than one as there are decreasing, constant, or increasing returns to scale with respect to the output k. Similarly, a value of RSCE greater than one indicates that total cost increases
more than proportionately with scale, implying that firms are operating in the region of decreasing returns to scale; firms are operating in the region of increasing returns to scale for a value of RSCE less than one; returns to scale are said to be constant as
RSCE is equal to one.
Economies of scope measure the cost advantages for firms’ providing diversified outputs against specializing in the production of a single output (Panzar and Willig, 1981). That is, economies of scope exist when it is more economical or efficient to produce two or more outputs jointly in a single firm than to produce the outputs in separate specializing firms. Theoretically, interproduct cost complementarities are a sufficient, not a necessary, condition for economies of scope (Baumol et al., 1982). Interproduct cost complementarities can be examined by measuring the impact of a change in the level of one output on the marginal cost of the other output. Thus, the degree of interproduct cost complementarities is measured as:
. , , 1 , , ] ln ln ln ln ln ln ln [ 2 2 l k n l k Q TC Q TC Q Q TC Q Q TC Q Q TC C l k l k l k l k kl ≡ = + ⋅∂ = K ≠ ∂ ∂ ∂ ∂ ∂ ∂ ∂ ∂ ∂ (6)
where will have the same sign as the expression in the brackets. A negative derivative indicates that economies of scope exist.
Ckl
3. Data description, estimation procedure and empirical results
3.1 Data description
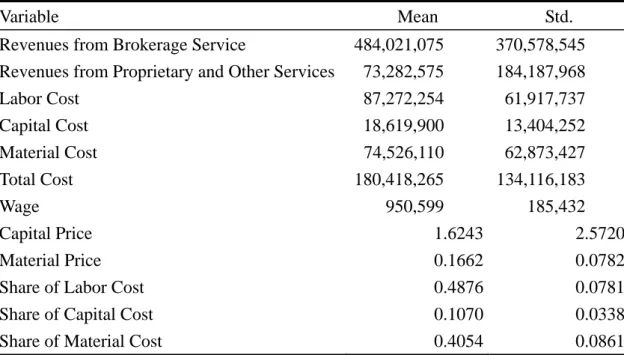
The data used in this paper are from the 2004 survey of FCMs in Taiwan, which was investigated by TAIFEX. The outputs of FCMs measured in terms of revenues are divided into two broad categories: brokerage service (including clearing and settlement service) (QA), as well as proprietary and other services (including management and consulting service) (QB). The inputs are categorized as labor, capital, and material, which were generally adopted in the theoretical and empirical frameworks in the existing literatures. Consequently, the price of labor (wL) is measured by dividing annual labor expenditures (including salaries, pensions and fringe benefits) by the total number of employees, which is namely the average annual
wage per employee. By referring to Muldur and Sassenou (1993), the price of capital (wK) is approximately constructured by dividing capital expenditures (including rent, interest expenditures, depreciation and various amortizations and depletions) by the net fixed assets. The price of material (wM) is approximately measured by dividing material expenditures (including expenditures on brokerage and proprietary services, and other operating expenditures) by the total operating revenues. Total cost (TC) is the sum of labor, capital and material expenditures. The labor cost share (SL), the capital cost share (SK) and the material cost share (SM) are then defined, respectively, as labor expenditures, capital expenditures and material expenditures per dollar of total cost. After deleting unqualified and incomplete observations, the actual sample size for this paper is 22. The basic statistics of all relevant variables are listed in Table 2. The data are standardized by dividing each output and price variable by its mean to make the calculations of the measures of economies of scale and scope more tractable (Caves et al., 1980).
3.2 Estimation procedure
The TMCF and each of the factor share equations are specified with additive disturbances that are jointly normally distributed with a zero mean and constant variance. The disturbances are assumed to be contemporaneously correlated across equations. Accordingly, Zellner’s seemingly unrelated regression (SUR) technique is used to estimate the system of equations (Zellner, 1962). Since the factor shares sum to unity, the variance-covariance matrix of disturbances across equations is singular. One of the factor share equations must be deleted from the system prior to estimation. Then, the Zellner’s procedure is iterated until convergence to yield maximum-likelihood estimates (Kmenta and Gilbert, 1968), and to guarantee that the estimates are invariant to which equation is dropped (Barten, 1969, pp.24-25).3 Since the results of the Zellner’s procedure are maximum-likelihood estimates, the hypotheses based on various restrictions imposed on the production technology can be
3
tested by using the likelihood ratio test.4
3.3 Empirical results
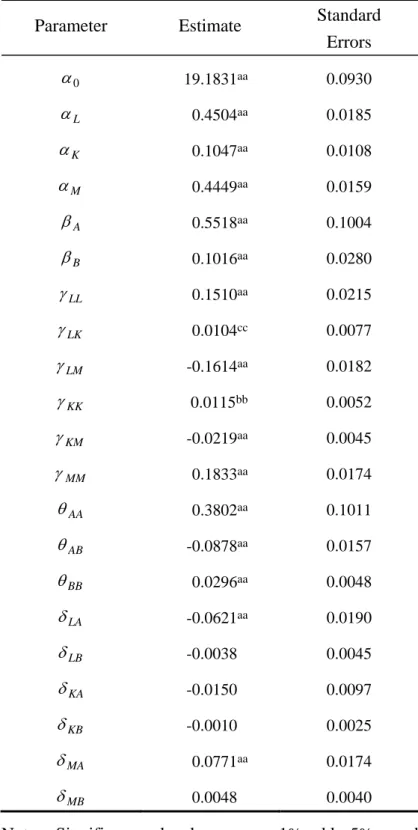
The parameter estimates, of which 15 are estimated directly and the remaining 6 are derived from the linear homogeneity restrictions, are presented in Table 3. The first-order parameters are all significant at the 0.01 level. The parameters that measure the interactions between input prices are all significant at least at the 0.1 level. The parameters that measure the interactions between the output levels are all significant at the 0.01 level. The parameters that measure the interactions between outputs and input prices are generally insignificant. Since all output and price variables are mean-scaled, the measures of RSCE and interproduct cost complementarities calculated at the mean levels of outputs and input prices are degenerated into
and
∑
=B A
k βk (βk ⋅βl +θkl) , k,l = A,B, k ≠l , respectively. The computed measures of product-specific scale economies, RSCE and interproduct cost complementarities from the parameter estimates are given in Table 4.
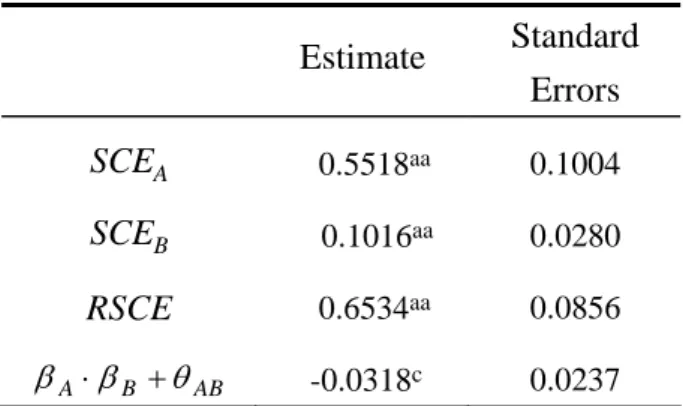
The estimate of the product-specific scale economies calculated at the mean levels of outputs and input prices for each service is significant and less than one, implying that FCMs in Taiwan on average enjoy product-specific scale economies in providing each of the services. As to the individual FCM’s overall economies of scale, the RSCE estimate also indicates that FCMs on average experience economies of scale. That is, an equal proportional increase in these two outputs results in a decline in ray average cost (Bailey and Friedlaender, 1982). Furthermore, the hypothesis of constant returns to scale can also be tested by using the likelihood ratio test. The hypothesis implies the following restrictions:
4
The likelihood ratio is λ =(Ωˆ R ΩˆU )−T2, where ΩˆR and ΩˆU represent the determinants of the restricted and unrestricted estimates of the disturbance covariance matrix, respectively; T is the number of observations. Theil (1971) has shown that the test statistic, −2lnλ, is distributed asymptotically as Chi-squared with degrees of freedom equal to the number of independent restrictions being imposed.
. , , 1 , 0 , , , 1 , , 0 , 1 k l n i m k ik l kl k k kl k = =
∑
= = K∑
= = K∑
β∑
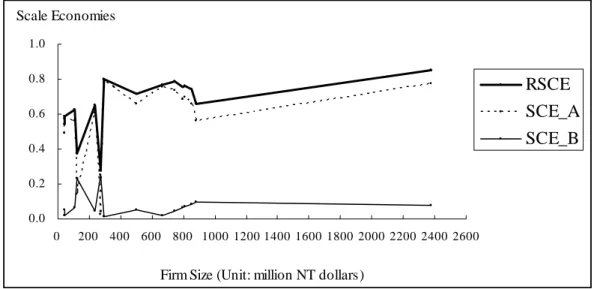
θ θ δ (7)As a result, the test statistics is 27.84, far exceeding the 1% critical Chi-squared value of 15.09 with five degrees of freedom. Hence, the hypothesis that FCMs in Taiwan operate in the region of constant returns to scale is rejected at the 0.01 level of significance. To explore how these scale economies vary with FCMs’ sizes, a line diagram where product-specific scale economies and ray scale economies are plotted against FCMs’ sizes measured by their total operating revenues is constructed in Figure 1. The degrees of ray scale economies and the scale economies specific to any service seem to be independent of the futures commission merchants’ sizes.
The estimate of (βA⋅βB +θAB) is negative at the 0.1 level of significance.5 The negative value of (βA⋅βB +θAB) indicates that cost savings can be realized while FCMs engage in joint production of brokerage service, as well as proprietary and other services. The cost advantages in providing these two services are derived from cost savings when common inputs are shared, or fixed (or quasi-fixed) costs are spread over an expanded product mix due to the presence of excess or idle capacity. The interproduct cost complementarities of these two services for each FCM are also computed and plotted against FCMs’ sizes in Figure 2. It also supports the empirical evidence about cost complementarity measurement. In addition, it is worthnoting that though there is unapparent relationship between interproduct cost complementarities and the FCM’s sizes, it seems to indicate that cost savings realized from the joint production of brokerage service, as well as proprietary and other services are substantial for small-sized FCMs. However, the cost advantages or disadvantages from joint production of these two services appear to be virtually exhausted or to vanish for very large FCMs. In other words, the cost effects resulting from providing diverse services is not present especially for the very large FCMs.
5
The null hypotheses of (βk ⋅βl +θkl)=0, k,l = A,B, k ≠l , are also tested by the
4. Conclusions
Electronic access, solid performance by managed funds, market volatility, and deregulation in financial markets have all contributed to a spectacular rise in futures trading volume in Taiwan. Though Taiwan futures exchange has enjoyed overall market growth for the past years, the primary concern for FCMs in Taiwan is how to make their business cost-effective when confronting with the pressure on commission and intense competition. The purpose of this paper was to study the cost properties of FCMs in Taiwan and to investigate if they are operating with efficient scales, offering proper product mixes, and/or moving in a good direction.
Based on the survey data of Taiwan’s FCMs in 2004, this paper applies Zellner’s seemingly unrelated regression technique to a simultaneous system of a translog multi-product cost function and its corresponding factor share equations to investigate the extents of scale and scope economies of Taiwan’s FCMs. The empirical results show that product-specific scale economies exist for brokerage service, as well as proprietary and other services. Ray scale economies are significantly present. Economies of scope exist in providing brokerage service as well as proprietary and other services jointly.
References
Bailey, E. & Friedlaender, A. F. (1982) Market structure and multiproduct industries.
Journal of Economic Literature, 20, 1024-1048.
Barten, A. P. (1969) Maximum likelihood estimation of a complete system of demand equations. European Economic Review, 1, 7-73.
Baumol, W. J., Panzar, J. C. & Willig, R. D. (1982) Contestable Markets and the
Theory of Industry Structure, New York: Harcourt Brace Jovanovich.
Caves, D. W., Christensen, L. R. & Tretheway, M. W. (1980) Flexible cost functions for multiproduct firms. Review of Economics and Statistics, 62, 477-481.
Chan, S.-J., Lin, C.-C. & Hsu, H. (2004) Do different futures contracts in one stock exchange have the same price discovery capability? Empirical study of Taiwan futures exchange. Journal of Financial Management and Analysis, 17, 34-44. Chiang, M.-H. & Kuo, W.-H. (2004) Impact of opening up of the Taiwan futures
market to foreign investors: Price effects of foreign investment liberalization: Empirical analysis. Journal of Financial Management and Analysis, 17, 1-11. Christensen, L. R., Jorgenson, D. W. & Lau, L. J. (1973) Transcendental logarithmic
production frontiers. The Review of Economics and Statistics, 55, 28-45.
Kmenta, J. & Gilbert, R. F. (1968) Small sample properties of alternative estimators of seemingly unrelated regressions. Journal of the American Statistical
Association, 63, 1180-1200.
Lin, C.-H., Hsu, H. & Chiang, C.-Y. (2005) Trading patterns and performance of trader types in Taiwan futures market. Review of Pacific Basin Financial Markets
and Policies, 8, 217-234.
Maurice, S. C., Thomas, C. R. & Smithson, C.W. (1992) Managerial Economics:
Applied Microeconomics for Decision Making, Boston: Irwin.
Muldur, U. & Sassenou, M. (1993) Economies of scale and scope in French banking and savings institutions. The Journal of Productivity Analysis, 4, 51-72.
monopoly. Bell Journal of Economics, 8, 1-22.
Panzar, J. C. & Willig, R.D. (1981) Economies of scope. American Economic Review,
71, 268-272.
Shephard, R. W. (1953) Cost and Production Functions, New Jersey: Princeton University Press.
Theil, H. (1971) Principles of Econometrics, New York: John Wiley & Sons.
Zellner, A. (1962) An efficient method of estimating seemingly unrelated regressions and tests for aggregation bias. Journal of the American Statistical Association, 57, 585-612.
Table 1 Taiwan’s futures markets statistics
Number of brokers Number of accounts and contracts
Year FCMs SFs IBs Individual accounts Institutional accounts Contracts 1998 26 41 79 139,378 608 NA 1999 25 42 104 225,111 921 1,077,672 2000 25 25 100 303,438 1,604 1,926,789 2001 26 24 99 368,792 2,134 4,351,390 2002 24 20 87 566,311 2,691 7,944,254 2003 24 17 82 816,083 4,296 31,874,934 2004 23 16 77 1,016,348 5,351 59,146,376
Sources: TAIFEX Review, TAIFEX, Taiwan, 1998~2004.
Table 2 The basic statistics of relevant variables
Variable Mean Std.
Revenues from Brokerage Service 484,021,075 370,578,545
Revenues from Proprietary and Other Services 73,282,575 184,187,968
Labor Cost 87,272,254 61,917,737 Capital Cost 18,619,900 13,404,252 Material Cost 74,526,110 62,873,427 Total Cost 180,418,265 134,116,183 Wage 950,599 185,432 Capital Price 1.6243 2.5720 Material Price 0.1662 0.0782
Share of Labor Cost 0.4876 0.0781
Share of Capital Cost 0.1070 0.0338
Share of Material Cost 0.4054 0.0861
Table 3 Parameter estimates of the TMCF model
Parameter Estimate Standard
Errors 0 α 19.1831aa 0.0930 L α 0.4504aa 0.0185 K α 0.1047aa 0.0108 M α 0.4449aa 0.0159 A β 0.5518aa 0.1004 B β 0.1016aa 0.0280 LL γ 0.1510aa 0.0215 LK γ 0.0104cc 0.0077 LM γ -0.1614aa 0.0182 KK γ 0.0115bb 0.0052 KM γ -0.0219aa 0.0045 MM γ 0.1833aa 0.0174 AA θ 0.3802aa 0.1011 AB θ -0.0878aa 0.0157 BB θ 0.0296aa 0.0048 LA δ -0.0621aa 0.0190 LB δ -0.0038 0.0045 KA δ -0.0150 0.0097 KB δ -0.0010 0.0025 MA δ 0.0771aa 0.0174 MB δ 0.0048 0.0040
Note: Significance levels are aa=1%, bb=5%, and cc=10% for two-tail tests.
Table 4 Economies of scale and scope estimates (calculated at the mean levels of input prices and outputs)
Estimate Standard Errors SCEA 0.5518aa 0.1004 SCEB 0.1016aa 0.0280 RSCE 0.6534aa 0.0856 AB B A β θ β ⋅ + -0.0318c 0.0237
Note: Significance levels are aa=1% for two-tail tests; c=10% for one-tail tests.
0.0 0.2 0.4 0.6 0.8 1.0 0 200 400 600 800 1000 1200 1400 1600 1800 2000 2200 2400 2600
Firm Size (Unit: million NT dollars) Scale Economies
RSCE SCE_A SCE_B
Figure 1 Scale Economies vs. Firm Size
-3.50E-05 -3.00E-05 -2.50E-05 -2.00E-05 -1.50E-05 -1.00E-05 -5.00E-06 0.00E+00 0 200 400 600 800 1000 1200 1400 1600 1800 2000 2200 2400 2600
Firm Size (Unit: million NT dollars) Interproduct Cost
Complementarities
C_AB
A Study of Technical Efficiency of Futures Commission
Merchants in Taiwan
Kuo-Liang Wang
Department of Economcis, National Chengchi University, Taipei, Taiwan
Tai-Sen He
Department of Economcis, National Chengchi University, Taipei, Taiwan
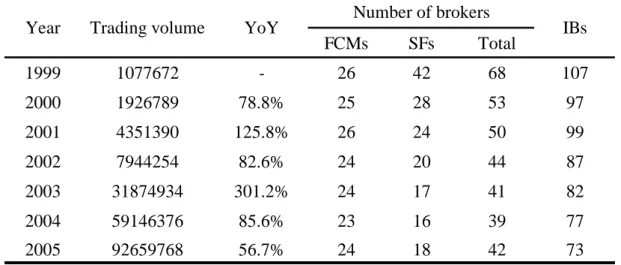
I. Introduction
Along with the globalization and liberalization of Taiwan’s financial markets, the demands for derivative financial products increase tremendously, leading Taiwan’s futures market to prosper. The annual trading volume, in terms of the number of futures contracts, increases from 1,077,672 in 1999 to 92,659,768 in 2005 (See Table 1). On the contrary, the supply side shrinks gradually. During the period of 1999–2005, the number of futures commission merchants (FCMs) drops from 26 to 24. Also, the number of securities firms concurrently engaged in securities-related futures business drops from 42 to 18. The above phenomena indicate that even during the period of market expansion, the supply side does not necessarily move in the same direction. From the viewpoint of industrial economics, there are two possible explanations for it. One is that managerial performance among individual firms in this industry diverges greatly and inefficient firms are driven out of the market. The other is that the cost structure of futures commission industry may exhibit economies of scale and/or economies of scope. The average cost per unit would reduce with the expansion of outputs and/or with the diversification of services. To survive in the market, firms may increase their operating sizes via setting up new branches or via mergers and acquisitions (M&As) to exploit cost advantages. The number of firms ,as a result, would decrease. Therefore, two major topics deserve to be further studied: (1) whether some FCMs in Taiwan have superior managerial performance than others? If the answer is yes, what firm-specific characteristics may be the major factors that help them to have the better performance? (2) whether FCMs in Taiwan are subject to economies of scale and/or economies of scope? The latter has been investigated in Weng and Wang (2006), so this paper will be mainly focused on the former.
Table 1: Trading Volumes and the Number of Futures-related Firms in Taiwan during the Period of 1999-2005
FCMs SFs Total 1999 1077672 - 26 42 68 107 2000 1926789 78.8% 25 28 53 97 2001 4351390 125.8% 26 24 50 99 2002 7944254 82.6% 24 20 44 87 2003 31874934 301.2% 24 17 41 82 2004 59146376 85.6% 23 16 39 77 2005 92659768 56.7% 24 18 42 73
Year Trading volume YoY Number of brokers IBs
Source: TAIFEX
Notes:1.YoY: year-on-year percentage 2.FCMs: futures commission merchants
3.SFs: securities firms concurrently engaged in securities-related futures business 4.IBs: introducing brokers6
To evaluate the managerial performance of FCMs in Taiwan, data envelopment analysis (DEA) provides an appropriate approach. It is a mathematical programming technique developed by Charnes et al. (1978) to evaluate technical efficiency7. Technical efficiency is measured by determining the maximum feasible reduction of inputs for the given levels of outputs (an input-conserving orientation), or by determining the maximum feasible expansion of outputs for the given levels of inputs (an output-augmenting orientation). In addition, taking the reference technology exhibiting different types of returns to scale into consideration8, the technical efficiency, also called overall technical efficiency, can be further decomposed into two components, purely technical efficiency and scale efficiency (Banker et al., 1984). The former, purely technical efficiency, can be used to evaluate inefficiency caused by wasting resources or inferior management. The latter, scale efficiency, can be used to evaluate inefficiency from inappropriate operating scale. After assessing overall
6
Introducing brokers are securities firms contracted with FCMs so that the clients can place orders of futures via associated people of securities firms. FCMs have to pay commission fees to the introducing brokers for each transaction.
7
Actually, DEA can be used to measure productive efficiency which comprises two parts: the technical (physical) and allocative (price) parts (Farrell, 1957). Since the measurement of the latter requires information on input prices that are often difficult to obtain or measure accurately in the futures commission industry, this paper will be focused mainly on technical efficiency.
8
There are two categories of the DEA models: the CCR model and the BCC model. The CCR model assumes that reference technology exhibits constant returns to scale (CRS). The BCC model relaxes this assumption and variable returns to scale (VRS) is assumed.
technical efficiency, purely technical efficiency and scale efficiency, this paper will adopt the Tobit censored regression to explore the relationship between technical efficiency and firm-specific characteristics. Thereafter, strategic implication for FCMs can be derived from the regression results.
The advantage of DEA is that it does not require a pre-specification of a parametric functional form and several implicit or explicit assumptions about the production correspondences. However, there are two major considerations when applying DEA to efficiency evaluation. The first is data errors. Since DEA is a non-parametric approach, efficiency evaluation results are very sensitive to data errors (Ahn and Seiford, 1992). Thus, this paper uses the survey data collected and carefully checked by Taiwan Futures Exchange (TAIFEX) and China National Futures Association (CNFA) to eliminate possible data errors. The other is the homogeneity among decision making units (DMUs). The more similar the production processes among individual DMUs are, the more comparable the efficiency evaluation results will be. To avoid measurement errors caused by heterogeneity, the sample in this paper will consist of FCMs only, while excluding SFs from it.
In the past two decades, DEA has been widely used to measure efficiency among firms in many industries, including profit, non-profit and public sector (Seiford, 1996)9. Although a great deal of literature is focused on financial institutions, such as commercial banks, insurance companies and investment banks (Amel, et al., 2004), it is relatively rare regarding to securities-related industry. Zhang, et. al. (2006) employed DEA to investigate the US securities industry during the period of 1980-2000. Wang, et. al. (2003) evaluate production efficiencies of integrated securities firms in Taiwan based on the 1991-1993 data. Fukuyama and Weber (1999) investigate the efficiency and productivity of Japanese securities firms during the period of 1988-1993. The main reason for the lack of securities-related studies is that, unlike other financial industries, regulators do not collect and make publicly available the type of information necessary to analyze securities-related industry (Zhang, et. al., 2006). To our knowledge, this paper is the first to apply DEA in assessing FCMs’ efficiency.
In addition to this section, the rest of this paper is organized as follows. Section II will first construct the empirical model of DEA to evaluate individual FCMs’ technical efficiency. Then, Tobit censored regression model will be established to explore the relationship between technical efficiency and firm-specific characteristics. Data description, interpretation of the efficiency-evaluation and the Tobit censored
9
regression results will be presented in Section III. Section IV concludes this paper.
II. EMPIRICAL MODELS
2.1 Efficiency Evaluation ModelThe DEA approach introduced by Charnes et al. (1978) uses a mathematical programming technique to determine a piecewise linear envelopment surface from the observed levels of inputs and outputs of DMUs. The envelopment surface is referred to as the efficient frontier. DMUs which construct the frontier are termed efficient; DMUs which do not lie on the frontier are termed inefficient. The distance between the former and the later provides a measure of efficiency and inefficiency.
As mentioned in the previous section, there are input-oriented and output-oriented models to evaluate the technical efficiency in the DEA approach. Lovell(1993) suggested that if producers are required to meet market demand, and if they can freely adjust the input usage, then input-oriented model seems appropriate. On the contrary, if they cannot freely adjust the input usage, output-oriented model is proper. Theoretically, output-oriented model is commonly used in public sector due to inflexible budget and staffs. Private sector, not subject to these constraints, is evaluated by input-oriented model. The input-oriented DEA model is adapted in this paper since FCMs belong to private sector in Taiwan.
Suppose that there are n DMUs in a market, each using m inputs and producing s outputs. Let and denote the ith (i=1,2,……,m) input usage and the rth (r=1,2,……,s) output production of the jth (j=1,2,……,n) DMU. According to Fare et al. (1985), under the assumptions of the reference technology exhibiting constant returns to scale (CRS) and free disposability of inputs, the kth DMU’s overall technical efficiency measure (Fk) can be gauged by solving the following problem
(Model I): ij x yij k k n k F θ λ λ θ ,min1..., = . (1) subject to
∑
. (2) = = ≤ n j ik k ij jx x i m 1 ,..., 2 , 1 , θ λ∑
= = ≥ n j rk rj jy y i s 1 ,..., 2 , 1 , λ (3) n j j ≥0, =1,2,..., λ . (4)whereλjis the weight of the jth DMU’s production action used. Just as the Model I describes, the overall technical efficiency is evaluated in terms of the feasibility of its inputs usage radical reduction. If the inputs usage radical reduction is feasible, then optimalFk <1; otherwise, Fk =1.
The overall technical efficiency measure (Fk) evaluated above is not only
influenced by the purely technical inefficiency, but also by the inappropriate operating scale chosen. To decompose these two inefficient factors, the reference technology assumption of the Model I is relaxed to those of variable returns to scale (VRS) by imposing the constraint (Banker et al., 1984):
∑
= = n j j 1 1 λ (5) Thereafter, purely technical efficiency measure Fk(VRS) is produced. SinceFk(VRS) excludes the operating scale impact, it is regarded as the kth DMU’s purely
technical efficiency measure, and the scale efficiency measure(SEk) corresponding to
the kth DMU is defined as the ratio of Fk to Fk(VRS), that is
) (VRS F F SE k k k ≡ (6)
Obviously, 10≤Fk ≤Fk(VRS)≤ . It implies that SEk ≤1. If , then the kth DMU is scale-efficient; if , then the kth DMU is scale-inefficient. If a DMU is scale-efficient, it indicates that the DMU is operated in optimal scale (in the area of CRS region). Otherwise, if a DMU is scale-inefficient, it is operated in inappropriate scale. To determine the DMU is operated in an area of increasing or decreasing returns to scale, this paper follows the method provided by Coelli(1996). He substitutes equation (5) with
1 = k SE 1 < k SE (7)
∑
= ≤ n j j 1 1 λThe objective variable is denoted by . If Fk(NIRS) and Fk(VRS) are unequal,
increasing returns to scale exist for that DMU; otherwise, decreasing returns to scale )
(NIRS
exist.
2.2 Tobit Censored Regression Model
The regression technique is then used to explore the relationship between technical efficiency and firm-specific characteristics. Since there is a non-negligible proportion of observations reaching the maximum efficiency measure of one, the ordinary least square technique applied to a censored regression model may yield estimates that are asymptotically biased toward zero (Greene, 1981). Therefore, by referring to McCarty & Yaisawarng (1993), Cheng et al.(2000) and Wang et al. (2003), Tobit censored regression model will be adopted in this paper.
In the existing studies, technical efficiency has been linked with a number of firm-specific attributes, including firm size, service concentration, location. (Cheng et al., 2000; Wang et al., 2003). This paper will also investigate the factors which capture the firm’s long-term strategic consideration in the industry, for example, electrical trading ratio and the number of introducing broker contracted. Consequently, the regression models for examining the relationship between technical efficiency measures and firm-specific attributes in this paper can be built as follows:
Fk = f ( FS, FS^2, ELEC, ERROR, IB, SEC ) (7)
(?) (?) (+) (-) (?) (+)
where Fk is overall technical efficiency evaluated in Section 2.1. FS is firm size, which is measured by total revenues. FS^2 is measured by the squares of total revenues. ELEC is electrical trading ratio, which is measured by the ratio of FCMs’ trading volumes via electrical media to total trading volumes. ERROR denotes the ratio of out-trade loss to total revenues, representing the exactness of processing clients’ orders. IB is the number of introducing brokers, which indicates strategic alliance partners contracted with individual FCMs to expand their trading volumes and market shares. SEC is the dummy variable which indicates whether an FCM has securities-related industry background. The notation under each dependent variable indicates its expected sign. Fundamentally, the theoretical foundation for the relationship between technical efficiency measures and firm-specific attributes can be illustrated as follows:
Firm Size (FS)
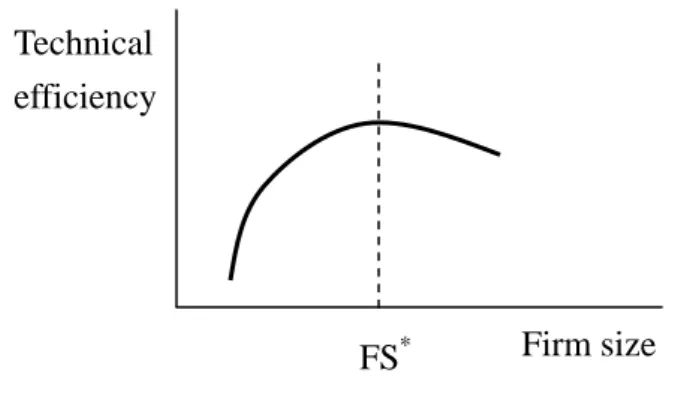
In general, FCMs can enjoy economies of scale as their sizes expand from the very beginning, and suffer diseconomies of scale while they grow beyond some level of size. The advantage from sharing or joint utilization of inputs and the
disadvantages from allocative complexity simultaneously exist as firm size expands. However, the former dominates the latter at the very beginning, and then the latter outweighs the former after some point. Therefore, the relationship between technical efficiency and firm size may be a inverse U-shaped curve (Please refer to Figure 1). Before the level of optimal size (FS*), technical efficiency may increase with the expansion of firm size but in a decreasing rate. In this region, the sign of FS is positive while the sign of FS^2 is negative. After reaching the optimal size, the relationship becomes negative. The sign of FS becomes negative. Therefore, the relationship between technical efficiency and the firm size is hard to determined without further empirical investigation.
Technical efficiency
Firm size FS*
Figure 1: The relationship between technical efficiency and firm size
Electrical Trading Ratio (ELEC)
In the past, futures traders have to place their orders through qualified, registered associated persons. Nowadays, along with the development of technology, FCMs’ clients can place orders through electrical media, including the internet and other electrical forms, to facilitate their transaction. On the part of FCMs, they would benefit from electrical trading in two aspects. First, they can save (reduce) much labor inputs in accepting and processing orders. Also, the possibility of out trades can decrease due to the accuracy (exactness) of electrical trading. Therefore, the relationship between technical efficiency and electrical trading ratio is expected to be positive.
Out-Trade Loss to Total Revenues Ratio (ERROR)
FCMs may commit errors when engaging in consigned futures trading such that the trading result does not conform to the original consignment. These errors are
called out-trades which result from improper entry of a trader's account number or other trading information. When out-trades occur, FCMs have to spend much labor and time to handle these errors, such as offsetting out-trades through FCMs’ error account10, adjusting positions and submitting reports to original principal and TAIFEX. Furthermore, out-trade loss may occur in the process of offsetting out-trades due to price fluctuation. Consequently, the higher the possibility of out-trades, the more resources a FCM wastes in handling them. The relationship between technical efficiency and the out-trade loss to total revenues ratio is expected to be negative.
The number of introducing brokers (IB)
According to Rules Governing the Operation of Auxiliary Futures Trading Services by Securities Firms, FCMs can contract with approved securities firms, called introducing brokers or futures trading assistant, so that futures traders may place orders through them. The FCMs’ purpose of contracting introducing brokers is to solicit the existing clients of securities firms so that they could enlarge the geographical coverage of the market and expand their trading volumes without setting new branches which is usually much more costly. However, since the degree of product homogeneity among FCMs is high, price competition is fierce. As a result, the commission fees paid by FCMs to introducing brokers may be high, offsetting the advantage of larger trading volumes. Therefore, the relationship between technical efficiency and the number of introducing brokers is hard to determined without further empirical investigation.
Securities industry background (SEC)
One of the main reasons why people trade futures is hedging11. If they hold a great deal of spot positions, they may need to buy futures contracts to hedge the price risks, especially when negative political and economic events occur. In this way, futures can be regarded as a demand complement for spots. In the case of Taiwan, people who trade futures are usually those who have plentiful experience in trading stocks. Therefore, some FCMs held by large-scale securities companies can take advantage of their stronger securities industry background. For example, they can get easy access to client database to exploit potential clients and execute cross selling to expand their trading volumes effectively. Consequently, the relationship between technical efficiency and securities industry background is expected to be positive.
10
According to Guidelines For The Reporting And Handling Of Out-Trades By Futures Commission Merchants, when a futures commission merchant commits an error or omission when engaging in consigned futures trading such that the trading result does not conform to the original consignment, it shall handle the out-trade position through the segregated error account which is under its own name at its head office and each branch office.
11
III. Data Description and Empirical Results
3.1 Data DescriptionThe data used in this paper are based on the survey data conducted by TAIFEX. The survey includes 24, 24, 23 FCMs in Taiwan, respectively, which operated their businesses during 2002-2004. After deleting unqualified and incomplete observations, the effective sample size for this paper is 69.
In choosing input and output variables, this paper considers the operating characteristics of FCMs and refers to the previous literature to select appropriate input/output variables (Zhang, et. al., 2006; Wang, et. al., 2003; Fukuyama and Weber 1999). Three output variables and three input variables are specified in the efficiency analyses12. The outputs of FCMs are classified into three categories: brokerage business, proprietary business as well as advisory business. Brokerage business output is measured by brokerage fee revenues deducted from associated handling charges paid to TAIFEX and commission fee charges paid to introducing brokers. Proprietary business output is measured by net gain on futures and options contracts deducted from associated handling charges paid to TAIFEX.13 Advisory business output is measured by futures consulting fee revenues. On the input side, three types of inputs are distinguished: labor, capital and operating expenses. Labor is measured by the number of employees. Capital is measured by net fixed assets. Operating expenses is measured by operating expenses subtracted from labor-related and capital-related expenses, including salaries, fringe benefits, depreciation expenses and amortization expenses to avoid double-counting.
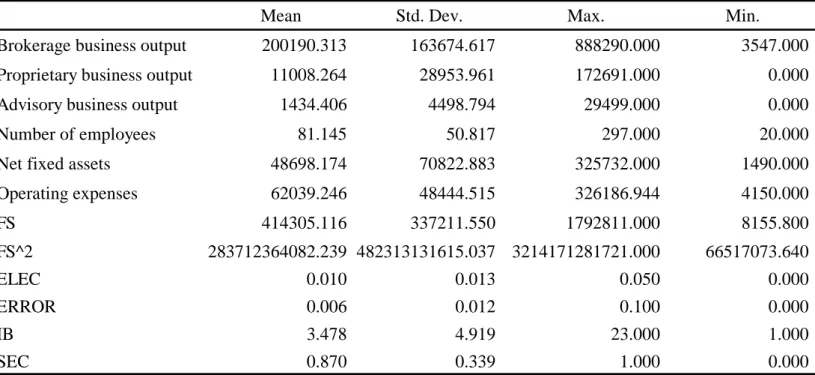
In the regression analysis, FS is measured by total revenues. FS^2 is measured by the squares of total revenues. ELEC is measured by the ratio of trading volumes via electrical media to total trading volumes. ERROR is measured by the ratio of out-trade loss to total revenues. IB is measured by the number of introducing brokers contracted with individual FCMs. The dummy variable SEC=1 indicates that a FCM has securities industry background; otherwise, SEC=0. The descriptive statistics of the revelent variables for both efficiency and regression analyses are presented in Table 2.
12
Originally, four different input-output mixs are chosen and conducted similar analyses. The rest of empirical results can be provided upon request.
13
Net gain on futures and options contracts is gain on futures and options contracts deducted from loss on futures and options contracts
Table 2: The Descriptive Statistics of the Relevant Variables
Mean Std. Dev. Max. Min.
Brokerage business output 200190.313 163674.617 888290.000 3547.000 Proprietary business output 11008.264 28953.961 172691.000 0.000
Advisory business output 1434.406 4498.794 29499.000 0.000
Number of employees 81.145 50.817 297.000 20.000
Net fixed assets 48698.174 70822.883 325732.000 1490.000
Operating expenses 62039.246 48444.515 326186.944 4150.000 FS 414305.116 337211.550 1792811.000 8155.800 FS^2 283712364082.239 482313131615.037 3214171281721.000 66517073.640 ELEC 0.010 0.013 0.050 0.000 ERROR 0.006 0.012 0.100 0.000 IB 3.478 4.919 23.000 1.000 SEC 0.870 0.339 1.000 0.000
Note: Outputs, net fixed assets, operating expenses and firm size are measured in terms of NT dollars.
3.2 Empirical Results
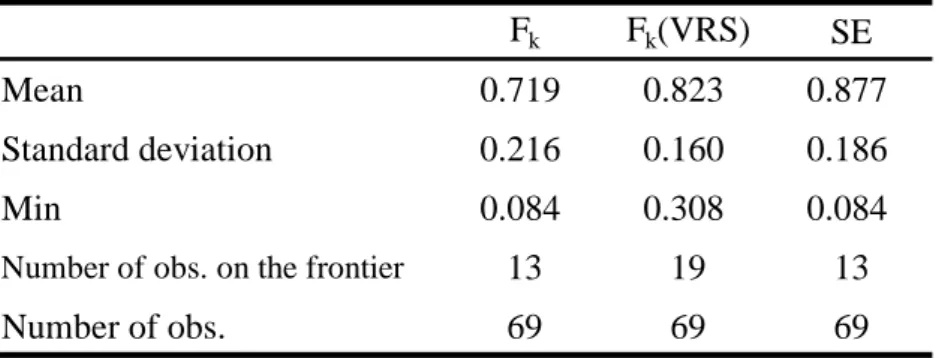
Efficiency evaluation results. The efficiency evaluation results for each efficiency
measure are summarized in Table 3-5. The mean overall technical efficiency (Fk)
measure is 0.719. It implies that FCMs in Taiwan could have reduced inputs by 28.1%, on average, and still have produced the same level of outputs. The overall technical efficiency can be further decomposed into two factors: purely technical efficiency and scale efficiency. The mean purely technical efficiency measures (Fk(VRS)) is 0.823
while the mean scale efficiency measures(SE) is 0.877. These results imply that the overall technical inefficiency, 28.1%, can be contributed partly to wasting resources and partly to inappropriate production scale. By adjusting FCM’s operating size to optimal scale, the mean overall technical efficiency can increase from 0.719 to 0.823. The rest of the technical inefficiency, 17.7%, requires improvement in managerial performance to reduce resources wasted. Moreover, the number of observations on the frontier is 13 out of 69 in overall technical efficiency and 19 out of 69 in purely technical efficiency. This shows that most FCMs in Taiwan have an ample space to improve.
Table 3: Summary of FCMs' Technical Efficiency Measures Fk Fk(VRS) SE
Mean 0.719 0.823 0.877
Standard deviation 0.216 0.160 0.186
Min 0.084 0.308 0.084
Number of obs. on the frontier 13 19 13
Number of obs. 69 69 69
This paper sorts the efficiency-evaluation results by year to demonstrate changes in technical efficiency during 2002-2004 (See Table 4). It is found that the means of overall technical efficiency, purely technical efficiency and scale efficiency measures in 2003 are higher than those in 2002. Similarly, the means of overall technical efficiency and purely technical efficiency measures in 2004 are slightly higher than those in 2003. That is, there exists upward trend in technical efficiency, indicating that FCMs need time to gain expertise in operating futures-related business. Their technical efficiency can be improved gradually due to learning curve effect.
Table 4: Changes in Means of FCMs’ Technical Efficiency Measures during 2002-2004 Year Fk Fk(VRS) SE 2002 0.636 0.762 0.848 2003 0.752 0.841 0.893 2004 0.770 0.867 0.889 Total 0.719 0.823 0.877
To investigate scale efficiency measures further, this paper calculates Fk(NIRS)
provided by Coelli(1996) to analyze in which region each FCM operates. The result is summarized in Table 4. In 2002, 17 out of 23 FCMs, or 73.9 percent, operated in DRS region while 3 FCMs operated in IRS region. Only 3 FCMs operated in optimal scale (CRS region). In 2003, 16 out of 23 FCMs operated in DRS region while 3 FCMs operated in IRS region. 4 FCMs operated in CRS region. In 2004, 13 out of 23 FCMs operated in DRS region while 4 FCMs operated in IRS region. 6 FCMs operated in CRS region. Clearly, the number of FCMs operating in DRS region decreased gradually while the number of FCMs operating in CRS region increased gradually. This result may reflect that FCMs were trying to expand their operating size to reduce inefficiency from scale and thus improve their overall technical efficiency. However,
56.5 percent of FCMs were still operating in DRS region.
Table 5: Summary of FCMs’ production properties
DRS CRS IRS Number of Obs.
2002 17 (73.9%) 3 (13.0%) 3 (13.0%) 23
2003 16 (69.6%) 4 (17.4%) 3 (13.0%) 23
2004 13 (56.5%) 6 (26.1%) 4 (17.4%) 23
Total 46 (66.7%) 13 (18.8%) 10 (14.5%) 69
Regression results. This paper adopts Tobit censored regression model to estimate
Equation 7. The regression results are presented in Table 6. Since it is found in Table 4 that overall technical efficiency in 2002 are lower than that in 2003 and 2004. Therefore, this paper adds one dummy variable Year 2003/2004 to Equation 7. If the observation is in 2003 or 2004, Year 2003/2004=1; if the observation is in 2002, Year
2003/2004=0, the sign of the dummy variable is expected to be positive.
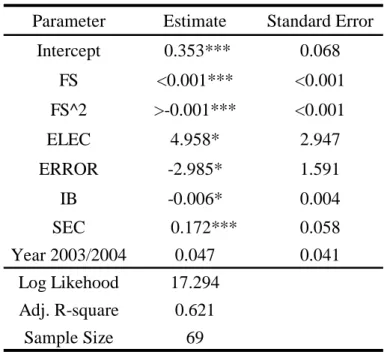
The regression result shows that firm size(FS) has a positive impact on technical efficiency at the 0.01 significant level. The squares of firm size(FS^2) has a negative impact on technical efficiency at the 0.01 significant level. The results indicate FCMs can exploit economies of scale as their sizes expand. However, the impact is decreasing because the advantage from sharing or joint utilization of inputs may be offset by the disadvantages from allocative complexity. There exists a positive relationship between the electrical trading ratio(ELEC) and technical efficiency at the 0.1 significant level, implying that FCMs can benefit from trading via electrical media because of reduction in labor and the possibility of out trades. Out-trade loss to total
revenues ratio(ERROR) has a negative impact on technical efficiency at the 0.1
significant level. This indicates that FCMs suffer from out-trades because they have to spend much labor and time to handle these mistakes, including offsetting and adjusting positions as well as submitting reports to TAIFEX. There exists a negative relationship between the number of introducing brokers(IB) and technical efficiency at the 0.1 significant level, implying that introducing brokers may help FCMs expand their trading volumes but the commission fees paid by FCMs are so high that the brokerage business output do not necessarily increase proportionally. Thus, technical efficiency does not improve with the number of introducing brokers. The coefficient of the SEC dummy variable is positive at the 0.1 significant level, implying that FCMs with securities industry background can benefit from the easy access to client database of their holding securities companies to exploit potential clients and execute cross selling to expand their trading volumes effectively. Finally, the coefficient of the
dummy variable Year 2003/2004 is positive but insignificant, implying that FCMs’ may gain expertise in operating futures-related business with the passage of time, but the learning curve effect seems to be insignificant.
Table 6: Tobit Censored Regression Results Parameter Estimate Standard Error
Intercept 0.353*** 0.068 FS <0.001*** <0.001 FS^2 >-0.001*** <0.001 ELEC 4.958* 2.947 ERROR -2.985* 1.591 IB -0.006* 0.004 SEC 0.172*** 0.058 Year 2003/2004 0.047 0.041 Log Likehood 17.294 Adj. R-square 0.621 Sample Size 69
Notes: ***,**,* represent that the coefficients are significantly different from 0 at the 0.001, 0.005, 0.1 levels, respectively.
IV. Conclusions and Suggestions
Along with the globalization and liberalization of Taiwan’s financial markets, the demands for derivative financial products increase tremendously, leading Taiwan’s futures market to prosper. During the period of 1999-2005, the supply side shrinks gradually in terms of the number of firms although the demand side increases in terms of the annual trading volume of futures contracts. One possible explanation for the above phenomena is that the managerial performance among individual firms in this industry diverges greatly and inefficient firms are driven out of the market. Based upon the survey data conducted by TAIFEX during the period of 2002-2004, this paper first applied the DEA technique to evaluate the efficiency of Taiwan’s FCMs, and then the Tobit censored regression was used to investigate the determinates of the efficiency of FCMs in Taiwan.
The efficiency-evaluation results show that the mean overall technical efficiency of FCMs is 0.719, implying that they could have reduced inputs by 28.1 percent, on average, and still have produced the same level of outputs. This shows that most FCMs in Taiwan have an ample space to improve. The mean purely technical
efficiency measures is 0.823 while the mean scale efficiency measures is 0.877. It implies that, by adjusting FCM’s operating size to optimal scale, the mean overall technical efficiency can increase from 0.719 to 0.823. The rest of the technical inefficiency, 17.7%, requires improvement in managerial performance to reduce resources wasted. It is also found that the number of FCMs operating in DRS region decreased gradually while the number of FCMs operating in CRS region increased gradually during the period of 2002-2004, but most FCMs are still operating in DRS region. The regression result shows that firm size has a positive, but in a decreasing rate, impact on technical efficiency. The electrical trading ratio is positively related with technical efficiency. Out-trade loss to total revenues ratio has a negative impact on technical efficiency. The number of introducing brokers and technical efficiency are negatively related. FCMs with securities industry background are more technically efficient than those without.
According to the empirical evidence, this paper could provide some implications and suggestions for FCMs in Taiwan to improve their efficiency. First, since most of the FCMs are still located in DRS region and technical efficiency can enhance with expansion of the firm size, it may provide small-to-medium-sized FCMs with incentives for M&As to expand their operational scales. Second, it is suggested that FCMs can encourage their customers to place orders via electrical media by providing incentives, such as discounts on brokerage fee charges. Third, FCMs can invest in on-the-job training to enhance the quality of employees so that the possibility of out-trades loss can be effectively reduced. FCMs with securities industry background can enhance cooperation with their holding securities firms so that they can make good use of clients database to conduct cross-selling strategy.
Acknowledgements
Financial support from the National Science Council under NSC 94-2416-H-004-043 is acknowledged.
Reference
Ahn, T. and Seiford, L. M. (1992), “Sensitivity of DEA to models and variables sets in a hypothesis test setting: The efficiency of university operations”, Ijiri, Q.(ed.), Creative and Innovative Approaches to the Science of Management, New York. Amel, D., Colleen B., Fabio P. and Carmelo S. (2004), “Consolidation and efficiency
in the financial sector: A review of the international evidence,” Journal of Banking and Finance, Vol. 28, 2493-2515.
Banker, R. D. , A. Charnes, and W.W. Cooper(1984), “Some Models for Estimating Technical and Scale Inefficiencies in Data Envelopment Analysis,” Management Science, Vol. 30, 1078-1092.
Berger, A. N. and David B. H. (1997), “Efficiency of financial institutions: International survey and directions for future research,” European Journal of Operational Research, Vol. 98, 175-212.
Charnes, A., W.W. Cooper and E. Rhodes (1978), “Measuring the Efficiency of Decision Making Units,” European Journal of Operations Research, Vol. 2, 429-444.
Cheng, T.W., K.L. Wang and C.C. Weng (2000), “A Study of Technical Efficiencies of CPA Firms in Taiwan,” Review of Pacific Basin Financial Markets and Policies, Vol.3, No.1, 27-44.
Coelli, T.(1996), A Guide to DEAP Version 2.1: A Data Envelopment Analysis Computer Program, Center for Efficiency and Productivity Analysis, Australia.
re a
F&& ,R.,S. Grosskopf and C. A. K. Lovell(1985),The Measurement of Efficiency of
Production, Kluwer-Nijhoff, Boston.
Farrell, M.J. (1957), “The Measurement of Productive Efficiency,” Journal of the Royal Statistical Society, Series A, CXX, Part 3:253-290.
Greene, W. H. (1981), “On the Asymptotic Bias of the Ordinary Least Squares Estimator of the Tobit Model,” Econometrica, Vol.49, 505-513.
Lovell, C. A. K. (1993), “Production Frontiers and Productive Efficiency,” in The Measurement of Productive Efficiency: Techniques and Applications, edited by H. O. Fried, C. A. K. Lovell and S. S. Schmidt, Oxford University Press, New York, 3-67.
McCarty, T.A. and S. Yaisawarng(1993), “Technical Efficiency in New Jersey School Districts,” in The Measurement of Productive Efficiency: Techniques and Applications, edited by H. O. Fried, C. A. K. Lovell and S. S. Schmidt, Oxford University Press, New York, 271-87.
Seiford, L. M.(1996), “Data Envelopment Analysis: The Evolution of the State of the Art(1978-1995),” Journal of Productivity Analysis, Vol.7, 99-137.
Wang, K.L., Y.T. Tseng and C.C. Weng , (2003), “A Study of Production Efficiencies of Integrated Securities Firms in Taiwan,” Applied Financial Economics, Vol. 13,
159-167.
Weng, C.C. and K. L. Wang (2006), “Scale and Scope Economies of Futures Commission Merchants in Taiwan”, Working paper.
Zhang, W.D., Shuo Z. and Xueming L. (2006), “Technological progress, inefficiency, and productivity growth in the US securities industry, 19810-2000,” Journal of Business Research, Vol. 59, 589-594.