P R O C E E D I N G S
Open Access
TSCC: Two-Stage Combinatorial Clustering
for virtual screening using protein-ligand
interactions and physicochemical features
Daniel L Clinciu
1,4, Yen-Fu Chen
1, Cheng-Neng Ko
1, Chi-Chun Lo
4, Jinn-Moon Yang
1,2,3*From Asia Pacific Bioinformatics Network (APBioNet) Ninth International Conference on Bioinformatics
(InCoB2010)
Tokyo, Japan. 26-28 September 2010
Abstract
Background: The increasing numbers of 3D compounds and protein complexes stored in databases contribute greatly to current advances in biotechnology, being employed in several pharmaceutical and industrial
applications. However, screening and retrieving appropriate candidates as well as handling false positives presents a challenge for all post-screening analysis methods employed in retrieving therapeutic and industrial targets. Results: Using the TSCC method, virtually screened compounds were clustered based on their protein-ligand interactions, followed by structure clustering employing physicochemical features, to retrieve the final compounds. Based on the protein-ligand interaction profile (first stage), docked compounds can be clustered into groups with distinct binding interactions. Structure clustering (second stage) grouped similar compounds obtained from the first stage into clusters of similar structures; the lowest energy compound from each cluster being selected as a final candidate.
Conclusion: By representing interactions at the atomic-level and including measures of interaction strength, better descriptions of protein-ligand interactions and a more specific analysis of virtual screening was achieved. The two-stage clustering approach enhanced our post-screening analysis resulting in accurate performances in clustering, mining and visualizing compound candidates, thus, improving virtual screening enrichment.
Background
Continuous advancements in high-throughput X-ray crystallography and genomics [1,2] account for numer-ous available three-dimensional (3D) structures, enabling the development of new potential therapeutic and industrial targets. However, prospective ligands and pro-teins need to be screened in order to downsize groups [3-7] and select suitable candidates for post-screening analysis. Clustering methods based on structural similar-ity which are employed in post-screening analysis gener-ally improve the scoring function performance. In developing methods for 3D compound retrieval, a
detailed understanding of intermolecular interactions between proteins and their ligands is critical to struc-ture-based inhibitor design. Various post-screening ana-lysis methods clustering and [8-13] employ the root mean square deviation (RMSD), protein-ligand interac-tions and computation and comparison platforms for measuring distances. Since the above methods as well as TSCC encounter challenges of specific selectivity and false positives, we aim to provide advantages of our cluster analysis method to to enrich accuracy and effec-tively mine candidates for bioassay.
One of the above methods, a post-screening analysis for visualizing protein-ligand interaction (VISCANA) which analyzes the receptor and ligand pattern of inter-action on the basis of quantum theory is an approach proposed by Amari et al [12]. VISCANA applies the ab
* Correspondence: [email protected]
1
Institute of Bioinformatics and Systems Biology, National Chiao Tung University, 75 Bo Ai Street, Hsinchu, 30050, Taiwan
Full list of author information is available at the end of the article
© 2010 Clinciu et al; licensee BioMed Central Ltd. This is an open access article distributed under the terms of the Creative Commons Attribution License (http://creativecommons.org/licenses/by/2.0), which permits unrestricted use, distribution, and reproduction in any medium, provided the original work is properly cited.
initiofragment molecular orbital (FMO) method [14] to represent the interaction between a protein and its ligand. The FMO method has an advantage of describ-ing the charge-transfer between a receptor and a ligand in comparison to a conventional force field method using fixed atomic charges. However, it lacks sufficient descriptions of van der Waals forces and hydrogen bond interactions which play an important role in receptor-ligand binding and this may account for additional false positives.
Another method is NIPALSTREE, an approach by Bocker et al [13] for clustering large datasets in high dimensional space. It uses the first Principal Component which employs NIPALS (non-linear iterative least squares) where the data set is split at point i or j (deter-mined points where two neighbors exceed a predefined distance threshold T). Calibur [7] is a new tool designed for clustering very large numbers of protein decoys in ab initio protein structure prediction. Since various post-screening analysis methods deal with increasing number of decoys, it can be a useful tool as it can per-form the clustering in one third of the time required if its strategies are not used.
Our goal is to develop a cluster analysis for protein-ligand complexes using protein-protein-ligand molecular inter-actions. We employed the empirical energy function from GEMDOCK [15] and the basic premise of SIFt [16] to encode additional interaction-specific informa-tion into the real number strings, hydrogen bonds, van der Waal and electrostatic forces. By representing inter-actions at the atomic-level as opposed to the residue level and including measures of interactions strength, protein-ligand interactions can be described better and a more precise analysis of virtual screening can be obtained.
TSCC is accomplished by the joining of two clustering stages; one of protein-ligand interactions (e.g. hydrogen bonds, electrostatic interactions, and van der Waals forces) with another of physicochemical features per-formed on compounds selected through the first stage of clustering. We employed our docking tool, GEM-DOCK, to generate protein-ligand interactions and used the Accelrys Cerius QSAR module for obtaining physi-cochemical features of complexes. Based on normalized feature profiles, hierarchical and K-mean [17] clustering methods were used to cluster compound candidates. Since clustering based upon similarity requires a quanti-tative measure (descriptor) of the similarity between two molecules, 2D and 3D methods were used to generate a descriptor such as the atom pair descriptor (i.e. com-pound topological similarity) [18].
A cluster analysis for selecting candidates from a large number of database compounds requires prior screening techniques which must employ docking and screening
tools. To handle the vast results from virtual screening and use more specific information for protein-ligand bind-ing, we utilize the empirical energy function from GEM-DOCK specifically optimized for virtual screening. GEMDOCK used piecewise linear potential (PLP) that is a simple scoring function and is comparable to some scor-ing functions for estimatscor-ing bindscor-ing affinities [19-21]. Our previous works showed that GEMDOCK was compared to some docking methods on the 100 protein-ligand com-plexes and two virtual screening targets [4,22]. In addition, GEMDOCK has been successfully applied to identify inhi-bitors and binding sites for some targets [23-27]. Here, we currently utilized the PLP of GEMDOCK to generate the protein-ligand interaction profiles.
To demonstrate the efficiency of our method we suc-cessfully applied its combinatorial two-stage concept on five common targets by constructing two compound sets to screen against each target protein. The first com-pound set, a verifying dataset, was used to determine if the protein-ligand interaction descriptor is suitable for identifying compounds with similar binding modes. The second compound set, a testing dataset, was used to evaluate the database enrichment potential and the property of compounds in the same cluster by docking a diverse set of compounds spiked with known inhibi-tors into the same target protein as shown below.
Methods
The Two-Stage Combinatorial Clustering (TSCC) methodology
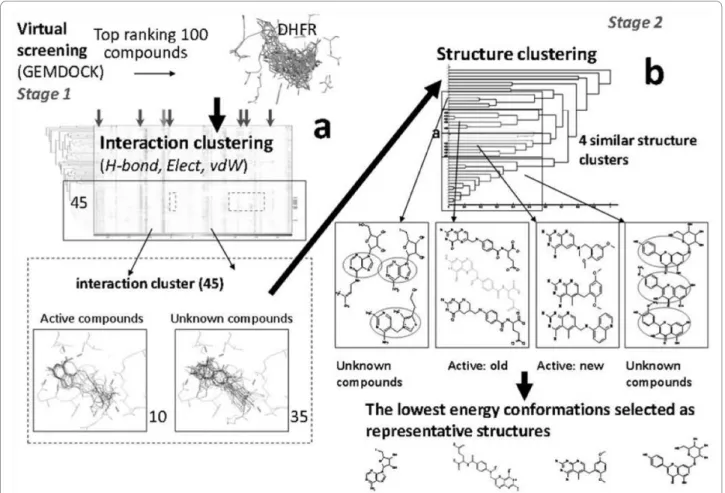
The overview of our method is shown in Figure1. We first calculated the atom-basedprotein-ligand interac-tions by converting every docked pose into a one dimensional real number string in order to visualize and analyze large data obtained from virtual screening using Yang et al [22]. Due to protein-ligand interactions representation, we were able to evaluate the distance of binding modes between two docked poses and to carry out hierarchical clustering analysis. Compounds with a similar binding mode were visualized and grouped into clusters [28]. In our structure based clustering section, each structure was represented by a one dimension atom-pair descriptor, an approach proposed by Carhart et al [18]. After analyzing the distance between active and non-active compounds, a reference threshold was decided for demarcating similar compounds (Fig.2).
We generated two sets of structure-based virtual screening results: 1) to verify if the protein-ligand inter-action descriptor is suitable for identifying compounds with similar binding mode and 2) to evaluate the data-base enrichment potential and the property of com-pounds in the same cluster by docking a diverse set of compounds spiked with known inhibitors into the same target protein.
Preparation of target protein and compound databases
We tested the virtual screening results against the five target proteins: 1) herpes simplex virus type 1 thymidine kinase (TK) [29] PDB identification (ID): lkim, 2) human estrogen receptor alpha (ERa) [22,30] PDB ID: 3ert, 3) human estrogen receptor alpha (ERa) PDB ID: lgwr, 4) human dihydrofolate reductase (hDHFR) [31,32] PDB ID: lhfr, and 5) tern n9 influenza virus neuramini-dase (NA) [33,34] PDB ID: lmwe.
The ligand binding site was defined as a collection of amino acids using a cutoff radius of 10Å from each atom on the bound ligand, since most studies in lead discovery use a cutoff radius between 8 to 12 Å. Structure files were stored as a PDB format for GEMDOCK input and analysis.
Compound databases
We constructed two compound sets for screening against each target protein. The compound sets for NA of influ-enza virus were derived from the Comprehensive Medical Chemistry database (CMC) and only those with molecular weights between 200 and 800 were chosen. All active com-pounds (61 total) were listed as the following: 1) TK: 10, 2)
ERa antagonists: 11, 3) ERa agonists: 10, 4) hDHFR: 10, and 5) NA: 20. The two crystal structures of human estro-gen receptors alpha have been intensively studied for their different functions (agonist 1GWR promotes coactivator binding while antagonist 3ERT blocks it) and ability to bind on the same site of the protein. The agonists play an important role in regulation of gene expression and pre-vention of osteoporosis while the antagonists have been used as treatment of hormone-dependent breast cancer [22,30].
The tested dataset contained 990 randomly selected compounds combined with known active compounds for each target protein using a method from Bissantz et al [35]. The 990 compounds is a small scale public set of compounds used by various studies to test meth-ods of lead discovery. All compound structures were converted to mol formats and their hydrogen atoms removed using CORINA3.0 for GEMDOCK input and VS. The active compound set of each target protein, tar-get proteins, and 990 random compounds are available on the Web at http://gemdock.life.nctu.edu.tw/dock/ download.php.
Figure 1 Overall process of the Two-Stage Combinatorial Cluster Analysis. (a) First stage clustering using protein-ligand interactions generated via GEMDOCK. (b) Second stage clustering of first stage results done using physicochemical features.
Preparation of virtual screening results for cluster analysis
GEMDOCK was substantially modified, in preparation for docked poses and to predict the binding affinity for each compound in the dataset via two key functions: 1) The searching algorithm and 2) The scoring function which is based on an empirical energy function (it con-sists of a simple empirical binding score and a pharma-cophore-based score with all details of the scoring function found in Additional File 1).
Testing and Verifying Datasets
The lowest energy conformation was retained for gener-ating the representative docked pose of each compound.
Generation of Descriptors (Protein-Ligand interaction descriptors)
We converted 3D docked poses into a one dimension real number string by calculating the energy between each atom present on protein and ligand. The interac-tion energy of each atom j on a protein is defined as:
E F r q q r j ij Bij i j ij i lig = ⎡
( )
+ ⎣ ⎢ ⎢ ⎤ ⎦ ⎥ ⎥ =∑
332 0 4 2 1 . (1)Where rijBij is the distance between atoms i and j with interaction type Bij formed by pair-wise heavy
atoms between ligands and proteins, Bij is either a
hydrogen bond or a steric state. These two potentials are calculated by the same function, although from dif-ferent parameters; V1, . . ., V6. qi and qjare the formal
charges and 332.0 is a factor that converts the electro-static energy into kilocalories per mole. The lig and pro denote the number of heavy atoms on the ligand.
F r
( )
ijBij is a simple atomic pair-wise potentialfunction.
Atom pair descriptors
Atom-pair descriptors are 2D topological descriptors counting the distance between twoatoms as the shortest path of bonds [18]. The procedure for preparing atom pair descriptors:
1) Structure files in mol format 2) Remove hydrogen atoms
3) Convert to mol2 format via CORINA3.0
4) Calculate atom pair descriptors via AP generator (distance bins: 15)
5) Store in binary coding form.
Figure 2 Designing a reference threshold of P-L interaction and atom-pair descriptors. The complementation between atom-pair descriptor and the protein-ligand interaction descriptor is also show in this figure. The distance threshold of atom-pair descriptor was 0.55 (tanimoto coefficient). The threshold of distance of protein-ligand interaction descriptor was 0.39 (correlation coefficient).
A total of 825 (55 x 15) atom pair descriptors were generated for each molecular structure by removing all columns with zero values.
Reference Threshold for Protein-Ligand Interaction and Atom-Pair Descriptor
To design a reference threshold of protein-ligand inter-action, a verifying dataset was used in establishing a reference threshold of distance by determining a maxi-mum discrimination between similar and non-similar binding modes. The equation is as follows:
max C C C C d t d t intra intra inter inter − < + − > ⎛ ⎝ ⎜ ⎞ ⎠ ⎟ ⎛ ⎝ ⎜⎜ / 2⎞⎠⎟⎟ (2) Where t is the reference threshold, Cintra-d<t is the
number of intra active compound pairs with the dis-tance < threshold and Cinter is the number of compound
pairs between active and non-active compounds.
The Cluster Analysis Method
First, we used a protein-ligand interaction descriptor for clustering compounds with similar binding modes and applied the correlation coefficients as similarity mea-surements. The following formula was used:
D X X Y Y n S S xycorr i i n i x y = − −
(
)
(
−)
−(
)
=∑
1 1 1 (3)where Dxycorr is the correlation distance between docked pose X and Y. Sxis the standard deviation of X.
Xiis the ith value of X. n is the number of descriptors.
We applied the standard UPGMA clustering method for calculating the distance between two clusters while con-structing the dendrogram. The formula is defined as:
D n n D rsclu r s risjcorr j n i nr s = = =
∑
∑
1 1 1 (4)The reference threshold was calculated from the veri-fying dataset using equation (2) to determine the num-ber of clusters.
Second, we applied the AP descriptor for clustering compounds within each clustering stage and applied the tanimoto coefficients as similarity measurements. For-mula is as follows: D X Y X Y xytani= (5)
where Dxytani is the tanimoto distance between X and
Y. |X⋂Y| is the number of ON bits common in both X and Y, and the |X⋃Y| is the number of ON bits present in either X or Y. This equation is similar to equation (4); Dxycorr by Dxytani. The dendrogram graph was plotted
for visualizing the binding mode of multi docked poses by the protein-ligand interactions.
Results
Molecular Recognition Thymidine kinase
Choosing the crystal coordinates of TK (Fig. S1 in Addi-tional File 2) in complex with its natural substrate (deoxythymidine) was reasonable since the active site can accommodate a broad variety of ligands. The aver-age RMSD of all ten docked poses was 1.39 Å. (Table 1)
Estrogen receptora
Table 1 The RMSD values between docked poses and crystal ligands of 48 compounds for the five targets
TK (lkim) ER (3ert, lgwr) DHFR (lhfr) NA(lmwe)
Complex RMSD Complex RMSD Complex RMSD Complex RMSD
name (Å) name (Å) name (Å) name (Å)
le2k.TMC 0.69 1err.RALa 1.27 lboz.PRD 1.13 1l7f_ BCZ 0.88
le2m.HPT 0.51 3ert.
OHTa 0.71 1dlrMXA 0.62 lnnc_GNA 0.75
le2n.RCA 1.34 1hj1. AOEa
3.13 1dls.MTX 1.53 2qwf_G20 0.60
le2p.CCV 0.67 1uom.
PTIa 0.81 1drf.FOL 1.24 1bji_G21 0.81
1ki2.GA2 3.04 1gwr.
ESTb 0.71 1hfr.MOT 0.51 1f8b_DAN 0.64
lki3.PE2 3.21 112i.ETCb 0.52 1kms.LIH 1.36 1f8c_4AM 0.46
1ki6.AHU 0.37 1qkm. GENb
2.92 1kmv.LII 0.83 1f8d_9AM 0.59
1ki7.ID2 0.49 3erd.
DESb 1.32 1mvs.DTM 0.75 1f8e_49A 0.60
lkim.THM 0.41 1ohj.COP 1.27 1ina_ST6 0.79
2ki5.AC2 3.14 2dhf.DZF 1.12 ling_ST5 1.03 1inw_AXP 0.93 1inx_EQP 0.92 1ivc_ST2 2.09 1ivd_ST1 1.02 1ive_ST3 1.03 Imwe_SIA 0.52 lxoe_ABX 1.33 lxog_ABW 2.42 2qwg_G28 0.80 2qwh_G39 0.74
Average 1.39 Average 1.42 Average 1.03 Average 0.95
a
Four antagonists docked into the target protein (3ert)
b
The target protein structures of ERa (Figs. S2 and S3 in Additional Files 3 and 4) were obtained from PDB, whereas antagonists and agonists were derived from pre-vious works. We docked four antagonists into the target protein (3ert) and four agonists into another one (1gwr), and concluded their results based on RMSD in the heavy atoms ligand between the docked pose and the crystal structure. The average RMSD of docked antago-nists and agoantago-nists was 1.42 Å. The RMSD values of 1hj1.AOE and 1qkm.GEN were larger than 2.0 Å because the native proteins were crystal structures of ER a-ligand complexes. (Table 1)
Human dihydrofolate reductase
To evaluate the docking accuracy of GEMDOCK, we docked 10 known active compounds (Fig. S4 in Addi-tional File 5) into the target protein and compared the RMSD values between the docked pose and the bound ligand in crystal structure. The average RMSD of all ten docked active compounds was 1.03 Å, substantially lower than 2 Å, which means GEMDOCK computations were within the range of accepted accurate values.
Neuraminidase
The 20 known active compounds (Fig. S5 in Additional File 6 were docked into the target protein and an aver-age RMSD of 0.95 Å was obtained for all docked poses. (Table 1)
Significance of protein-ligand interaction descriptor on the verifying dataset
Significance of known compounds in the five classes
the results are listed in Table 2 using T-scores as the standard two sample t-test statistics (Additional File 1). Using equation 2, the maximum discrimination was determined (Fig. 2) with 88.89% accuracy in distinguish-ing between similar and non-similar binddistinguish-ing modes.
Significance of similar compounds
For the purpose of post-analysis, we tested similar com-pounds’ docking behavior (pose, interaction) on a pro-tein receptor. There are five classes of similar
compounds on each target protein. We tested to see whether the mean distance between similar compounds represented by protein-ligand interactions is different than the mean distance between non-similar compounds (t-test results listed in Table 3).
Significance of an atom pair descriptor
Similar structures were defined as active compounds and non-similar structures were defined as non-active compounds (t-test results, Table 4). Active compounds of hDHFR and NA were divided into two classes because of their diverse compound structures (Figures S2 and S3 - Additional Files 3 and 4). The maximum discrimination between similar and non-similar struc-tures was determined by distinguishing between similar and non-similar structures with 91.45% accuracy.
Calculating a reference threshold by verifying dataset
Using a verifying dataset, we calculated the distance threshold (correlation coefficient: 0.39) that had the maximum discrimination. The reference threshold of atom-pair (Tanimoto coefficient: 0.55 in Fig. 2) was cal-culated via 7 classes of structures showing the comple-ment between atom-pair descriptor and protein-ligand interaction descriptor.
Protein-ligand interaction clustering
Cluster analysis of human dihydrofolate reductase molecular docking
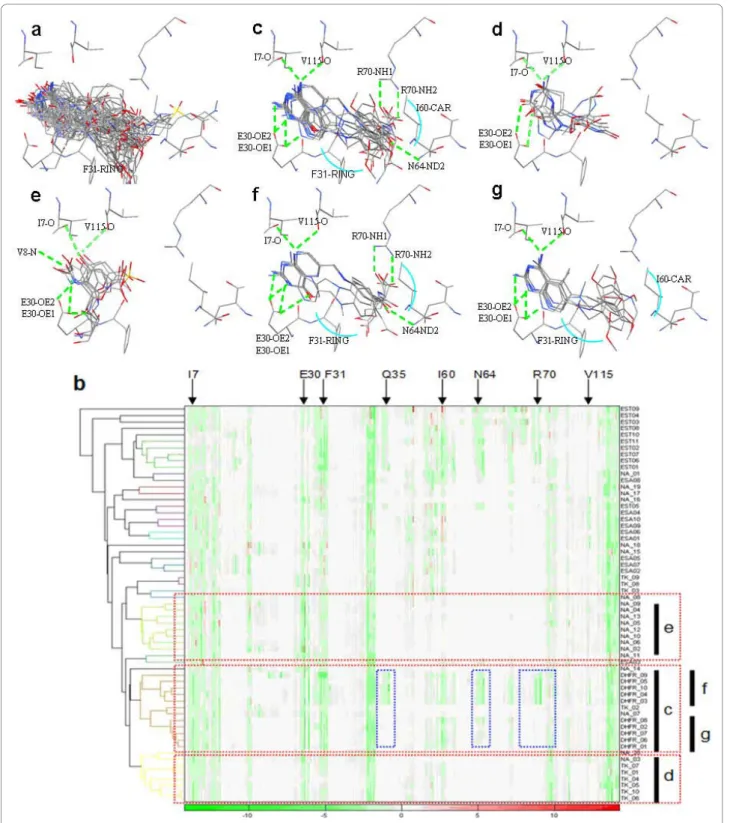
The overlays of all 61 docked poses of known active compounds in the vicinity of the target protein hDHFR are shown in Figure 3a. Using the reference threshold of protein-ligand interaction (correlation coefficient: 0.39), three major clusters can be identified in Figure 3b, clus-ters c, d and e. Each cluster has interaction details dis-played above (e.g. cluster c with fig. c). All active compounds were grouped together (Fig. 3c). The hDHFR ligands in cluster c had hydrogen bonds (E30-OE1, E30-OE2, V115-0, I7-0 in green dotted lines) and van der Waals forces shown by a blue arc (I60-CAR, F31-RING) revealing that binding interactions of each
Table 2 T-test of distance between intra-cluster and inter-cluster compound binding modes generated by converting the docked pose into protein-ligand interaction profile (a=0.01)
Target protein
H0 Average distance of
intra-cluster compounds (Å)
Average distance of inter-cluster compounds (Å) Stdaof distance of intra-cluster compounds Stdaof distance of inter-cluster compounds p-value DHFR Reject 0.21 0.50 0.09 0.13 1.71E-58
ESA Reject 0.25 0.42 0.13 0.12
7.04E-20
EST Reject 0.31 0.48 0.09 0.12
7.94E-39 NA Reject 0.17 0.73 0.07 0.20 0.00E +00 TK Reject 0.19 0.47 0.08 0.15 3.89E-64 a Standard Deviation
docked pose within cluster c were similar. Cluster d contained 6 TK ligands and one NA ligand and cluster e had only NA ligands, as seen in Figure 3e. Docked poses within both clusters d and e had hydrogen bond-ing (V115,I7-0; E30-OE1, V8-N).
When comparing the binding interaction between clusters in Figures 3c, d, e, f, and g we noted that our method could cluster docked compound poses into dis-tinct clusters revealing specific binding interactions and important protein-ligand interactions.
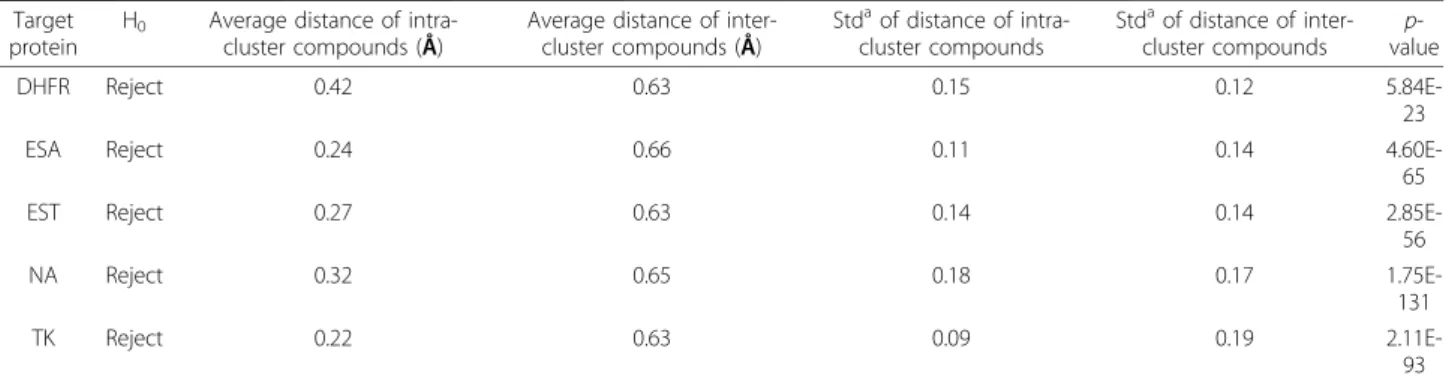
Table 3 T-test of distance between intra-cluster and inter-cluster compound structures gener-ated by atom-pair representation (a=0.01)
Target protein
H0 Average distance of
intra-cluster compounds (Å)
Average distance of inter-cluster compounds (Å) Stdaof distance of intra-cluster compounds Stdaof distance of inter-cluster compounds p-value DHFR Reject 0.42 0.63 0.15 0.12 5.84E-23
ESA Reject 0.24 0.66 0.11 0.14
4.60E-65
EST Reject 0.27 0.63 0.14 0.14
2.85E-56 NA Reject 0.32 0.65 0.18 0.17 1.75E-131 TK Reject 0.22 0.63 0.09 0.19 2.11E-93 a Standard deviation
Table 4 T-test of distance between intra-cluster and inter-cluster compounds on each target protein. Descriptor was generated by converting the docked pose into protein-ligand in-teraction profile (a=0.01)
Target protein
Compound class
H0 Average distance of
intra-cluster compounds (Å)
Average distance of inter-cluster compounds (Å) Stdaof distance of intra-cluster compounds Stdaof distance of inter-cluster compounds p-value DHFR Reject 0.21 0.50 0.09 0.13 1.71E-58
ESA Reject 0.52 0.58 0.18 0.12 2.73E-03
DHFR EST Reject 0.52 0.63 0.21 0.13 7.51E-07
NA Reject 0.46 0.55 0.13 0.14 5.34E-23
TK Reject 0.38 0.51 0.16 0.13 8.03E-11
DHFR Pass 0.55 0.62 0.28 0.16 0.10111
ESA Reject 0.23 0.48 0.14 0.14 2.29E-31
ESA EST Pass 0.67 0.76 0.25 0.14 0.23105
NA Reject 0.33 0.59 0.24 0.20 1.51E-58
TK Reject 0.46 0.57 0.25 0.20 0.000121
DHFR Pass 0.55 0.57 0.21 0.14 4.01E-01
ESA Reject 0.25 0.42 0.13 0.12 7.04E-20
EST EST Reject 0.31 0.48 0.09 0.12 7.94E-39
NA Reject 0.40 0.46 0.15 0.15 1.46E-09
TK Reject 0.28 0.43 0.09 0.15 2.17E-29
DHFR Reject 0.35 0.68 0.22 0.25 3.46E-25
ESA Reject 0.59 0.71 0.28 0.24 2.91E-04
NA EST Reject 0.56 0.66 0.25 0.24 2.46E-04
NA Reject 0.17 0.73 0.07 0.20 0.00E
+00
TK Reject 0.48 0.60 0.18 0.23 3.46E-07
DHFR Reject 0.42 0.62 0.13 0.10 9.80E-12
ESA Reject 0.16 0.52 0.07 0.13 9.99E-62
TK EST Pass 0.58 0.65 0.18 0.14 6.28E-02
NA Reject 0.40 0.53 0.11 0.15 2.92E-53
TK Reject 0.19 0.47 0.08 0.15 3.89E-64
a
Figure 3 Cluster analysis of hDHFR. (a) Overlay of all 61 docked poses of known active compounds in the vicinity of the target protein hDHFR (PDB code: lhfr). (b) The dendrogram and hierarchical clustering results of 61 docked poses of hDHFR. Each cluster has its interaction details in the figures above (e.g. cluster c in fig c). Docked poses in the heat map are rearranged according to the order given by hierarchical clustering marked by the black bar‘c’ in the right side of the heat map. The amino acids identified for description are shown in the top side of the heat map. (c, d, e) Overlay of the known active compounds and their important interactions, (f, g) Docked poses overlay of the sub-cluster within hDHFR active compounds. The differences of clusters f and g are shown by blue frames in the heat map.
Cluster analysis of molecular docking on thymidine kinase
After filtering out clustered compounds, 53 docked poses were obtained including the 10 docked poses of active compounds and a total of 305 atoms were identi-fied here. (Fig. S6 in Additional File 7)
Clustering by atom-pair descriptor
Cluster analysis of compound structures for the verifying dataset
Observing these three clusters, we deduced the atom-pair descriptor could group compounds with similar structures and sorts them from those with different structures (Fig. 4).
Cluster analysis of virtual screening results on the testing dataset
Analysis of the hDHFR dataset (first and second stages)
1ststage:We performed virtual screening for a set of 10 hDHFR inhibitors all spiked into 990 randomly selected compounds from ACD. A total of 476 involved atoms were identified in 100 docked poses that include 10 known active compounds. P-L interactions of all com-plexes were generated, each complex being composed of 316 real numbers. All hDHFR inhibitors were grouped together into one cluster. In Figure 5a indicated by red arrows are: F31-stacking forces, 160-van der Waals forces and NAP-stacking forces. Figures 5b and 5c shows similar hydrogen bonding (I7-O, V115-O, E30-OE1, E30-OE2, and N64-ND2) for the target protein
and the 35 unknown compounds, however, the old drug (Fig. 5c) contains additional hydrogen bonds (R70-NH1, R70-NH2, and N64-ND2). We also identified and pointed out important forces on the heat map using red arrows (I60-van der Waals forces, F31-stacking forces, F34-stacking forces, NAP-stacking forces) Residues within old and new drug structures (Fig. 5a and b) are shown in yellow and the dendrogram in Figure 3b shows the exact split of these two compounds. We uti-lized 2D topology to select representative compounds within a cluster after protein-ligand interaction analysis was performed and representatives were then selected within each sub-cluster.
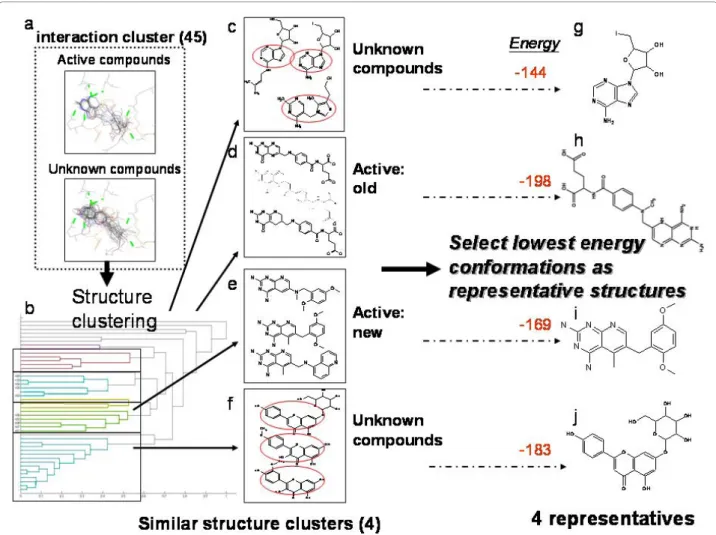
2ndStage:The cluster contained 45 compounds: 10 active compounds and 35 unknown compounds (Fig. 6a). A one dimension atom-pair binary string of 2D topology represented each compound. After perform-ing hierarchical clusterperform-ing four major clusters were identified by the dendrogram (Fig. 6b). The active compounds were spliced into two clusters; the old drugs (Fig. 6d) and the new drugs (Fig. 6e) due to the differences in carboxylic acid groups.The sub-struc-tures within each cluster inside the red circles (Figs. 6c and f) showed similar compounds within a cluster and only the lowest energy compound from each cluster was selected as a final representative (Figs. 6g, h, i and j). At this stage the selected candidates could be further verified by bioassays for specific function and application.
Figure 4 The dendrogram of hierarchical clustering of 61 known compound structures with three major clusters. (a) 10 ERa agonists, (b) 11 ERa antagonists, (c) 10 TK and 14 NA inhibitors were grouped into one cluster due to their structure similarity. The descriptor was calculated using the tanimoto coefficient (0.55) via atom-pair representation. It grouped only compounds with similar structures, sorting them out from those with different structures.
Discussion
In search of an improved post-screening analysis for protein-ligand complexes we developed a combinatorial cluster analysis aided by two clustering stages to mine and visualize compound candidates generated by VS. Five classes of targets and two different data sets were used to validate this method. In its first clustering stage, our method encodes more interaction-specific informa-tion than other methods into the real number string, hydrogen bond, van der Waal and electrostatic forces which are important in receptor-ligand binding incre-asing the efficiency of protein-ligand interaction clus-tering. Through second-stage clustering, using physicochemical features as criterion for further screen-ing, final representatives were retrieved from each clus-ter containing compounds from first-stage clusclus-tering.
Another post-screening analysis method VISCANA, uses protein-ligand interactions as a means for cluster-ing but lacks sufficient descriptions of van der Waals forces and hydrogen bond interactions which play an important role in receptor-ligand binding. In addition, its lack of using a specifically optimized docking tool for protein-ligand interactions during virtual screening may undermine the accuracy of final representatives as well.
Our goal was to develop a method for selecting ade-quate representative compounds from a 3D database that can be used in therapeutic or industrial applica-tions. Such compounds can be further confirmed through bioassays to verify our method’s accuracy and the proper activity and application of these final candi-dates. This study provides a suggestion of cluster thresh-old while aiding the retrieval of more specific representative structures from a large number of virtual screening data. Furthermore, an overall index criterion to evaluate the accuracy of our clustering method can be done in future studies to enable its comparison with other post-screening analysis methods and thoroughly investigate screening and retrieving advantages and dis-advantages of different methods. In future works we hope to extend our TSCC study into the integration or conjunction of our TSCC method with Calibur [6] and NeatMap [3] for the possibility of improving accuracy and specificity in selecting final representatives.
Conclusions
We showed that by combining interaction clustering with compound structure clustering an enhanced cluster analysis is obtained during the retrieval of final
Figure 5 The detail of hDHFR binding interactions of new drugs and old drugs on the verifying dataset. (a) Important forces (red arrows) on the heat map (160-van der Waals force, F31-stacking force, F34-stacking force, NAP-stacking force); (b), (c) The binding interactions of new and old drugs and their residues (yellow). The old drug (c) has additional hydrogen bonding with the target protein (Q35, N64, and R70). Interactions of residues (Q35, N64, and R70) are seen in (b) while (N64 and R70) interactions are seen in (c).
representatives for the five selected targets in this study, simultaneously improving VS enrichment. The overall performance of TSCC revealed that sufficient descrip-tions of protein-ligand interacdescrip-tions are an important step when mining for ideal protein-ligand complexes. Although comparison to other cluster analysis methods can be somewhat ambiguous since different approaches may vary in goals and purpose, the combination of an optimized docking tool and two clustering stages for the scope of selecting ideal representatives revealed promis-ing results in our study.
Additional material
Additional File 1: GEMDOCK scoring function.
Additional File 2: Figure S1. Ten TK (thymidine kinase) active compound structures.
Additional File 3: Figure S2. Eleven ERa (estrogen receptor) antagonist structures.
Additional File 4: Figure S3. Ten ERa (estrogen receptor) agonist structures.
Additional File 5: Figure S4. Ten hDHFR (human dihydrofolate reductase) active compound structures
Additional File 6: Figure S5. Twenty NA (neuraminidase) active compound structures
Additional File 7: Figure S6. Views of docked structures of known active compounds in the vicinity of the target protein TK and hierarchical clustering of protein-ligand interactions.
Acknowledgements
J.M. Yang was supported by the National Science Council and partially supported by the ATU plan of MOE. Authors are grateful to both the hardware and software supports of the Structural Bioinformatics Core Facility at National Chiao Tung University.
Figure 6 The process and results of second stage cluster analysis on hDHFR testing dataset. (a) The binding interactions of the largest cluster generated from first stage clustering: 45 compounds include the 10 active compounds and 35 unknown compounds, (b) The result of hierarchical clustering: there were four major clusters identified by the dendrogram (c, d, e, f). The active compounds were spliced into two clusters: (d) the old drugs and (e) the new drugs due to the difference in carboxylic acid groups. The sub-structures from clusters within the red circles in (c) and (f) had similar compounds and the lowest energy compound within each cluster was selected as a final representative (g), (h), (i) and (j).
This article has been published as part of BMC Genomics Volume 11 Supplement 4, 2010: Ninth International Conference on Bioinformatics (InCoB2010): Computational Biology. The full contents of the supplement are available online at http://www.biomedcentral.com/1471-2164/11?issue=S4. Author details
1
Institute of Bioinformatics and Systems Biology, National Chiao Tung University, 75 Bo Ai Street, Hsinchu, 30050, Taiwan.2Department of
Biological Science and Technology, National Chiao Tung University, 75 Bo Ai Street, Hsinchu, 30050, Taiwan.3Core Facility for Structural Bioinformatics,
National Chiao Tung University, 75 Bo Ai Street, Hsinchu, 30050, Taiwan.
4Institute of Information Management, National Chiao Tung University, 1001
University Road, Hsinchu, 30010, Taiwan. Authors’ contribution
DLC has helped develop, test and implement the steps of this study, organized the entire manuscript. YFC conducted the experiments, analyzed protein docking interfaces and helped to draft the manuscript. CNK developed programs for computing the clustering results and analyzed protein docking interfaces. JMY designed, coordinated and conceived the study, and helped to draft the manuscript. CCL helped with design this study. All authors read and approved the final manuscript.
Competing interests
The authors declare that they have no competing interests. Published: 2 December 2010
References
1. Blundell TL, Jhoti H, Abell C: High-throughput crystallography for lead discovery in drug design. Nature Reviews Drug Discovery 2002, 1(1):45-54. 2. Nuzzo A, Riva A: Genephony: a knowledge management tool for
genome-wide research. Bmc Bioinformatics 2009, 10.
3. Rajaram S, Oono Y: NeatMap–non-clustering heat map alternatives in R. BMC Bioinformatics 2010, 11.
4. Yang J-M, Chen C-C: GEMDOCK: a generic evolutionary method for molecular docking. Proteins: Structure, Function, and Bioinformatics 2004, 55:288-304.
5. Stahl M, Schulz-Gasch T: Practical database screening with docking tools. Ernst Schering Res Found Workshop 2003, 42:24.
6. Venkatraman V, Yang YFD, Sael L, Kihara D: Protein-protein docking using region-based 3D Zernike descriptors. Bmc Bioinformatics 2009, 10. 7. Li SC, Ng YK: Calibur: a tool for clustering large numbers of protein
decoys. Bmc Bioinformatics 2010, 11.
8. Gehlhaar DK, Verkhivker GM, Rejto P, Sherman CJ, Fogel DB, Fogel LJ, Freer ST: Molecular recognition of the inhibitor AG-1343 by HIV-1 protease: conformationally flexible docking by evolutionary programming. Chemistry & Biology 1995, 2:317-324.
9. Matter H: Selecting optimally diverse compounds from structure databases: A validation study of two-dimensional and three-dimensional molecular descriptors. Journal of Medicinal Chemistry 1997, 40(8):1219-1229. 10. Ruvinsky AM: Role of binding entropy in the refinement of
protein-ligand docking predictions: Analysis based on the use of 11 scoring functions. Journal of Computational Chemistry 2007, 28(8):1364-1372. 11. Liu Q, Olman V, Liu HQ, Ye XZ, Qiu SL, Xu Y: An integrated tool for RNA
secondary structure comparison and clustering. Journal of Computational Chemistry 2008, 29(9):1517-1526.
12. Amari S, Aizawa M, Zhang J, Fukuzawa K, Mochizuki Y, Iwasawa Y, Nakata K, Chuman H, Nakano T: VISCANA: visualized cluster analysis of protein-ligand interaction based on the ab initio fragment molecular orbital method for virtual ligand screening. Journal of Chemical Information and Modeling 2006, 46(1):221-230.
13. Bocker A, Schneider G, Teckentrup A: NIPALSTREE: A new hierarchical clustering approach for large compound libraries and its application to virtual screening. Journal of Chemical Information and Modeling 2006, 46(6):2220-2229.
14. Nakano T, Kaminuma T, Sato T, Fukuzawa K, Akiyama Y, Uebayasi M, Kitaura K: Fragment molecular orbital method: use of approximate electrostatic potential. Chemical Physics Letters 2002, 351(5-6):475-480.
15. Yang JM, Chen CC: GEMDOCK: A generic evolutionary method for molecular docking. Proteins-Structure Function and Bioinformatics 2004, 55(2):288-304.
16. Deng Z, Chuaqui C, Singh J: Structural interaction fingerprint (SIFt): A novel method for analyzing three-dimensional protein-ligand binding interactions. J Med Chem 2004, 47:337-344.
17. Zheng WF, Tropsha A: Novel variable selection quantitative structure-property relationship approach based on the k-nearest-neighbor principle. Journal of Chemical Information and Computer Sciences 2000, 40(1):185-194.
18. Carhart RE, Smith DH, Venkataraghavan R: Atom pairs as molecular features in structure-activity studies: definition and applications. Journal of Chemical Information and Computer Sciences 1985, 25:64-73.
19. Wang R, Lu Y, Wang S: Comparative evaluation of 11 scoring functions for molecular docking. J Med Chem 2003, 46(12):2287-2303.
20. Thomsen R, Christensen MH: MolDock: a new technique for high-accuracy molecular docking. J Med Chem 2006, 49(11):3315-3321.
21. Yang JM, Chen YF, Shen TW, Kristal BS, Hsu DF: Consensus scoring criteria for improving enrichment in virtual screening. J Chem Inf Model 2005, 45(4):1134-1146.
22. Yang J-M, Shen T-W: A pharmacophore-based evolutionary approach for screening selective estrogen receptor modulators. Proteins: Structure, Function, and Bioinformatics 2005, 59:205-220.
23. Yang JM, Chen YF, Tu YY, Yen KR, Yang YL: Combinatorial computational approaches to identify tetracycline derivatives as flavivirus inhibitors. PLoS ONE 2007, 2(5):e428.
24. Chin KH, Lee YC, Tu ZL, Chen CH, Tseng YH, Yang JM, Ryan RP, McCarthy Y, Dow JM, Wang AH, et al: The cAMP receptor-like protein CLP is a novel c-di-GMP receptor linking cell-cell signaling to virulence gene expression in Xanthomonas campestris. J Mol Biol 2010, 396(3):646-662. 25. Hung HC, Tseng CP, Yang JM, Ju YW, Tseng SN, Chen YF, Chao YS,
Hsieh HP, Shih SR, Hsu JT: Aurintricarboxylic acid inhibits influenza virus neuraminidase. Antiviral Res 2009, 81(2):123-131.
26. Yang M-C, Guan H-H, Yang J-M, Ko C-N, Liu M-Y, Lin Y-H, Chen C-J, Mao SJT: Rational design for crystallization of beta-lactoglobulin and vitamin D-3 complex: revealing a secondary binding site. Crystal Growth & Design 2008, 8:4268-4276.
27. Fidelis K, Stern P, Bacon D, Moult J: Comparison of systematic search and database methods for constructing segments of protein structure. Protein Engineering 1994, 7:953-960.
28. Dubes R, Jain AK: Clustering methodologies in exploratory data analysis. Adv Comput 1980, 19:113-228.
29. Champness JN, Bennett MS, Wien F, Visse R, Summers WC, Herdewijn P, de Clerq E, Ostrowski T, Jarvest RL, Sanderson MR: Exploring the active site of herpes simplex virus type-1 thymidine kinase by X-ray crystallography of complexes with aciclovir and other ligands. Proteins 1998, 32:350-361. 30. Gluck O, Maricic M: Raloxifene: Recent information on skeletal and
non-skeletal effects. Current Opinion in Rheumatology 2002, 14(4):429-432. 31. Cody : Comparison of ternary crystal complexes of F31 variants of
human dihydrofolate reductase with NADPH and a classical antitumor furopyrimidine. Anti-cancer Drug Design 1998, 13(4):8.
32. Wyss PC, Gerber P, Hartman PG, Hubschwerlen C, Locher H, Marty HP, Stahl M: Novel dihydrofolate reductase inhibitors. Structure-based versus diversity-based library design and high-throughput synthesis and screening. J Med Chem 2003, 46:2304-2312.
33. Verma RP, Hansch C: QSAR study on influenza neuraminidase inhibitors. Bioorganic & Medicinal Chemistry 2006, 14(4):982-996.
34. Birch L, Murray CW, Hartshorn MJ, Tickle IJ, Verdonk ML: Sensitivity of molecular docking to induced fit effects in influenza virus neuraminidase. Journal of Computer-Aided Molecular Design 2002, 16(12):855-869.
35. Bissantz C, Folkers G, Rognan D: Protein-based virtual screening of chemical databases. 1. Evaluation of different docking/scoring combinations. Journal of Medicinal Chemistry 2000, 43(25):4759-4767. doi:10.1186/1471-2164-11-S4-S26
Cite this article as: Clinciu et al.: TSCC: Two-Stage Combinatorial Clustering for virtual screening using protein-ligand interactions and physicochemical features. BMC Genomics 2010 11(Suppl 4):S26.