INTRODUCTION
The scales of population structure in marine species usually depend on the extent to which larvae from dif-ferent populations are mixed in plankton. Larvae may drift in the plankton for weeks or months, resulting in a relatively high connectivity among populations (Shanks et al. 2003). In theory, larvae released from a given location can mix well with the larvae released from populations elsewhere by diffusing over a large area and can thus prevent genetic structuring of popu-lations (Gaylord & Gaines 2000). However, the dynam-ics of larval dispersal may show high stochasticity in time and space owing to the limited mixing of larvae
from distinct sources (Gaines et al. 2003, Siegel et al. 2003), patchy environmental selection in the plankton (Gaines & Bertness 1992, Ellien et al. 2004) or ‘sweep-stakes’ reproductive success resulting from small ef-fective population sizes (Hedgecock 1994a,b). The spa-tial restriction on gene flow can be described by the island, stepping-stone or isolation by distance (IBD) models (Rousset 1997). In addition to the population structure in space, many populations comprise a mix-ture of individuals that reproduce at different times within a reproductive season (reviewed in Hendry & Day 2005). The heritable reproductive time is thought to contribute to this temporal restriction on gene flow between early and late reproducers, thus creating a
© Inter-Research 2010 · www.int-res.com *Email: [email protected]
Population genetic structure of the Japanese eel
Anguilla japonica: panmixia at spatial and
temporal scales
Yu-San Han
1, 2,*, Chia-Ling Hung
2, Yi-Fen Liao
2, Wann-Nian Tzeng
1, 21Department of Life Science and 2Institute of Fisheries Science, College of Life Science, National Taiwan University,
Taipei 106, Taiwan
ABSTRACT: Since the 1970s, the population of the Japanese eel Anguilla japonica has dramatically declined in East Asia. Consequently, conservation and resource management of this species are urgently required. However, the population genetic structure of this species, in temporal and spatial scales, is still poorly understood. We used 8 polymorphic microsatellite DNA loci to investigate its genetic composition. For cohort analysis, juvenile (glass) eels were collected yearly between 1986 and 2007 from the Danshui River, Taiwan; for arrival wave analysis, glass eels were collected monthly from Fulong Estuary, Taiwan; and for spatial analysis, glass eels were collected from Taiwan, China, Korea and Japan. Genetic differentiation among annual cohorts, arrival waves and spatial samples was very low; a significant difference was observed among annual cohorts and spatial samples, but not among arrival waves. However, specific temporal or spatial scale patterns were not seen in either pairwise genetic comparisons or the phylogenetic tree of all samples. Occasional genetic variations among samples occurred randomly, but a stable lasting genetic structure could not be formed. The isolation by distance (IBD) test showed no evidence of genetic structuring at the spatial scale, and the results of the isolation by time (IBT) test were insignificant among arrival waves. Genetic heterogeneity over a 21 yr time scale showed marginal significance, potentially reflecting a genetic drift in the Japanese eel. Our results suggest the existence of a single panmictic population of Japanese eel in East Asia. Therefore, the Japanese eel should be considered as a single management unit for conservation. KEY WORDS: Genetic differentiation · Japanese eel · Anguilla japonica · Microsatellite DNA · Panmixia · Isolation by time · IBT · Isolation by distance · IBD
pattern of isolation by time (IBT) (Hendry & Day 2005). To understand the population genetic structure of some species, the spatial and temporal components across populations should be considered simultaneously.
The Japanese eel Anguilla japonica is a temperate catadromous fish with a long migratory loop and lengthy leptocephalus stage. The spawning area of this species is presumed to be in the western Mariana Islands near 14°–16° N, 142° E (Tsukamoto 1992, 2006), 2000 to 3500 km away from the East Asian continent. The leptocephalus larvae are born between April and November (Tsukamoto 1990, Tzeng 1990, Tsukamoto et al. 2003) and drift from their spawning area with the North Equatorial Current (NEC), followed by the Kuroshio Current (KC), for 4 to 6 mo, eventually reach-ing the coasts of East Asia (Cheng & Tzeng 1996). They metamorphose into juvenile (glass) eels along the con-tinental shelf and then enter estuaries in pulses known as ‘arrival waves,’ mainly into Taiwan, China, Korea and Japan (Tesch 2003). The eels live in freshwater rivers for more than 4 yr before metamorphosing into silver eels (onset of sexual maturation) in autumn and winter (Han et al. 2003, 2009), after which they migrate back to their marine birthplace to spawn and eventu-ally die (Tsukamoto 1992, 2006, Tesch 2003). The Japanese eel is a commercially important aquaculture species in East Asia. However, its recruitment has been rapidly declining in the past decades, possibly due to overfishing, habitat destruction and the effects of global climate change (Tzeng 1986, Han et al. 2009). A similar trend has been reported among European eels A. anguilla (Dekker 2003a,b). To develop an effective management plan for this declining species and ensure its sustainability, it is vital to gain a thorough understanding of the partitioning of its genetic struc-ture in both spatial and temporal scales.
In the past, the concept of panmictic populations for temperate eels was accepted on the basis of evidence from mtDNA sequences such as those from the Japan-ese eel (Sang et al. 1994, Ishikawa et al. 2001a), Euro-pean eel (De Ligny & Pantelouris 1973, Avise et al. 1986, Avise 2003) and American eel Anguilla rostrata (Avise et al. 1986, Avise 2003). Although mtDNA gene regions are powerful markers for resolving phyloge-netic problems at the species level, these are of limited use in population genetic studies because of their lim-ited resolving power and the presence of mitochondr-ial pseudogenes in the nuclear genome of many organ-isms (reviewed in Zhang & Hewitt 2003, Wan et al. 2004). On the other hand, although studies using allo-zyme markers have detected spatial heterogeneity in allele frequency within the American eel (Williams et al. 1973), European eel (De Ligny & Pantelouris 1973, Comparini et al. 1977) and Japanese eel (Chan et al. 1997), the significant clinal shift in allele frequency
was putatively attributed to single-generation selec-tion along an environmental gradient (Avise 2003). In recent studies, which used more sensitive microsatel-lite markers, panmixia in the European eel was chal-lenged by the evidence of a weak but significant pop-ulation structuring (Daemen et al. 2001, Wirth & Bernatchez 2001, Maes & Volckaert 2002). Wirth & Bernatchez (2001) and Maes & Volckaert (2002) also found evidences for IBD. However, Dannewitz et al. (2005) and Palm et al. (2009) suggested panmixia oc-curred in the European eel, and Dannewitz et al. (2005) suggested that the discrepancies among studies could be due to the fact that temporal variation was not accounted for in the previous studies. Many studies in which annual cohorts or arrival waves were compared have shown a pattern of genetic patchiness (Maes et al. 2006, Pujolar et al. 2006, 2007). Furthermore, tem-poral genetic variation within sites may exceed the geographical factor within sites. Because of the com-plexity of the oceanic environment, eel reproduction may be regarded as a sweepstake event in which only a fraction of the adult population contributes to the next generation, resulting in a large variance in the reproductive success of each cohort (Dannewitz et al. 2005, Maes et al. 2006, Pujolar et al. 2006, 2007). No apparent deviations from panmixia were observed in the American eel (Wirth & Bernatchez 2003) or in two other species, speckled longfin eel A. reinhardtii (Shen & Tzeng 2007a) and shortfin eel A. australis (Shen & Tzeng 2007b).
Tseng et al. (2006) divided the genetic populations of the Japanese eel into low-latitude (South China and Taiwan) and high-latitude (Japan, Korea and North China) groups; the IBD pattern was not detected for either groups. They suggested that most progeny tend to be transported back to similar locations, as in the case of their ancestors, with low gene flow between the south and north eel groups leading to a stable genetic isolation of these 2 populations. However, one factor that cannot be excluded is that the spatial differentia-tion found in the Japanese eel may be due to stochas-tic genestochas-tic heterogeneity (genestochas-tic patchiness), as in the case of the European eel. In addition, the distribution of the Japanese glass eel in East Asia strongly depends on the KC, which flows past the eastern coast of wan to the north of Japan. The distance between Tai-wan and Japan ranges from 1000 to 2000 km, and the velocity of the KC averages between 77 and 116 km d–1
(Nitani 1972). Thus, the mean time lag for larval trans-portation is approximately 9 to 26 d, which matches the mean difference in the age at metamorphosis of the glass eels of Taiwan and Japan (Cheng & Tzeng 1996). Due to the short time difference in larval dispersal between Taiwan and Japan, it seems quite unlikely that the leptocephali would be transported to the same
locations as their parents by the KC with high selectiv-ity. Thus, to obtain a better understanding of the popu-lation genetic characteristics of the Japanese eel, a more thorough investigation of the population genetic structure is required in which both spatial and tempo-ral components are considered simultaneously.
We report the results from the most extensive gene-tic study to date of the Japanese eel in which 8 micro-satellite loci were examined. We studied (1) small-scale genetic variation among arrival waves from Taiwan and Japan collected in the same fishing season to test whether genetic differentiation or IBT exists among arrival waves within and between sites, (2) long-term genetic variation among annual cohorts from the Danshui River, Taiwan, over a period of 21 yr and (3) the spatial population genetic structures of Japanese eels collected from 9 locations in East Asia using the IBD test. The aim of this study was to investi-gate whether genetic patchiness, IBD or IBT play an important role in shaping the population genetic struc-ture of the Japanese eel.
MATERIALS AND METHODS
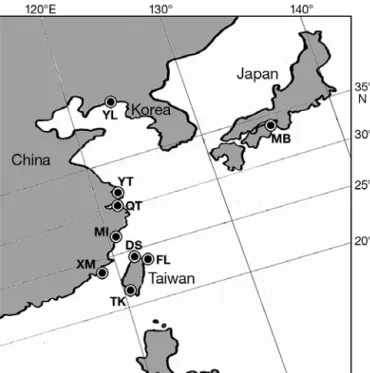
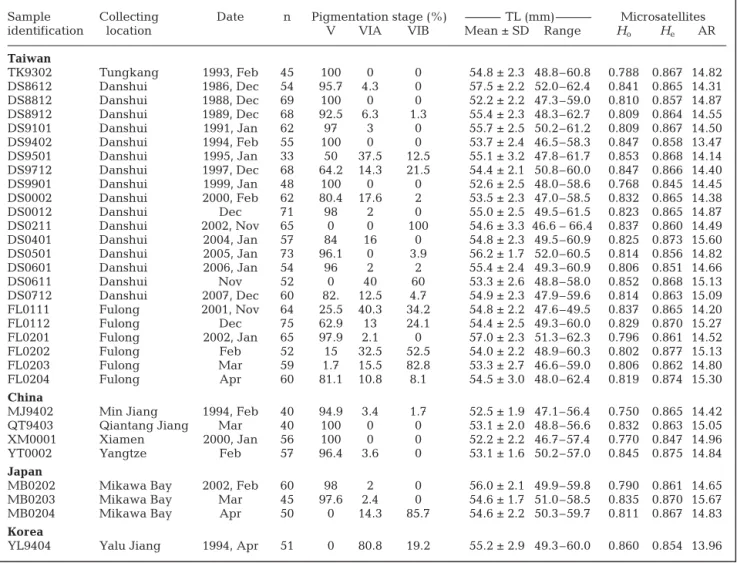
Sample collection. In Taiwan, the recruitment of Japanese glass eels usually begins in late October and ends in early April of the following year (Chang et al. 2007, Han et al. 2009), which is defined as an annual cohort; however, this process is usually delayed by approximately 1 mo in Japan and 1 to 3 mo in other East Asian countries (Y. S. Han et al. unpubl. data). The arrival of glass eels usually occurs in pulses, and these batches of samples are defined as arrival waves. In this study, arrival waves were collected monthly from November 2001 through April 2002 by means of a fyke net in the Fulong estuary (FL), which is located in the Shuangsi River estuary in northern Taiwan. More samples were harvested from February 2002 through April 2002 from Mikawa Bay (MB), Japan (Fig. 1, Table 1). Annual cohorts were collected from 1986 to 2007 from the Danshui River estuary (DS), northern Taiwan (Fig. 1, Table 1). Some annual cohorts were not collected. For spatial analysis, samples were also col-lected from Taiwan (Tungkang), China (Xiamen, Min Jiang, Qiantang Jiang and Yangtze estuaries) and Korea (Yalu Jiang) (Fig. 1, Table 1). The captured glass eels were immediately preserved in 95% ethanol. A total of 1770 specimens were randomly selected from the total collection of samples. Before microsatellite DNA analysis, the total length (TL, to the nearest 0.1 mm) of each individual was measured, and its pig-mentation state was assessed (Table 1). Pigpig-mentation of glass eels was judged by using a modification of the parameters used for the European eel (Tesch 2003).
Stages VA and VB (Tesch 2003) were combined into Stage V, VIA1 and VIA2 into Stage VIA, and stages higher than VIA3 into Stage VIB.
DNA extraction. Genomic DNA of glass eels was extracted from a small piece of muscle tissue using a commercial DNA purification and extraction kit (Bio-man Scientific). Ethanol was removed by evaporation before treatment. A piece of muscle weighing approx-imately 20 mg was digested in 200 µl lysis buffer (10 mM Tris-HCl, 2 mM EDTA, 10 mM NaCl, 1% sodium dodecyl sulfate and 10 mg ml–1dithiothreitol,
pH 8.0) and 20 µl Proteinase K (10 mg ml–1) for 2 h at
60°C. The digested tissue was ground, and the solution was then transferred to a spin column, washed with ethanol buffer, eluted with 50 µl elution buffer (10 mM Tris-HCl, pH 8.5) and stored at –20°C before PCR analysis.
PCR and genotyping. Eight microsatellite loci were selected, 6 (GT)n loci and 2 (GA)n loci (Table 2). These loci were selected from GenBank and exhibited mod-erate to high polymorphism. These microsatellite DNA were amplified using PCR, as described by Han et al. (2008). Briefly, the amplification was performed in a total reaction volume of 25 µl with the following com-position: 0.3 µl of DNA template, 0.3 µl of Taq poly-merase (5 U µl–1), 1 µl of 10 µM forward and reverse
Fig. 1. Anguilla japonica. Locations where Japanese glass eels were collected in coastal waters of Taiwan, China, Korea and Japan. YL: Yalu Jiang estuary; MB: Mikawa Bay; YT: Yangtze River estuary; QT: Qiantang Jiang estuary; MI: Min Jiang estuary; DS: Danshui River estuary; FL: Fulong estuary;
Sample Collecting Date n Pigmentation stage (%) TL (mm) Microsatellites
identification location V VIA VIB Mean ± SD Range Ho He AR
Taiwan TK9302 Tungkang 1993, Feb 45 100 0 0 54.8 ± 2.3 48.8–60.8 0.788 0.867 14.82 DS8612 Danshui 1986, Dec 54 95.7 4.3 0 57.5 ± 2.2 52.0–62.4 0.841 0.865 14.31 DS8812 Danshui 1988, Dec 69 100 0 0 52.2 ± 2.2 47.3–59.0 0.810 0.857 14.87 DS8912 Danshui 1989, Dec 68 92.5 6.3 1.3 55.4 ± 2.3 48.3–62.7 0.809 0.864 14.55 DS9101 Danshui 1991, Jan 62 97 3 0 55.7 ± 2.5 50.2–61.2 0.809 0.867 14.50 DS9402 Danshui 1994, Feb 55 100 0 0 53.7 ± 2.4 46.5–58.3 0.847 0.858 13.47 DS9501 Danshui 1995, Jan 33 50 37.5 12.5 55.1 ± 3.2 47.8–61.7 0.853 0.868 14.14 DS9712 Danshui 1997, Dec 68 64.2 14.3 21.5 54.4 ± 2.1 50.8–60.0 0.847 0.866 14.40 DS9901 Danshui 1999, Jan 48 100 0 0 52.6 ± 2.5 48.0–58.6 0.768 0.845 14.45 DS0002 Danshui 2000, Feb 62 80.4 17.6 2 53.5 ± 2.3 47.0–58.5 0.832 0.865 14.38 DS0012 Danshui Dec 71 98 2 0 55.0 ± 2.5 49.5–61.5 0.823 0.865 14.87 DS0211 Danshui 2002, Nov 65 0 0 100 54.6 ± 3.3 46.6 – 66.4 0.837 0.860 14.49 DS0401 Danshui 2004, Jan 57 84 16 0 54.8 ± 2.3 49.5–60.9 0.825 0.873 15.60 DS0501 Danshui 2005, Jan 73 96.1 0 3.9 56.2 ± 1.7 52.0–60.5 0.814 0.856 14.82 DS0601 Danshui 2006, Jan 54 96 2 2 55.4 ± 2.4 49.3–60.9 0.806 0.851 14.66 DS0611 Danshui Nov 52 0 40 60 53.3 ± 2.6 48.8–58.0 0.852 0.868 15.13 DS0712 Danshui 2007, Dec 60 82. 12.5 4.7 54.9 ± 2.3 47.9–59.6 0.814 0.863 15.09 FL0111 Fulong 2001, Nov 64 25.5 40.3 34.2 54.8 ± 2.2 47.6–49.5 0.837 0.865 14.20 FL0112 Fulong Dec 75 62.9 13 24.1 54.4 ± 2.5 49.3–60.0 0.829 0.870 15.27 FL0201 Fulong 2002, Jan 65 97.9 2.1 0 57.0 ± 2.3 51.3–62.3 0.796 0.861 14.52 FL0202 Fulong Feb 52 15 32.5 52.5 54.0 ± 2.2 48.9–60.3 0.802 0.877 15.13 FL0203 Fulong Mar 59 1.7 15.5 82.8 53.3 ± 2.7 46.6–59.0 0.806 0.862 14.80 FL0204 Fulong Apr 60 81.1 10.8 8.1 54.5 ± 3.0 48.0–62.4 0.819 0.874 15.30 China
MJ9402 Min Jiang 1994, Feb 40 94.9 3.4 1.7 52.5 ± 1.9 47.1–56.4 0.750 0.865 14.42 QT9403 Qiantang Jiang Mar 40 100 0 0 53.1 ± 2.0 48.8–56.6 0.832 0.863 15.05
XM0001 Xiamen 2000, Jan 56 100 0 0 52.2 ± 2.2 46.7–57.4 0.770 0.847 14.96
YT0002 Yangtze Feb 57 96.4 3.6 0 53.1 ± 1.6 50.2–57.0 0.845 0.875 14.84
Japan
MB0202 Mikawa Bay 2002, Feb 60 98 2 0 56.0 ± 2.1 49.9–59.8 0.790 0.861 14.65 MB0203 Mikawa Bay Mar 45 97.6 2.4 0 54.6 ± 1.7 51.0–58.5 0.835 0.870 15.67 MB0204 Mikawa Bay Apr 50 0 14.3 85.7 54.6 ± 2.2 50.3–59.7 0.811 0.867 14.83 Korea
YL9404 Yalu Jiang 1994, Apr 51 0 80.8 19.2 55.2 ± 2.9 49.3–60.0 0.860 0.854 13.96 Table 1. Anguilla japonica. Sampling date, location, size, mean total length (TL) and genetic variation of Japanese glass eels.
Ho: observed heterozygosity; He: expected heterozygosity; AR: allele richness
Locus Repeat Primer sequence (5∏Æ3’) Annealing Accession Fluorescence
motifs temperature (°C) no. (reverse)
AJMS-2 (GA)n F: ATT TCA CGT CAT CGG ACC TGC
R: GCT GGG AGC GAC GCT TTA TC 60 AJ297600 5’FAM
AJMS-3 (GT)n F: GGT ATG AAT GCA GGC GTT TAT G
R: GCA ACC GAT TTG ATC TCC AG 60 AJ297601 5’TAMRA
AJMS-5 (GT)n F: CCT TCA GAT TGC TAG CAC
R: CGG AGT CTA ATT GTC TCC TC 58 AJ297602 5’HEX
AJMS-6 (GT)n F: ACA GAG CCA GAC AAA CAG AC
R: GGT CAG CAA GCA AAA CGA AC 58 AJ297603 5’HEX
AJM-1 (GT)n F: AGT AAA GAG TCC CAC GCA TTC
R: AAG GTG GAT TTT TGC TGG CTC 60 AM062761 5’TAMRA
AJM-8 (GT)n F: TGG CTG AAG TGA GTA TGC T
R: AGA TAT GGA AGC AGG ATG GAG 60 AM062762 5’HEX
AjTR-12 (GA)n F: AAC GTT AGT CCC TAG GTT CC
R: TAA GGG TGT TAT ATG TTC AG 58 AB051084 5’FAM
AjTR-37 (GT)n F: AGA CCT TAT GTC ACC TTA TGC T
R: AAG ATG TTA AAT TCA ATT GTG C 58 AB051094 5’FAM
Table 2. Anguilla japonica. Characteristics of 8 microsatellite DNA loci in Japanese eels including repeat motif, primer sequence, annealing temperature, GenBank accession no. and fluorescence label. F: forward; R: reverse
primers, 2.5 µl of 10× PCR buffer, 0.6 µl of 10 mM dNTPs and 19.3 µl of Milli-Q H2O. The reverse primers
contained FAM, TAMRA, or HEX fluorescent labels for genotyping (Table 2). The PCR amplification protocol was as follows: initial denaturation at 94°C for 3 min followed by 35 cycles with denaturation at 94°C for 30 s, annealing at 58 to 60°C for 30 s (Table 2) and ex-tension at 72°C for 30 s. A final exex-tension was carried out at 72°C for 10 min. For genotyping, 1 µl of the PCR product was diluted with 12 µl Milli-Q H2O, and
frag-ment analysis was performed using a Megabase 1000 DNA analysis system (Amersham Biosciences). The data were scored with Genetic Profiler™ v. 2.0 (Amers-ham Biosciences), and the sizes of each allele were inspected visually.
Data analysis. One-way ANOVA was used to test the differences in the mean TL of the glass eel samples. To correct for multiple testing, we also used Tukey’s HSD test. The observed numbers of alleles (na), observed
(Ho) and expected (He) heterozygosities and deviations
from the Hardy-Weinberg equilibrium (HWE) were in-dependently calculated for each locus using ARLE-QUIN v. 3.1 (Schneider et al. 2000). Computation of the allelic richness for the specified sample sizes was based on the rarefaction method (Hurlbert 1971) using FSTAT v. 3.9.5. Significant differences in allelic richness or het-erozygosity among samples were tested using a non-parametric Friedman test followed by a pairwise Wilcoxon signed-ranks test. The allele dropout, null al-leles and scoring errors for each sample were tested us-ing Micro-Checker v. 2.2.3 (Van Oosterhout et al. 2004). Partitioning of genetic differentiation was performed by ARLEQUIN v. 3.1 using the locus-by-locus analysis of molecular variance (AMOVA) with 10 000 permuta-tions. Pairwise Wright’s fixation indices, FST, were
cal-culated using FSTAT v. 3.9.5 (Goudet 1995), and the significance levels were adjusted by a sequential Bon-ferroni correction (Weir & Cockerham 1984, Rice 1989). A phylogenetic tree based on pairwise Nei’s (1983) un-biased genetic distances (DA) was constructed by a
neighbor-joining phenogram using the DISPAN pro-gram with 1000 bootstrap replicates. IBT and IBD were estimated using Mantel tests (Mantel 1967) imple-mented in the ARLEQUIN v. 3.1 software by correlating the spatial distance (kilometers between sites) or temporal distance (days or months between samples) with the DA.
Statistical power was analyzed with the program POWSIM (Ryman & Palm 2006). This novel simulation method was applied to assess the statistical power for detecting population heterogeneity at various true lev-els of divergence, with the applied set of markers and sample sizes. The program detected significant differ-entiation (using chi-square and Fisher’s exact tests) under a specified level of population divergence given
by 1 – (1 – 1/2Ne)t, where t is the time since divergence
and Nethe effective population size. Simulations were
run to detect an expected divergence of FST= 0.001 to
0.0025 for arrival waves between Taiwan and Japan, with 7 microsatellite loci for 9 groups with 530 individ-uals. Ne/t combinations corresponded to 500/5, 2000/
10 and 4000/20 for FST= 0.0025, and 2500/5, 5000/10
and 10000/20 for FST= 0.001.
RESULTS Morphometric data
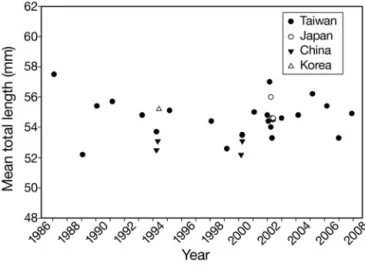
The mean and range for TL of 31 samples of glass eel are shown in Table 1. Significant differences were observed when the mean TL of all samples (F = 50.37, p < 0.001) was compared; however, no specific trend was detected (Fig. 2). The mean TL was in the range of 52.2 to 57.5 mm with great variation among samples (Fig. 2). Highly significant differences were observed among samples within the sites of both the Danshui River (annual cohorts) and Fulong estuary (arrival waves). However, a nested ANOVA showed no signif-icant differences among the sites in Taiwan when tem-poral samples within the site were pooled (p > 0.05 for all). The mean TL for samples from China was signifi-cantly lower than those from other areas (p < 0.001 for all). No significant differences in mean TL were found for samples from Taiwan, Japan and Korea when within-area specimens were pooled.
The pigmentation stages of all 31 samples are shown in Table 1. As indicated, most samples had Stage V pigmentation during collection. However, some sam-ples from Yalu Jiang, Mikawa Bay, Fulong and Dan-shui showed > 50% Stage VI pigmentation (Table 1).
Fig. 2. Anguilla japonica. Mean total length distribution of all 31 Japanese eel samples from 1986 through 2007
Genetic diversity within samples
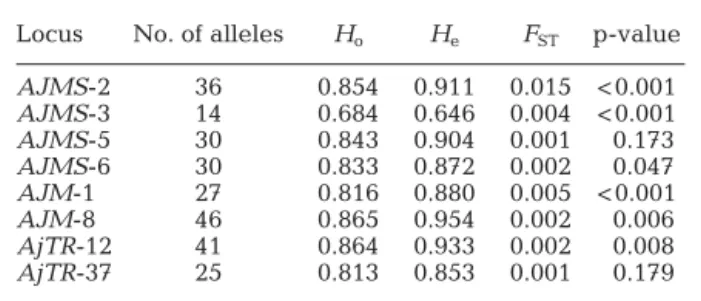
A total of 8 polymorphic loci were screened; all were moderately to highly polymorphic such that the total number of alleles ranged from 14 in locus AJMS-3 to 46 in locus AJM-8 (Table 3). The Ho and He of each
sample ranged from 0.542 to 0.961 and from 0.515 to 0.965, respectively. The HWE test showed only a few significant deviations after Bonferroni corrections for all loci (k = 248), with the exception of the AJMS-2 locus (4 of 31 for AJMS-2 and 5 of 217 for the other 7 loci). These deviations were scattered in the AJM-1, AJM-8, and AjTR-12 loci without a sample- or locus-specific pattern. Null alleles were concentrated in the AJMS-2 locus (16 of 31), as tested by Micro-Checker. The other loci showed a scattered pattern for null alle-les (24 of 217) without a sample- or locus-specific pat-tern. There was no evidence of allele dropout, and very few scoring errors (6 of 248) were detected for all loci. AMOVA for each locus indicated that most of the total genetic variation was within samples (> 99.4%), and
only < 0.6% was between samples, with the exception of AJMS-2 (1.5% between samples) (Table 3). Owing to the poor quality of data for the AJMS-2 locus, it was excluded from subsequent analyses.
The mean Ho, mean He, and allele richness (AR) of
the 31 samples are shown in Table 1. There were no overall significant differences in AR (p = 0.486) or Ho
(p = 0.141) among the samples. Pairs with significant differences in AR or Howere scattered without a
spa-tial- or temporal-specific pattern.
Spatial-temporal genetic structure
Overall, genetic differentiation among the 31 sam-ples was very low, yet significant (FST = 0.003, p <
0.001, Table 4). Genetic differentiation among annual cohorts collected from a single location was studied for glass eels collected from the Danshui River, Taiwan. Low but significant genetic differentiation among 16 samples (1986 to 2007) was observed (Table 4). How-ever, among these, pairwise FSTcomparisons were
sig-nificant only in 2 of 120 tests (between Danshui sam-ples [see Table 1] DS0012 and DS8612, and DS0012 and DS0401, k = 100). No significant difference was observed in genetic differentiation among arrival waves from the Fulong estuary, Taiwan, and Mikawa Bay, Japan (Table 4), or in the pairwise FSTtests of
recruits from these 2 locations (k = 50). When combin-ing data from the Fulong estuary and Mikawa Bay, the 2-level hierarchical analysis also showed no significant genetic differentiation either among locations (FCT= 0,
p = 0.527) or among temporal recruits (FSC= 0.001, p =
0.319) (Table 4). Locus No. of alleles Ho He FST p-value
AJMS-2 36 0.854 0.911 0.015 < 0.001 AJMS-3 14 0.684 0.646 0.004 < 0.001 AJMS-5 30 0.843 0.904 0.001 0.173 AJMS-6 30 0.833 0.872 0.002 0.047 AJM-1 27 0.816 0.880 0.005 < 0.001 AJM-8 46 0.865 0.954 0.002 0.006 AjTR-12 41 0.864 0.933 0.002 0.008 AjTR-37 25 0.813 0.853 0.001 0.179 Table 3. Anguilla japonica. Locus characteristics of the genetic variation for observed (Ho) and expected (He) heterozygosity
and FSTfor 8 loci
Analysis Item Comparison No. of samples No. of ind. Indicies p-value
1 Spatial and All samples (9 sites) 31 1770 FST= 0.003 < 0.001
temporal samples FSC= 0.002 < 0.001
FCT= 0.001 0.002
2 Taiwan and Japan (2001–2002, 9 530 FST= 0.001 0.322
2 sites) FSC= 0.001 0.319
FCT= 0.000 0.527
3 Taiwan (3 sites) 23 1371 FST= 0.002 < 0.001
FSC= 0.002 < 0.001
FCT= 0.001 0.085 4 Temporal samples Taiwan annual cohorts (Danshui) 16 951 FST= 0.004 < 0.001
5 Taiwan arrival waves (Fulong) 6 375 FST= 0.001 0.375
6 Japan arrival waves (Mikawa Bay) 3 155 FST= 0.001 0.347
7 Spatial samples Locations (1994, 4 sites) 4 186 FST= 0.006 0.002
8 Locations (2000, 3 sites) 3 175 FST= 0.006 0.001
9 China (4 sites) 4 193 FST= 0.008 < 0.001
10 All locations (9 sites) 10 518 FST= 0.004 < 0.001
Table 4. Anguilla japonica. Test for spatial and temporal genetic differentiations in Japanese eel samples by 2-level hierarchical AMOVA based on 7 loci. Analyses 1 to 3 refer to comparisons between spatial and temporal samples within given sites, analyses 4 to 6 refer to comparisons between temporal samples within given sites, and analyses 7 to 10 refer to comparisons between loca-tions in given years and area. FST, FCT, FSC: tests permuting genotypes among populations and among groups, permuting whole
Genetic differentiation between locations within annual cohorts was also determined for glass eels col-lected in 1994 (4 sites) and 2000 (3 sites). We observed a low but significant genetic differentiation among locations in samples from 1994 and 2000 (Table 4). Pairwise FSTcomparisons showed a significant
differ-ence between Qiantang and Yalu Jiang in 1994 and between Xiamen and Fulong in 2000. When temporal samples were pooled within sites, the overall differen-tiation remained significant for glass eels from Taiwan (3 sites), China (4 sites) and all locations (9 sites) (Table 4). Two-level hierarchical AMOVA analyses of the samples from Taiwan showed that genetic varia-tions among samples within sites (FSC= 0.002, p = 0)
were larger than the differences among sites (FCT =
0.001, p = 0.085). When testing pairwise FSTfor glass
eels collected from all 9 locations in 1993, 1994, 2000 and 2002, only 2 of the 45 tests were found to be signif-icant (k = 50).
Statistical power
The POWSIM analysis of statistical power revealed that 7 microsatellite loci were sufficient to provide a > 80% probability of detecting an FSTof 0.001 for a
chi-square test when analyzing a total of 530 specimens dis-tributed over 9 groups. Although the likelihood of not de-tecting genetic differentiation could not be excluded, the true degree of genetic differentiation among the studied arrival waves must, nevertheless, have been very small.
IBD, IBT, and cluster analysis
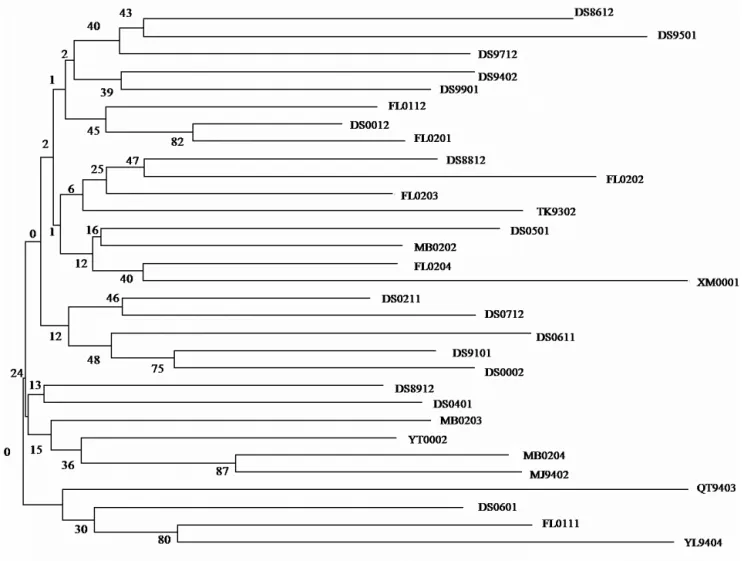
The neighbor-joining phenogram based on the DA
among all 31 samples did not show any clustering of temporal samples within sites or locations within regions (Fig. 3). The most robust node was supported in only 48% of the bootstrap replicates.
Fig. 3. Anguilla japonica. Neighbor-joining phenogram based on Nei’s (1983) unbiased genetic distance among 31 samples of the Japanese eel. Bootstrap values at each node were calculated using 1000 replicates over loci. The designation marks refer to the
The Mantel test revealed no significant correlation between differences in the days of recruitment and DA
among arrival waves (Fulong) (r = 0.190, p = 0.497) (Fig. 4a). If the genetic distance FST/(1 – FST) was used
instead of DA, the IBT test for arrival waves remained
insignificant (data not shown). There was also no sig-nificant correlation between differences in the months of recruitment and DAamong annual cohorts (Danshui)
(r = 0.146, p = 0.112) (Fig. 4b). However, if the genetic distance FST/(1 – FST) was used, the correlation showed
marginal significance (r = 0.094, p = 0.027). We also found no correlation between DAand the nearest sea
distance by using pairwise comparisons of 9 locations (r = 0.094, p = 0.541) (Fig. 4c). If the genetic distance FST/(1 – FST) was used, IBD test for all locations
re-mained insignificant (data not shown).
DISCUSSION Morphometric heterogeneity
Our study shows a significant heterogeneity in size among all samples. One possible explanation for the morphometric heterogeneity is the seasonal or inter-annual changes in feeding conditions, with larvae that migrated across the ocean under different primary pro-duction reaching different sizes (Tzeng 1990, De-saunay & Guerault 1997, Reveillac et al. 2008). Never-theless, no specific trend was observed for the overall mean TL among annual cohorts over the last 2 de-cades. In the European (Desaunay & Guerault 1997) and American eels (Haro & Krueger 1988, Castonguay et al. 1994), however, the biometrics of glass eel appear to exhibit a decrease since the early 1980s. Since we have no samples from before the 1980s, no comparison is currently available.
Eel recruits from China were generally smaller than those from other areas. In the European eel, Boëtius & Boëtius (1989) supposed that the metamorphosed glass eel might not immediately enter the estuary but stay offshore and starve. Thus, a different dispersal route might account for the differences in the sizes of recruits; that is, the Japanese glass eel might have to move a long distance across the continental shelf, away from the KC, to reach the estuary in mainland China. This may account for the smaller size of the samples from China in comparison with those from Taiwan or Japan. However, the sizes of the specimens from Yalu Jiang were equivalent to those of the speci-mens from Taiwan and Japan; this is probably because of the advanced development stage of these specimens when they were caught, as indicated by their pigmen-tation stage.
For the 6 arrival waves of Taiwan (Fulong), some specimens exhibited an advanced pigmentation stage (VIA or VIB), indicating a potential mixing between neighboring arrival waves with specimens born in the same period. Nevertheless, the age difference be-tween Stage V and VI individuals was usually less than Fig. 4. Anguilla japonica. Regression of genetic
differentia-tion (DA) at microsatellites on temporal distance (a) in days among arrival waves of Fulong, (b) in months among annual cohorts of Danshui and (c) on spatial distance in kilometers from the 9 sites in the present study. Pearson’s correlation co-efficient r and p-values were obtained from the Mantel test
1 mo (Tzeng 1990, Tzeng & Tsai 1992). Thus, it is quite impossible for these samples to hinder the IBT test with a 6 mo interval.
Evidence of panmixia in the Japanese eel The results of the present study suggest that the Japanese eel population has no specific pattern of genetic differentiation in both spatial and temporal scales. First, the overall genetic variations among the arrival waves from both Taiwan and/or Japan were not significant. Second, although the overall FSTshowed
significance for spatial recruits within the indicated years or areas, pairwise FSTtests showed few
signifi-cant genetic differentiations. Third, the phylogenetic tree showed no spatial- or temporal-specific patterns. Taken together, these results clearly suggest that the Japanese eel probably constitutes only a single popu-lation both spatially and temporally.
The population structures of anguillid eels have long been considered panmictic. This is because sexually mature stocks migrate and spawn in a single site, and their larvae are passively transported back to their growth habitats by oceanic currents with a long larval duration, making population genetic structuring quite impossible (Schmidt 1925, Tsukamoto 1992, Avise 1994, Tesch 2003, Aoyama 2009). However, Tseng et al. (2006) suggested the presence of 2 genetically different groups in an indicated year, i.e. low-latitude (southeast-ern China and Taiwan) and high-latitude (Japan, Korea and northeastern China) groups based on 6 microsatel-lite DNA loci analyses. The authors presumed that the leptocephali of the Japanese eel tend to be transported back to certain latitude ranges where their parents were located, with little gene flow between the north and south eel groups. In the present study, however, the neighbor-joining phenogram did not show any clus-tering of temporal samples within sites or locations within regions. When the samples were analyzed in greater detail, the overall FSTshowed a significant
dif-ference in spatial recruits within the indicated years or areas. However, only a few pairwise FSTtests showed
significant genetic differentiations, and these genetic variations were not consistent over time when the tem-poral component was taken into consideration. In the European eel, temporal variation among samples may be misinterpreted as geographical isolation (Dannewitz et al. 2005, Maes et al. 2006). Therefore, one possible explanation for the genetic partitioning of spatial sam-ples within an indicated year in Tseng et al.’s (2006) study may be ‘chaotic genetic patchiness’ in which ran-dom variations in parental contributions to reproduc-tive activity, incomplete mixing of larvae and kin ag-gregation may act in concert to produce offspring with
genetic heterogeneity (Hedgecock 1994a,b, Selkoe et al. 2006). This sporadic occurrence of genetic differenti-ation in space would mask the true populdifferenti-ation genetic structure of the Japanese eel when there is a lack of replicates over time. Alternatively, another possible ex-planation for the discrepancy between Tseng et al.’s (2006) results and those obtained in the present study might be that the AJMS-2 locus was incorporated in the former study (locus MS-2 in Tseng et al. 2006). This locus showed some deviations from HWE and had abundant null alleles in comparison with other loci, as observed in this study. When the AJMS-2 locus was included in the analyses, the degree of genetic differ-entiation among samples became more pronounced, although spatial- or temporal-specific patterns could still not be detected.
Japanese eels appear to spawn in a restricted area, and their larvae are passively transported by the NEC and KC, both of which exhibit considerable changes in speed, eddy structure and route at daily, monthly and even yearly levels (reviewed in Aoyama 2009). If there were actually 2 genetic populations of Japanese eels, they must have been a consequence of a nonrandom return of larvae to the place where their parents formerly resided. One possibility might be the heritable differ-ences in larval durations between southern and northern groups. Since the newly arrived recruits are quite simi-lar in TL (Tsukamoto 1990, Umezawa & Tsukamoto 1990, Cheng & Tzeng 1996, Kawakami et al. 1999, Chang et al. 2007) indicating a size-dependent metamorphosis of the leptocephali in the Japanese eel, it is likely that the fast-growing leptocephali have a heritable short larval duration and mostly metamorphose in the south, while the slow-growing ones with a heritable long larval dura-tion may mostly drift north along with the KC. We tested this possibility by examining genetic differentiation between eel groups with different larval durations. How-ever, no significant genetic differentiations were ob-served between samples with short or long larval dura-tions (Y. S. Han et al. unpubl. data).
In summary, on the basis of our present knowledge of oceanographic variations and the larval migration of the Japanese eel, we cannot hypothesize any mecha-nism by which this species can be grouped into multi-ple populations.
No IBT patterns for arrival waves
Japanese eels appear to spawn in synchrony each month around the new moon periods (Ishikawa et al. 2001b, Tsukamoto et al. 2003) indicating the existence of multiple ‘spawning stocks.’ Thus, glass eels in estu-aries usually occur in pulses and last for a few months (Chang et al. 2007, Han et al. 2009). Based on
back-calculations of the otolith daily growth rings, it has been proven that arrival waves within sites consist of individuals spawned in different months (Tzeng 1990, Reveillac et al. 2008). If the spawning time of the Japanese eel is heritable, genetic differentiation might have occurred within arrival waves on account of the temporal isolation of reproductive activity. In a previ-ous study, Chang et al. (2007) found that glass eels of arrival waves recruited to the Danshui estuary in Tai-wan exhibited subtle genetic patchiness without over-all significant temporal genetic variations. In the pre-sent study, we found no overall genetic differentiations among arrival waves either from the Fulong estuary in Taiwan or from Mikawa Bay in Japan. IBT tests using the genetic distance FST/(1 – FST) or DAalso showed no
significance, suggesting a panmixia for the Japanese eel on a temporal scale.
The low genetic differentiations among arrival waves might indicate a potential larval mixing. The long dispersal time for the leptocephali (4 to 6 mo) and protracted spawning season of the reproducers pro-vide conditions required for larval mixing between monthly arrival waves. In fact, the birth dates of previ-ous arrival waves caught in Taiwanese estuaries par-tially overlapped with those of the next arrival wave (Tzeng 1990). Shinoda (2004) analyzed glass eels col-lected from 9 sites in East Asia and reported that the mean larval duration of the Japanese eel is 156 d with a large variation range of 98 to 227 d. Therefore, the larval mixing might buffer genetic heterogeneities between arrival waves to some extent. Alternatively, if the spawning time between early and late arrival waves is heritable, a temporal Wahlund effect may occur owing to the mixing of recruits from groups with distinct spawning times (Nielsen et al. 2003); such cir-cumstances were not found in the present study. Since spawning stocks may start to migrate from distant loca-tions at different times, and even by different routes and swimming speeds, the times required for each individual to reach the spawning area must differ. Thus, it is not possible for a heritable spawning time to be established in the Japanese eel.
Slight genetic shift for annual cohorts over 21 yr In our previous study (Han et al. 2008), we investi-gated changes in the genetic composition of Japanese eel recruits over the last 2 decades using 6 polymor-phic microsatellite DNA loci. Our data showed that al-though the overall genetic differentiation among all samples was significant, only 2 of 120 pairwise FSTtests
were significant. The Mantel test using FST/(1 – FST)
showed an insignificant correlation (r = 0.173, p = 0.0504). In the present study, we used mostly
over-lapped samples with 7 microsatellite DNA loci for re-analyses and similar results were obtained. However, the Mantel test for annual cohorts using FST/(1 – FST)
became marginally significant (p = 0.027), suggesting a slight year-to-year variation in the genetic composi-tion of temporal samples, possibly due to a random genetic drift. It is likely that yearly variations in repro-ductive success led to random slight allele frequency shifts among annual cohorts and that cumulative genetic variation may be observed after many genera-tions. For the Japanese eel, > 50% of individuals had a life cycle between 5 or 6 yr (Han et al. 2009). Thus, an average of 4 generations was included in the samples encompassing 21 yr. This may also explain why overall genetic differences were significant among annual cohorts, but not among arrival waves of a single site when samples were collected and analyzed in detail. To trace long-term changes in the genetic composition of the Japanese eel, sample collection over a longer duration is needed. However, these data are currently not available.
In conclusion, the patterns of genetic structure in the Japanese eel can be explained on the basis of the fol-lowing: (1) a panmixia of the Japanese eel in spatial and temporal scales, as evidenced by a chaotic phylo-genetic tree and a lack of both IBT and IBD patterns, (2) a slight genetic drift of the genetic composition for annual cohorts within a single site over the last 2 de-cades, as evidenced by a generally stable AR and Ho
but a marginally significant Mantel test result, and (3) sporadic genetic variations among samples, which occurred on a random scale and could not have created a stable genetic structure that would last more than a year. Thus, our findings have important implications for implementing a reasonable management program for the Japanese eel. A panmictic population of the Japanese eel in East Asia indicates that it is a single management unit and regulations must involve all East Asian countries to prevent further decline of this valu-able eel resource.
Acknowledgements. This research study was funded by the
National Science Council of the Executive Yuan, Taiwan (NSC 96-2313-B-002-038-MY3 and NSC 97-2621-B-002-011-MY2) and by the Council of Agriculture of the Executive Yuan (98 AS-10.3.1-F2-5), Taiwan.
LITERATURE CITED
Aoyama J (2009) Life history and evolution of migration in catadromous eels (genus Anguilla). Aqua-BioSci Monogr 2(1):1–42
Avise JC (1994) Molecular markers, natural history and evo-lution. Chapman & Hall, New York
Avise JC (2003) Catadromous eels of the North Atlantic: a review of molecular genetic findings relevant to natural history, population structure, speciation, and phylogeny.
In: Aida K, Tsukamoto K, Yamauchi K (eds) Eel biology. Springer-Verlag, Tokyo, p 31–48
Avise JC, Helfman GS, Saunders NC, Hales LS (1986) Mito-chondrial DNA differentiation in North Atlantic eels: pop-ulation genetic consequences of an unusual life history pattern. Proc Natl Acad Sci USA 83:4350–4353
Boëtius I, Boëtius J (1989) Ascending elvers, Anguilla
anguilla, from 5 European localities. Analyses of
pigmen-tation stage, condition, chemical composition and energy reserves. Dana 7:1–12
Castonguay M, Hodson PV, Couillard CM, Eckersley MJ, Dutil JD, Verreault G (1994) Why is recruitment of the American eel, Anguilla rostrata, declining in the St. Lawrence River and Gulf? Can J Fish Aquat Sci 51:479–488
Chan IKK, Chan DKO, Lee SC, Tsukamoto K (1997) Genetic variability of the Japanese eel Anguilla japonica (Tem-minck and Schlegel) related to latitude. Ecol Freshw Fish 6:45–49
Chang KC, Han YS, Tzeng WN (2007) Evidence of pan-mictic populations among intra-annual arrival waves of the Japanese eel Anguilla japonica. Zool Stud 46: 583–590
Cheng PW, Tzeng WN (1996) Timing of metamorphosis and estuarine arrival across the dispersal range of the Japanese eel Anguilla japonica. Mar Ecol Prog Ser 131: 87–96
Comparini A, Rizzotti M, Rodinò E (1977) Genetic control and variability of phosphoglucose isomerase (PGI) in eels from the Atlantic Ocean and the Mediterranean Sea. Mar Biol 43:109–116
Daemen E, Cross T, Ollevier F, Volckaert FAM (2001) Analy-sis of the genetic structure of European eel (Anguilla
anguilla) using microsatellite DNA and mtDNA markers.
Mar Biol 139:755–764
Dannewitz J, Maes GE, Johansson L, Wickström H, Volckaert FAM (2005) Panmixia in the European eel: a matter of time. Proc R Soc B Biol Sci 272:1129–1137
De Ligny W, Pantelouris EM (1973) Origin of the European eel. Nature 246:518–519
Dekker W (2003a) Eels in crisis. ICES Newsl 40:10–11 Dekker W (2003b) Did lack of spawners cause the collapse of
the European eel, Anguilla anguilla? Fish Manag Ecol 10: 365–376
Desaunay Y, Guerault D (1997) Seasonal and long-term changes in biometrics of eel larvae: a possible relationship between recruitment variation and North Atlantic eco-system productivity. J Fish Biol 51(Suppl A):317–339 Ellien C, Thiebaut E, Dumas F, Salomon JC, Nival P (2004) A
modeling study of the respective role of hydrodynamic processes and larval mortality on larval dispersal and recruitment of benthic invertebrates: example of
Pecti-naria koreni (Annelida: Polychaeta) in the Bay of Seine
(English Channel). J Plankton Res 26:117–132
Gaines SD, Bertness MD (1992) Dispersal of juveniles and variable recruitment in sessile marine species. Nature 360: 579–580
Gaines SD, Gaylord B, Largier JL (2003) Avoiding current oversights in marine reserve design. Ecol Appl 13:32–46 Gaylord B, Gaines SD (2000) Temperature or transport?
Range limits in marine species mediated solely by flow. Am Nat 155:769–789
Goudet J (1995) FSTAT version 1.2: a computer program to calculate F-statistics. J Hered 86:485–486
Han YS, Liao IC, Huang YS, He JT, Chang CW, Tzeng WN (2003) Synchronous changes of morphology and gonadal development of silvering Japanese eel Anguilla japonica. Aquaculture 219:783–796
Han YS, Sun YL, Liao YF, Shen KN, Liao IC, Tzeng WN (2008) Temporal analysis of population genetic composition in the overexploited Japanese eel Anguilla japonica. Mar Biol 155:613–621
Han YS, Tzeng WN, Liao IC (2009) Time series analysis in the catch of Japanese glass eels: possible effects of the repro-ductive cycle and an El Niño event. Zool Stud 48:632–639 Haro AJ, Krueger WH (1988) Pigmentation, size, and migra-tion of elvers (Anguilla rostrata (Lesueur)) in a coastal Rhode Island stream. Can J Zool 66:2528–2533
Hedgecock D (1994a) Does variance in reproductive success limit effective populations sizes of marine organisms? In: Beaumont AR (ed) Genetics and evolution of aquatic organisms. Chapman & Hall, London, p 122–134
Hedgecock D (1994b) Temporal and spatial genetic structure of marine animal populations in the California Current. CCOFI Rep 35:73–81
Hendry AP, Day T (2005) Population structure attributable to reproductive time: isolation by time and adaptation by time. Mol Ecol 14:901–916
Hurlbert SH (1971) The nonconcept of species diversity: a cri-tique and alternative parameters. Ecology 52:577–586 Ishikawa S, Aoyama J, Tsukamoto K, Nishida M (2001a)
Pop-ulation structure of the Japanese eel Anguilla japonica as examined by mitochondrial DNA sequencing. Fish Sci 67: 246–253
Ishikawa S, Suzuki K, Inagaki T, Watanabe S and others (2001b) Spawning time and place of the Japanese eel,
Anguilla japonica, in the North Equatorial Current of the
western North Pacific Ocean. Fish Sci 67:1097–1103 Kawakami Y, Mochioka N, Kimura R, Nakazono A (1999)
Seasonal changes of the RNA/DNA ratio, size and lipid contents and immigration adaptability of Japanese glass-eels, Anguilla japonica, collected in northern Kyushu, Japan. J Exp Mar Biol Ecol 238:1–19
Maes GE, Volckaert FAM (2002) Clinal genetic variation and isolation by distance in the European eel Anguilla anguilla (L.). Biol J Linn Soc 77:509–521
Maes GE, Pujolar JM, Hellemans B, Volckaert FAM (2006) Evidence for isolation by time in the European eel (Anguilla anguilla L.). Mol Ecol 15:2095–2107
Mantel N (1967) The detection of disease clustering and a generalized regression approach. Cancer Res 27:209–220 Nei M (1983) Genetic polymorphism and the role of mutation in evolution. In: Nei M, Koehn R (eds) Evolution of genes and proteins. Sinauer Associates, Sunderland, MA, p 165–190
Nielsen EE, Hansen MM, Ruzzante DF, Meldrup D, Gronk-jaer P (2003) Evidence of a hybrid-zone in Atlantic cod (Gadus morhua) in the Baltic and the Danish Belt Sea revealed by individual admixture analysis. Mol Ecol 12: 1497–1508
Nitani H (1972) Beginning of the Kuroshio. In: Stommel H, Yoshida K (eds) Kuroshio – its physical aspects. University of Tokyo Press, Tokyo, p 129–163
Palm S, Dannewitz J, Prestegaard T, Wickström H (2009) Panmixia in European eel revisited: no genetic difference between maturing adults from southern and northern Europe. Heredity 103:82–89
Pujolar JM, Maes GE, Volckaert FAM (2006) Genetic patchi-ness among recruits in the European eel Anguilla
anguilla. Mar Ecol Prog Ser 307:209–217
Pujolar JM, Maes GE, Volckaert FAM (2007) Genetic and morphometric heterogeneity among recruits of the Euro-pean eel Anguilla anguilla. Bull Mar Sci 81:297–308 Reveillac E, Feunteun E, Berrebi P, Gagnaire PA,
Lecomte-Finiger R, Bosc P, Robinet T (2008) Anguilla
➤
➤
➤
➤
➤
➤
➤
➤
➤
➤
➤
➤
➤
➤
➤
➤
➤➤
➤
➤
➤
➤➤
➤
➤
➤
➤
➤
➤
➤ ➤➤
➤
➤
➤
marmorata larval migration plasticity as revealed by
otolith microstructural analysis. Can J Fish Aquat Sci 65:2127–2137
Rice WR (1989) Analyzing tables of statistical tests. Evolution 43:223–225
Rousset F (1997) Genetic differentiation and estimation of gene flow from F-statistics under isolation by distance. Genetics 145:1219–1228
Ryman N, Palm S (2006) POWSIM: a computer program for assessing statistical power when testing for genetic differ-entiation. Mol Ecol 6:600–602
Sang TK, Chang HY, Chen CT, Hui CF (1994) Population structure of the Japanese eel Anguilla japonica. Mol Biol Evol 11:250–260
Schmidt J (1925) The breeding places of the eel. Annu Rep Smithson Inst 1924:279–316
Schneider S, Roessli D, Excoffier L (2000) Arlequin: a software for population genetics data analysis, v. 2.000. Genetics and Biometry Laboratory, Department of Anthropology, University of Geneva, Geneva
Selkoe KA, Gaines SD, Caselle JE, Warner RR (2006) Current shifts and kin aggregation explain genetic patchiness in fish recruits. Ecology 87:3082–3094
Shanks AL, Grantham BA, Carr MH (2003) Propagule disper-sal distance and the size and spacing of marine reserves. Ecol Appl 13(Suppl Mar Reserves):159–169
Shen KN, Tzeng WN (2007a) Population genetic structure of the year-round spawning tropical eel, Anguilla
rein-hardtii, in Australia. Zool Stud 46:441–453
Shen KN, Tzeng WN (2007b) Genetic differentiation among populations of the shortfinned eel Anguilla australis from East Australia and New Zealand. J Fish Biol 70 (Suppl B): 177–190
Shinoda A (2004) The ecology of inshore migration of the Japanese eel, Anguilla japonica. PhD thesis, University of Tokyo
Siegel DA, Kinlan BP, Gaylord B, Gaines SD (2003) Lagran-gian descriptions of marine larval dispersion. Mar Ecol Prog Ser 260:83–96
Tesch FW (2003) The eel. Blackwell Science, Oxford Tseng MC, Tzeng WN, Lee SC (2006) Population genetic
structure of the Japanese eel Anguilla japonica in the northwest Pacific Ocean: evidence of non-panmictic pop-ulations. Mar Ecol Prog Ser 308:221–230
Tsukamoto K (1990) Recruitment mechanism of the eel,
Anguilla japonica, to the Japanese coast. J Fish Biol 36:
659–671
Tsukamoto K (1992) Discovery of the spawning area for Japanese eel. Nature 356:789–791
Tsukamoto K (2006) Spawning of eels near a seamount. Nature 439:929
Tsukamoto K, Otake T, Mochioka N, Lee TW and others (2003) Seamounts, new moon and eel spawning: the search for the spawning site of the Japanese eel. Environ Biol Fishes 66:221–229
Tzeng WN (1986) Resources and ecology of the Japanese eel
Anguilla japonica elvers in the coastal waters of Taiwan.
China Fish Mon 404:19–24
Tzeng WN (1990) Relationship between growth rate and age at recruitment of Anguilla japonica elvers in a Taiwan estuary as inferred from otolith growth increments. Mar Biol 107:75–81
Tzeng WN, Tsai YC (1992) Otolith microstructure and daily age of Anguilla japonica Temminck and Schlegel elvers from the estuaries of Taiwan with reference to unit stock and larval migration. J Fish Biol 40:845–857
Umezawa A, Tsukamoto K (1990) Age and birth date of the glass eel, Anguilla japonica, collected in Taiwan. Bull Jpn Soc Sci Fish 56:1199–1201
Van Oosterhout C, Hutchinson WF, Wills DPM, Shipley P (2004) MICRO-CHECKER: software for identifying and correcting genotyping errors in microsatellite data. Mol Ecol Notes 4:535–538
Wan QH, Wu H, Fujihara T, Fang SG (2004) Which genetic marker for which conservation genetics issue? Electro-phoresis 25:2165–2176
Weir BS, Cockerham CC (1984) Estimating F-statistics for the analysis of population structure. Evolution 38:1358–1370 Williams GC, Koehn RK, Mitton JB (1973) Genetic
differenti-ation without isoldifferenti-ation in the American eel, Anguilla
ros-trata. Evolution 27:192–204
Wirth T, Bernatchez L (2001) Genetic evidence against pan-mixia in the European eel. Nature 409:1037–1040 Wirth T, Bernatchez L (2003) Decline of North Atlantic eels: a
fatal synergy? Proc Biol Sci 270:681–688
Zhang DX, Hewitt GM (2003) Nuclear DNA analysis in genetic studies of populations: practice, problems, and prospects. Mol Ecol 12:563–584
Editorial responsibility: Philippe Borsa, Nouméa, New Caledonia
Submitted: April 24, 2009; Accepted: November 16, 2009 Proofs received from author(s): February 9, 2010