S-Methyl cysteine enhanced survival of nerve growth factor differentiated PC12 cells under hypoxic conditions
Chun-lin Liua, Te-chun Hsiab, and Mei-chin Yinc,d,*
aDepartment of Neurosurgery, China Medical University Hospital, Taichung City, Taiwan
bDepartment of Respiratory Therapy, China Medical University, Taichung City, Taiwan
cDepartment of Health and Nutrition Biotechnology, Asia University, Taichung City, Taiwan
dDepartment of Nutrition, China Medical University, Taichung City, Taiwan
running title: SMC protects neural cells
*To whom correspondence should be addressed: Dr. Mei-chin Yin, Professor, Department of Nutrition, China Medical University, 16th Floor, 91, Hsueh-shih Rd., Taichung City, Taiwan
TEL: 886-4-22053366 ext. 7510, FAX: 886-4-22062891 Email: mcyin@ mail.cmu. edu.tw
1 2 3 4 5
7 8 9 10 11 12 13 14 15 16 17 18 19
Abstract
Nerve growth factor-differentiated PC12 cell line was used to investigate the protective effects of s-methyl cysteine (SMC) at 1, 2, 4, 8 M under oxygen-glucose deprivation (OGD) conditions. OGD decreased cell viability; however, SMC pretreatments at 2, 4 and 8 M improved cell viability, decreased cleaved caspase-3 and Bax expression, reserved Bcl-2 expression. Furthermore, SMC maintained mitochondrial membrane potential, lowered intracellular Ca2+ concentration and DNA fragmentation, and decreased activity and expression of caspase-3 and caspase-8. OGD increased reactive oxygen species (ROS) and 3-nitrotyrosine production, decreased glutathione peroxide (GPX) and glutathione reductase (GR) activities and expression, enhanced nitric oxide synthase (NOS) activity and inducible NOS (iNOS) expression. SMC pretreatments at 2, 4 and 8
M lowered ROS and 3-nitrotyrosine formation, maintained GPX and GR activities and expression, and decreased NOS activity and iNOS expression. OGD up-regulated hypoxia-inducible factor (HIF)-1, nuclear transcription factor kappa (NF-) B p50, NF- κB p65 and p-p38 expression. SMC pretreatments at 1-8 M lowered HIF-1 expression and decreased p38 phosphorylation. SMC at 2, 4 and 8 M suppressed protein expression of NF-κB p50 and NF-κB p65. When YC-1 (HIF-1 inhibitor), pyrrolidine dithiocarbamate (NF-κB inhibitor) or SB203580 (p38MAPK inhibitor) was used to block the activation of HIF-1, NF-κB and p38, SMC pretreatments did not affect protein expression of HIF-1, NF-κB and p-p38. These results indicated that SMC was a potent neuro-protective agent.
Keywords: s-Methyl cysteine; Oxygen-glucose deprivation; PC12 cells; p38; NF-kB 1
2 3 4 5 6 7 8 9 10 11 12 13 14 15 16 17 18 19 20 21 22 23
Introduction
The obstruction of blood flow to brain leads to irreversible damage because insufficient blood supply results in oxygen-glucose deprivation (OGD) and causes neuronal apoptosis.1 It has been documented that OGD evokes excessive production of reactive oxygen species (ROS) and reactive nitrogen species (RNS) in neuronal cells, which enhances oxidative stress and initiates apoptotic insult such as activating caspase cascade.2,3 Furthermore, hypoxia or OGD induces mitochondrial depolarization and dysfunction, increases intracellular Ca2+ concentration and activates nuclear transcription factor kappa (NF-) B and mitogen-activated protein kinase (MAPK) signaling pathways in neuronal cells.4-6 Under low oxygen conditions, hypoxia-inducible factor (HIF)-1 is overexpressed and regulates the transcription of several genes associated with cell survival or death.7 It has been reported that HIF-1 exhibits neuroprotective or neurotoxic effects depending on the type of cellular stress.8,9 Thus, any agent with the ability to attenuate oxidative injury, regulate HIF-1, MAPK or NF-B under OGD conditions may benefit neural cell survival.
s-Methyl cysteine (SMC) is a hydrophilic cysteine-containing compound naturally formed in Allium plants such as garlic and onion.10 Our previous study reported that pre- intake of this agent retarded glutathione and dopamine depletion, maintained glutathione peroxidase activity, and decreased inflammatory cytokines in striatum of Parkinson’s-like mice.11 The study of Wassef et al.12 found that dietary SMC supplementation could prevent Parkinson’s-like syndromes in Drosophila via its anti-oxidative effects. Ishiwata et al.13 reported that SMC could increase extracellular level of D-serine, a co-agonist of N- methyl D-aspartate receptor (NMDAR), in frontal cortex of rat. D-serine participates in regulating NMDAR-mediated synaptic transmission.14 Those previous studies suggest that SMC is a potent protective agent for brain and neural system. However, it remains 1
2 3 4 5 6 7 8 9 10 11 12 13 14 15 16 17 18 19 20 21 22 23 24 25
unknown that SMC could enhance neural cell survival under hypoxic conditions. It is also unclear whether this agent could attenuate oxidative stress, stabilize mitochondrial membrane or regulate NF-B and MAPK pathways for neural cells against OGD-induced damage.
The nerve growth factor (NGF)-differentiated PC12 cell line has been widely used as an in vitro ischemic model to investigate the impact of OGD upon cell apoptosis.15 It is also commonly used to examine neural protective effects and action modes of certain compounds.16 The present study used this cell line to investigate the protection of SMC under OGD conditions. The effects of this agent at various doses upon cell viability, calcium release, mitochondrial membrane potential and oxidative stress were examined.
Furthermore, the regulation of this agent upon HIF-1, NF-B and MAPK was also evaluated in order to understand the possible action modes.
Materials and Methods
Chemicals
Medium, plates, antibiotics and chemicals used for cell culture were purchased from Difco Laboratory (Detroit, MI, USA). NGF was purchased from Promega Co. (Madison, WI, USA). Fura-2 acetoxymethyl ester (Fura-2AM), Rhodamine 123 (Rh123) and SMC were purchased from Sigma Chemical Co. (St. Louis, MO, USA). YC-1 (HIF-1
inhibitor), pyrrolidine dithiocarbamate (PDTC, NF-κB inhibitor) and SB203580 (p38MAPK inhibitor) were purchased from Cell Signaling Technology (Boston, MA, USA). All chemicals used in these measurements were of the highest purity commercially available.
Cell culture
PC12 cells were cultured in 35 mm dish containing Dulbecco’s modified Eagle’s 1
2 3 4 5 6 7 8 9 10 11 12 13 14 15 16 17 18 19 20 21 22 23 24 25
medium (DMEM) supplemented with 10% heat-inactivated calf serum and 5% fetal bovine serum under 95% air/ 5% CO2 at 37°C. PC12 cells were treated with NGF (50 ng/ml) and allowed to differentiate for 5 days. The culture medium was changed every three days and cells were subcultured once a week. The medium was changed to serum-deprived medium and cells were washed with serum-free DMEM 24 hr before experiments and replanted in 96 well plates.
OGD model
Our preliminary data showed that 2, 3 or 4 hr incubation resulted in 42, 71 and 98%
incorporation of SMC into cells; and lower SMC incorporation led to less protective effects. Thus, 4 hr incubation was used for present study. PC12 cells (105 cells/ml) were treated with DMEM containing SMC (0, 1, 2, 4 or 8 M) for 4 hr. After washing cells twice with glucose-free DMEM, cells were incubated in this glucose-free DMEM in an oxygen-free incubator (95% N2 and 5% CO2) for 2 hr. Then, cells were returned to the normal culture medium and incubated under normal growth condition for additional 24 hr.
PC12 cells without SMC treatment and incubated under normal growth condition was control groups. In order to clarify the role of SMC on HIF-1, NF-κB and p38, cells were pretreated with 10 M inhibitor for 60 min before exposure to OGD.
3-(4,5-Dimethylthiazol-2-yl)-2,5-diphenyltetrazolium bromide (MTT) assay
MTT assay was performed to examine cell viability. Briefly, PC12 cells (105 cells/ml) were incubated with 0.25 mg MTT/ml for 3 hr at 37°C. The amount of MTT formazan product was determined by measuring absorbance at 570 nm (630 nm as a reference) using a microplate reader (Bio-Rad, Hercules, CA, USA). Cell viability was expressed as a percent of control groups.
Lactate dehydrogenase (LDH) assay
The plasma membrane damage of PC12 cells (105 cells/ml) was evaluated by 1
2 3 4 5 6 7 8 9 10 11 12 13 14 15 16 17 18 19 20 21 22 23 24 25
measuring the amount of intracellular LDH in the medium. Fifty l of culture supernatants were collected from each well. LDH activity (U/l) was determined by a colorimetric LDH assay kit (Sigma Chemical Co., St. Louis, MO, USA).
Measurement of mitochondrial membrane potential (MMP)
MMP was monitored by using fluorescent dye Rh123. After incubation with SMC under OGD condition, PC12 cells (105 cells/ml) were centrifuged at 1200 xg for 5 min and resuspended in DMEM. Rh123 (100 g/l) was added to PC12 cells for 45 min at 37°C.
Cells were collected and washed twice with PBS. The mean fluorescence intensity (MFI) in cells was analyzed by a flow cytometry (Beckman-FC500, Beckman Coulter, Fullerton, CA, USA).
Determination of intracellular Ca2+ concentration
The intracellular Ca2+ concentration was determined by using Fura-2AM, a Ca2+- sensitive dye, to measure the fluorescent intensity according to the method of Lenart et al.17 Briefly, cells (105 cells/ml) were loaded with Fura-2AM (final concentration 5 mmol/l), 0.1% DMSO and 1% BSA for 30 min at room temperature in dark condition, and followed by incubating at 37°C for 30 min. Fluorescence was determined by a spectrofluorimeter (Shimadzu, Model RF-5000, Kyoto, Japan) with excitation at 340 and 380 nm, and the emission at 510 nm. Calcium concentration was obtained by converting fluorescence ratio according to the equation: [Ca2+] (nM) = Kd×[(R–Rmin)/(Rmax–
R)]×FD/FS, in which Kd was 224 nM, R was 340:380 ratio, Rmax was determined by treating cells with triton X-100, Rmin was determined by treating cells with ethylene glycol tetraacetic acid, FD was the fluorescence of the Ca2+-free form and FS was the fluorescence of the Ca2+-bound form at excitation wavelengths of 380 and 340 nm, respectively.
Measurement of DNA fragmentation 1
2 3 4 5 6 7 8 9 10 11 12 13 14 15 16 17 18 19 20 21 22 23 24 25
Cell death detection ELISA plus kit (Roche Molecular Biochemicals, Mannheim, Germany) was used to quantify DNA fragmentation. PC12 cells (105 cells/ml) were lysed in 50 ml of cold lysis buffer for 30 min at room temperature and followed by centrifugation at 200 xg for 10 min. Then, 20 l supernatant was transferred onto the streptavidin-coated plate, and 80 l freshly prepared immunoreagent was added to each well and incubated for 2 hr at room temperature. After washing with PBS, substrate solution was added and incubated for 15 min. The absorbance at 405 nm (reference wavelength 490 nm) was measured using a microplate reader. DNA fragmentation was expressed as the enrichment factor using the following equation: enrichment factor = (absorbance of the sample) / (absorbance of the control).
Measurement of caspases activity
Activity of caspase-3 and -8 was detected by using fluorometric assay kits (Upstate, Lake Placid, NY, USA) according to the manufacturer’s protocol. The intra-assay CV was 3.3-4.2%, and the inter-assay CV was 5.4-6.5%. In brief, control or treated cells (105 cells/ml) were lysed and incubated in ice for 10 min. Fifty μl cell lysate was mixed with 50 ml of reaction buffer and 5 ml of fluorogenic substrates specific for caspase-3 or -8 in a 96-well microplate. After incubation at 37°C for 1 hr, fluorescent activity was measured using a fluorophotometer with excitation at 400 nm and emission at 505 nm. Data were expressed as a percentage of control groups.
ROS and DNA oxidation assay
Cells (105 cells/ml) were washed and homogenized. The dye DCFH2-DA was used to measure ROS level (nmol/mg protein) according to the method of Fu et al.18 After incubating with 50 mol/l dye for 30 min and washing with PBS, cell suspension was centrifuged at 412 xg for 10 min. Then, the medium were removed and cells were dissolved with 1% Triton X-100. Fluorescence changes were measured at an excitation 1
2 3 4 5 6 7 8 9 10 11 12 13 14 15 16 17 18 19 20 21 22 23 24 25
wavelength of 485 nm and an emission wavelength of 530 nm using a fluorescence microplate reader. DNA fractions were obtained using a DNA Extractor WB kit (Wako Pure Chemical Industries Ltd., Tokyo, Japan), and oxidative damage was determined using an ELISA kit (OXIS Health Products Inc, Portland, OR, USA) for 8-OHdG (ng/mg protein).
Analyses for glutathione (GSH), oxidized glutathione (GSSG) and activity of glutathione peroxidase (GPX), glutathione reductase (GR)
Cells (105 cells/ml) were washed twice with PBS, then were scraped from the plates and followed by homogenizing in 20 mM PBS containing 0.5 mM butylated hydroxytoluene to prevent further oxidation. The homogenate was centrifuged at 3000 xg for 20 min at 4°C, and the supernatant was used for these assays according to the manufacturer’s instructions. GSH and GSSG concentrations (ng/mg protein) were determined by commercial colorimetric GSH and GSSG assay kits (OxisResearch, Portland, OR, USA). The activity (U/mg protein) of GPX and GR in PC12 cells was determined by using assay kits (EMD Biosciences, San Diego, CA, USA).
Nitrite assay, 3-nitrotyrosine level and nitric oxide synthase (NOS) activity
The production of nitric oxide was determined by measuring the formation of nitrite.
Briefly, 100 μl supernatant was treated with nitrate reductase, NADPH and FAD, and followed by incubating for 1 hr at 37°C in the dark. After centrifuging at 6,000 xg, the supernatant was mixed with Griess reagent for color development. The absorbance at 540 nm was measured and compared with a sodium nitrite standard curve. 3-nitrotyrosine level (nmol/mg protein) was measured by a commercial assay kit (Northwest Life Science Specialties (Vancouver, WA, USA). The method described in Sutherland et al.19 was used to measure total NOS activity (pmol/min/mg protein) by incubating 30 μl homogenate with 10 mM NADP, 10 mM L-valine, 3000 U/ml calmodulin, 5 mM tetrahydrobiopterin, 1
2 3 4 5 6 7 8 9 10 11 12 13 14 15 16 17 18 19 20 21 22 23 24 25
10 mM CaCl2, and a mixture of 100 μM L-arginine containing L-[3H]arginine.
Preparation of cytosolic and nuclear fractions
Cells (105 cells/ml) were suspended in ice-cold buffer A containing 10 mM HEPES, pH 7.9, 1.5 mM MgCl2, 10 mM KCl, 0.5 mM DTT, 0.5 mM phenylmethylsulfonyl fluoride (PMSF), 1 mg/ml of leupeptin, and 1 mg/m of aprotinin for 15 min. Cytosolic fractions were collected after centrifugation at 14,000 xg for 1 min at 4°C. The remaining nuclear pellets were resuspended in buffer B containing 20 mM HEPES, pH 7.9, 1.5 mM MgCl2, 450 mM NaCl, 25% glycerol, 0.2 mM EDTA, 0.5 mM DTT, 0.5 mM PMSF, 1 mg/ml of leupeptin and 1 mg/ml of aprotinin for 30 min. The final nuclear fractions were collected after centrifugation at 14,000 xg for 15 min at 4°C.
Western blot analysis
Sample at 40 μg protein was applied to 10% SDS-polyacrylamide gel electrophoresis, and transferred to a nitrocellulose membrane (Millipore, Bedford, MA, USA) for 1 hr.
After blocking with a solution containing 5% nonfat milk for 1 hr to prevent non-specific binding of antibody, membrane was incubated with anti-caspase-3, anti-caspase-8, anti- cleaved caspase-3 (1:1000), anti-Bcl-2 (1:2000), anti-Bax (1:1000), anti-GPX, anti-GR, anti-iNOS (1:500), anti-HIF-1, anti-NF-κB p65, anti-NF-κB p50 (1:1000), anti-p38, anti- p-p38, anti-JNK, anti-p-JNK, anti-ERK1/2 and anti-p-ERK1/2 (1:2000) monoclonal antibody (Boehringer-Mannheim, Indianapolis, IN, USA) at 4ºC overnight, and followed by reacting with horseradish peroxidase-conjugated antibody for 3.5 hr at room temperature. The detected bands were quantified by an image analyzer (ATTO, Tokyo, Japan) and glyceraldehyde-3-phosphatedehydrogenase (GAPDH) was used as a loading control. The blot was quantified by densitometric analysis. Results were normalized to GAPDH, and given as arbitrary units (AU).
Statistical analysis 1
2 3 4 5 6 7 8 9 10 11 12 13 14 15 16 17 18 19 20 21 22 23 24 25
The effect of each treatment was analyzed from ten different preparations (n=10).
Data were reported as means standard deviation (SD), and subjected to analysis of variance. Differences among means were determined by the Least Significance Difference Test with significance defined at p<0.05.
Results
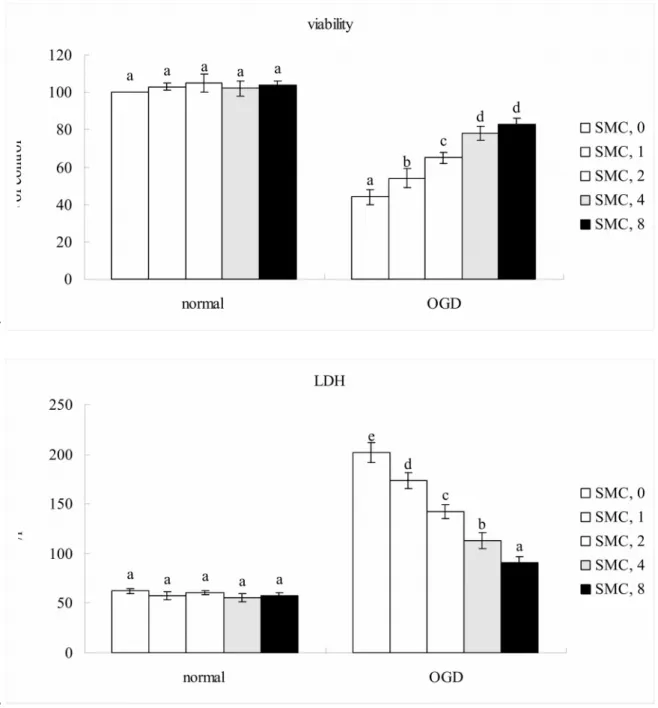
Under normal incubation condition, SMC did not affect viability and LDH release (Figure 1, p>0.05). Thus, SMC treated PC12 cells followed by normal incubation condition were not used for further analyses. OGD led to 44% cell viability and increased 3.5 folds LDH release. Compared with OGD treatment alone, SMC pretreatments at 1-8
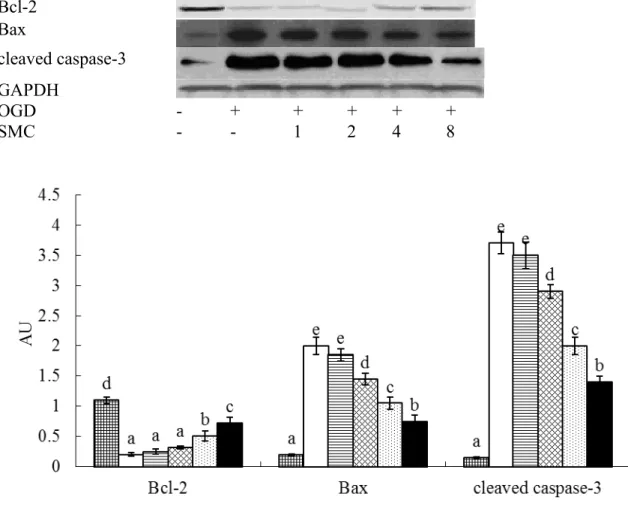
M led to 54-83% cell viability (p<0.05), and dose-dependently decreased LDH activity (p<0.05). OGD down-regulated Bcl-2 expression, and up-regulated protein production of Bax and cleaved caspase-3 (Figure 2, p<0.05). SMC pretreatments at 2, 4 and 8 M decreased 16-67% cleaved caspase-3 expression and 28-63% Bax expression (p<0.05), SMC only at 4 and 8 M raised 27-47% Bcl-2 expression (p<0.05).
OGD reduced MMP, increased Ca2+ release and DNA fragmentation (Table 1, p<0.05). SMC pretreatments at 1-8 M maintained MMP, lowered intracellular Ca2+
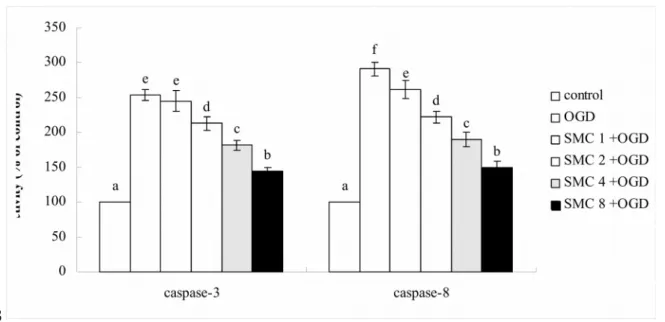
release and DNA fragmentation (p<0.05). OGD raised activity and expression of caspase- 3 and caspase-8 (Figure 3, p<0.05). SMC pretreatments at 2, 4 and 8 M decreased 26- 71% activity and 35-69% expression of caspase-3 (p<0.05), but dose-dependently reduced 24-83% activity and 32-80% expression of caspase-8 (p<0.05).
OGD increased ROS, GSSG and 8-OHdG production, lowered GSH level, and decreased GPX and GR activities (Table 2, p<0.05). SMC pretreatments at 1-8 M retained GSH level, reduced ROS and GSSG formation (p<0.05). SMC at 2, 4 and 8 M lowered 8-OHdG generation, and maintained GPX and GR activities (p<0.05). OGD 1
2 3 4 5 6 7 8 9 10 11 12 13 14 15 16 17 18 19 20 21 22 23 24 25
enhanced NOS activity, and increased NO and 3-nitrotyrosine production (Table 3, p<0.05); SMC pretreatments at 2, 4 and 8 M diminished NOS activity, and decreased NO and 3-nitrotyrosine levels (p<0.05). OGD suppressed GPX and GR expression, and raised iNOS expression (Figure 4, p<0.05). SMC pretreatments at 2, 4 and 8 M maintained 23- 59% GPX expression and 26-74% GR expression, as well as decreased 31-58% iNOS expression.
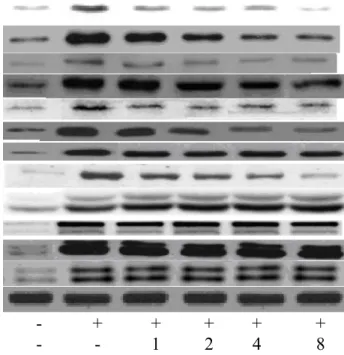
OGD enhanced cytosolic HIF-1, NF-κB p50 and NF-κB p65 expression (Figure 5, p<0.05); and SMC pretreatments suppressed these expressions (p<0.05). OGD also up- regulated nuclear HIF-1, NF-κB p50, NF-κB p65 and p-p38 expression (Figure 5, p<0.05). SMC pretreatments at 1-8 M lowered 21-76% HIF-1 expression, and 22-68%
p38 phosphorylation (p<0.05). SMC at 2, 4 and 8 M attenuated protein expression of NF-κB p50 and NF-κB p65 (p<0.05). SMC at test doses failed to affect phosphorylation of JNK and ERK1/2 (p>0.05). As shown in Figure 6, YC-1, PDTC or SB203580 blocked the activation of HIF-1, NF-κB and p38; and SMC pretreatments did not affect protein expression of these factors (p>0.05). These inhibitors significantly restored cell viability, and decreased ROS and NO production when compared with OGD treatment alone (Table 4, p<0.05). SMC treatments, under the presence of inhibitors, did not affect cell viability, and ROS or NO formation (p>0.05).
Discussion
OGD activated signaling pathways, evoked oxidative stress, and caused apoptosis in neural cells.20,21 Our present study found that SMC pretreatments markedly protected NGF-treated PC12 cells against subsequent OGD induced injury and enhanced cell survival. These findings implied that SMC was a preventive agent to protect neural cells against hypoxic injury.
1 2 3 4 5 6 7 8 9 10 11 12 13 14 15 16 17 18 19 20 21 22 23 24 25
Bax and caspase-3 are pro-apoptotic molecules; Bcl-2 is an anti-apoptotic molecule.
In our present study, SMC at 2, 4 and 8 M down-regulated Bax and cleaved caspase-3 production, and retained Bcl-2 expression in PC12 cells under OGD conditions, which in turn diminished apoptotic injury and benefited cell survival. These results suggested that this compound could penetrate into NGF-treated PC12 cells, and mitigate apoptotic stress under OGD conditions by regulating both anti-apoptotic and pro-apoptotic molecules.
OGD disrupted mitochondrial membrane permeability and increased Ca2+ release in neural cells, which consequently triggered the apoptotic process.22,23 White et al.24 reported that excessive Ca2+ activated Ca2+-dependent catabolic enzymes such as caspase cascades, and caused neuronal injury. Loss of mitochondrial membrane potential could activate caspases including caspase-3 and caspase-8.25 These two caspases could act as apoptotic executors responsible for cell death because they directly affected cell morphological changes and the cleavage of nuclear proteins.26 In our present study, SMC pretreatments maintained mitochondrial membrane potential, decreased intracellular Ca2+ concentration, and repressed activity and protein expression of caspase-3 and caspase-8 in NGF-treated PC12 cells. Since SMC retarded those adverse events caused by OGD, the lower LDH activity and greater viability in SMC treated PC12 cells under OGD conditions could be explained.
Oxidative stress is a crucial factor contributed to OGD induced neuronal cell death.2,3 We found that SMC pretreatments effectively decreased ROS and GSSG formation, retained GSH content, and preserved activity and expression of GPX and GR in PC12 cells under OGD conditions. Apparently, SMC was able to diminish OGD evoked oxidative stress in NGF-treated PC12 cells via enhancing glutathione redox cycle. 8-OHdG is a marker of DNA oxidative damage. Increased DNA fragmentation and 8-OHdG generation in OGD-treated PC12 cells as we observed indicated that nuclear components of these cells were impaired. However, SMC pretreatments at 2-8 M attenuated OGD induced DNA 1
2 3 4 5 6 7 8 9 10 11 12 13 14 15 16 17 18 19 20 21 22 23 24 25
fragmentation and 8-OHdG production. These data suggest that SMC could penetrate into cells and protect DNA and nuclear components in these cells. Esposito et al.27 reported that the expression of iNOS was up-regulated under cerebral ischemic conditions, which promoted oxidative and inflammatory injury, even led to cell death. In our present study, SMC pretreatments at 2-8 M lowered NO and 3-nitrotyrosine overproduction, declined NOS activity and iNOS expression, which consequently mitigated RNS related oxidative stress. In addition, increased ROS are responsible for Ca2+ release in neural cells.28 Since ROS and RNS levels have been reduced, the decreased Ca2+ release and greater viability in SMC-treated PC12 cells could be explained. Thus, the observed protection from SMC in NGF-treated PC12 cells against OGD could be ascribed to its anti-oxidative activities.
OGD enhances the expression of HIF-1 and NF-B, and promotes their translocation from cytosol to nucleus.29,30 We found that SMC pretreatments lowered OGD induced expressions of HIF-1 and NF-B in both cytosolic and nuclear fractions.
Apparently, SMC was an effective inhibitory agent upon the activation of HIF-1 and NF-
B, two key transcription factors. It is reported that the activation of HIF-1, NF-B and MAPK pathways from OGD elicits the generation of oxidative and apoptotic factors, and finally facilitates cell death.31,32 Lu et al.28 indicated that attenuating p38 signaling could reduce OGD associated neuronal cell death in rat hippocampal neurons. In our present study, SMC dose-dependently suppressed nuclear HIF-1 expression; and at 2-8 M limited p38 phosphorylation and nuclear NF-B expression in OGD-treated PC12 cells.
Therefore, the observed improvement from SMC upon cell survival against OGD could be explained as its suppressive effects upon the activation of HIF-1, p38 and NF-B. On the other hand, the presence of YC-1, PDTC and SB203580 blocked the regulation of SMC upon HIF-1, p38 and NF-B expression, counteracted the OGD-induced cytotoxicity, and decreased ROS and NO production. These findings once again agreed that these pathways 1
2 3 4 5 6 7 8 9 10 11 12 13 14 15 16 17 18 19 20 21 22 23 24 25
were essential for SMC to execute its protective actions. Under the presence of inhibitors, the slight decrease in ROS or NO levels from SMC treatments might be simply due to SMC’s anti-oxidative activity. In addition, HIF-1 and NF-B are key factors responsible for the production of iNOS and NO.29,33 Since SMC down-regulated the expression of HIF-1 and NF-B, it was reasonable to observe the lower iNOS expression and NO formation.
SMC is a cysteine derivative, and naturally occurs in many plant foods such as garlic and onion. Our previous study reported that dietary SMC intake increased GSH content in mice striatum.11 Thus, the consumption of SMC or foods rich in this compound may be safe and beneficial for neuronal protection. Although we found SMC exhibited substantial protective activities against OGD in NGF-differentiated PC12 cells, this present study was based on a cell line model. So far, the information regarding the availability and effects of this compound in brain from dietary intake is limited. Thus, further animal hypoxic study is necessary to examine the deposit, protective effects, action modes and dosage safety of this compound in brain before it is applied for human.
In conclusion, our present study found SMC pretreatments at 2-8 M markedly enhanced NGF-differentiated PC12 cells survival under OGD conditions. SMC decreased OGD induced oxidative and apoptotic stress via suppressing HIF-1, NF-B and p38 activation, decreasing ROS and RNS production, and stabilizing mitochondrial membrane.
These results suggested that SMC might be a potent neuro-protective agent against hypoxic injury.
Conflict of interest statement None
1 2 3 4 5 6 7 8 9 10 11 12 13 14 15 16 17 18 19 20 21 22 23 24 25
Acknowledgement
This study was partially supported by a grant from China Medical University, Taichung City, Taiwan (CMU102-ASIA-01).
1 2 3
Fig. 1. Effects of SMC upon cell viability determined by MTT assay and plasma
membrane damage determined by LDH assay. NGF differentiated-PC12 cells were pretreated with SMC at 0, 1, 2, 4 or 8 M for 4 hr and followed by incubation under normal or OGD conditions. Control groups were cells containing no SMC and incubated under normal conditions. Data are meanSD (n=10). a-eMeans among bars without a common letter differ, p<0.05.
1 2 3 4 5 6
7
8
Fig. 2. Effects of SMC upon Bcl-2, Bax and cleaved caspase-3 expression determined by
western blot analyses. NGF differentiated-PC12 cells were pretreated with SMC at 0, 1, 2, 4 or 8 M for 4 hr and followed by incubation under OGD conditions. Control groups were cells containing no SMC and incubated under normal conditions. Data are meanSD (n=10). a-eMeans among bars without a common letter differ, p<0.05.
Bcl-2 Bax
cleaved caspase-3 GAPDH
OGD - + + + + +
SMC - - 1 2 4 8
1 2 3 4 5 6
7
Table 1
Effects of SMC upon MMP determined as MFI, Ca2+ release and DNA fragmentation determined as enrichment factor. NGF differentiated-PC12 cells were pretreated with SMC at 0, 1, 2, 4 or 8 M for 4 hr and followed by incubation under OGD conditions.
Control groups were cells containing no SMC and incubated under normal conditions.
Data are meanSD (n=10).
MFI [Ca2+], nM enrichment factor
Control 100e 48463a 1.00a
OGD 522a 1877154e 2.230.15e
SMC 1 +OGD 593b 1652100d 1.970.10d
SMC 2+OGD 714c 1273122c 1.700.08c
SMC 4+OGD 833d 92589b 1.430.12b
SMC 8+OGD 854d 81857b 1.340.06b
a-eMeans in a column without a common letter differ, p<0.05.
1 2 3 4 5 6
7
Fig. 3. Effects of SMC upon caspase-3 and caspase-8 activity (a) and protein expression
(b). NGF differentiated-PC12 cells were pretreated with SMC at 0, 1, 2, 4 or 8 M for 4 hr and followed by incubation under OGD conditions. Control groups were cells containing no SMC and incubated under normal conditions. Data are meanSD (n=10). a-
fMeans among bars without a common letter differ, p<0.05.
3a.
1 2 3 4 5 6 7
8
3b.
Caspase-3 Caspase-8 GAPDH
OGD - + + + + +
SMC - - 1 2 4 8
1
2
Table 2
Effects of SMC upon level of ROS (nmol/mg protein), GSSG (ng/mg protein), GSH (ng/mg protein), 8-OHdG (ng/mg protein), and activity of GPX and GR (U/mg protein). NGF differentiated-PC12 cells were pretreated with SMC at 0, 1, 2, 4 or 8 M for 4 hr and followed by incubation under OGD conditions. Control groups were cells containing no SMC and incubated under normal conditions. Data are meanSD (n=10).
ROS GSSG GSH 8-OHdG GPX GR
Control 0.190.04a 0.880.09a 935f 0.510.11a 69.11.9e 65.22.1e OGD 1.380.21e 2.400.19f 412a 2.020.18e 38.50.8a 34.90.7a SMC 1+OGD 1.130.15d 2.050.12e 483b 1.950.07e 40.21.3a 36.00.9a SMC 2+OGD 1.030.07d 1.790.08d 594c 1.620.12d 48.31.2b 40.61.1b SMC 4+OGD 0.750.10c 1.510.13c 704d 1.280.09c 56.41.5c 47.51.4c SMC 8+OGD 0.460.08b 1.190.10b 823e 0.970.06b 58.71.2d 54.81.3d
a-fMeans in a column without a common letter differ, p<0.05.
1 2 3 4 5 6
7
Table 3
Effects of SMC upon NO level (mmol/mg protein), 3-nitrotyrosine level (nmol/mg protein) and NOS activity (pmol/min/mg protein). NGF differentiated-PC12 cells were pretreated with SMC at 0, 1, 2, 4 or 8 M for 4 hr and followed by incubation under OGD conditions. Control groups were cells containing no SMC and incubated under normal conditions. Data are meanSD (n=10).
NO 3-nitrotyrosine NOS
Control 3.410.28a 0.110.03a 2.110.19a
OGD 24.051.59e 0.860.08e 11.580.87e
SMC 1 +OGD 22.901.07e 0.800.05e 10.840.96e
SMC 2+OGD 19.370.55d 0.650.04d 8.820.45d
SMC 4+OGD 15.080.61c 0.500.06c 6.900.32c
SMC 8+OGD 11.850.43b 0.320.05b 5.140.26b
a-eMeans in a column without a common letter differ, p<0.05.
1 2 3 4 5 6
7 8
Fig. 4. Effects of SMC upon GPX, GR and iNOS expression determined by western
blot analyses. NGF differentiated-PC12 cells were pretreated with SMC at 0, 1, 2, 4 or 8 M for 4 hr and followed by incubation under OGD conditions. Control groups were cells containing no SMC and incubated under normal conditions. Data are meanSD (n=10). a-eMeans among bars without a common letter differ, p<0.05.
GPX GR iNOS GAPDH
OGD - + + + + +
SMC - - 1 2 4 8
1 2 3 4 5 6
7
8
Fig. 5. Effects of SMC upon HIF-1, NF-κB p50, NF-κB p65 and MAPK expression determined by western blot analyses. NGF differentiated-PC12 cells were pretreated with SMC at 0, 1, 2, 4 or 8 M for 4 hr and followed by incubation under OGD conditions. Control groups were cells containing no SMC and incubated under normal conditions. Data are meanSD (n=10). a-fMeans among bars without a common letter differ, p<0.05.
HIF-1 (cytosolic) HIF-1 (nuclear) NF-κB p50 (cytosolic) NF-κB p50 (nuclear) NF-κB p65 (cytosolic) NF-κB p65 (nuclear) p38
p-p38 JNK p-JNK ERK1/2 p-ERK1/2 GAPDH
OGD - + + + + +
SMC - - 1 2 4 8
1 2 3 4 5 6 7
1
2
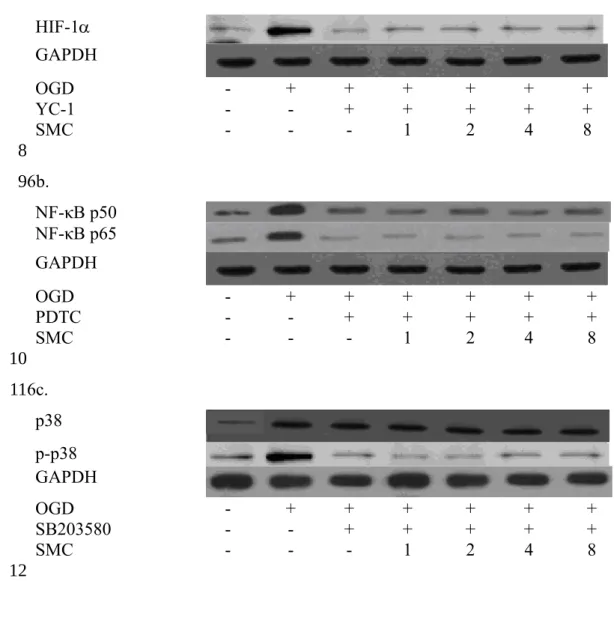
Fig. 6. Effects of SMC upon nuclear expression of HIF-1 (a), NF-κB (b) and p38 (c) with the presence of inhibitor. NGF differentiated-PC12 cells were pretreated with SMC at various doses for 4 hr, and 10 M YC-1 (HIF-1 inhibitor), PDTC (NF-κB inhibitor) or SB203580 (p38 inhibitor) for 1 hr, and incubated under OGD conditions. Control groups were cells containing no SMC and incubated under normal conditions. Data are meanSD (n=10).
6a.
HIF-1
GAPDH
OGD - + + + + + +
YC-1 - - + + + + +
SMC - - - 1 2 4 8
6b.
NF-κB p50 NF-κB p65 GAPDH
OGD - + + + + + +
PDTC - - + + + + +
SMC - - - 1 2 4 8
6c.
p38 p-p38 GAPDH
OGD - + + + + + +
SB203580 - - + + + + +
SMC - - - 1 2 4 8
1 2 3 4 5 6 7
8 9
10 11
12
Table 4
Effects of SMC upon cell viability (%), ROS (nmol/mg protein) and NO (mmol/mg protein) levels under the presence of inhibitor. NGF differentiated-PC12 cells were pretreated with SMC at various doses for 4 hr, and 10 M YC-1 (HIF-1 inhibitor), PDTC (NF-κB inhibitor) or SB203580 (p38 inhibitor) for 1 hr, and incubated under OGD conditions. Control groups were cells containing no SMC and incubated under normal conditions. Data are meanSD (n=10).
viability ROS NO
Control 1002c 0.170.03a 3.270.18a
OGD 434a 1.420.15c 24.111.34c
YC-1+OGD 873b 0.350.08b 7.620.42b
SMC, 1 855b 0.310.02b 7.330.36b
SMC, 2 884b 0.290.05b 7.210.38b
SMC, 4 904b 0.300.06b 7.170.40b
SMC, 8 873b 0.280.03b 7.100.35b
PDTC+OGD 924b 0.430.07b 7.580.43b
SMC, 1 935b 0.330.04b 7.050.39b
SMC, 2 915b 0.300.02b 6.890.29b
SMC, 4 913b 0.320.06b 6.940.32b
SMC, 8 932b 0.310.05b 6.750.24b
SB203580+OGD 854b 0.320.03b 7.030.37b
SMC, 1 864b 0.300.02b 7.130.30b
SMC, 2 883b 0.290.04b 6.830.27b
SMC, 4 865b 0.280.05b 6.720.32b
SMC, 8 882b 0.290.03b 6.950.36b
a-cMeans in a column without a common letter differ, p<0.05.
1 2 3 4 5 6 7
8 9
References
1 K. Kitagawa, J. Neurosci. Res., 2012, 90, 1043-1054.
2 T. Sugawara and P.H. Chan, Antioxid. Redox Signal., 2003, 5, 597-607.
3 I. Olmez and H. Ozyurt, Neurochem. Int., 2012, 60, 208-212.
4 A. Sanchez, D. Tripathy, X. Yin, K. Desobry, J. Martinez, J. Riley, D. Gay, J. Luo and P. Grammas, J. Alzheimers. Dis., 2013, 32, 587-597.
5 C.C. Chio, J.W. Lin, H.A. Cheng, W.T. Chiu, Y.H. Wang, J.J. Wang, C.H. Hsing and R.M. Chen, Arch. Toxicol., 2013, 87, 459-468.
6 W. Yin, L. Ma, J. Zhang, K. Huang, Q. Yang, Y.Y. Guo, S.B. Liu, Y.H. Liu and Y.M.
Wu, CNS Neurosci. Ther., 2013, 19, 145-153.
7 N. Singh, G. Sharma and V. Mishra, Cell Mol. Neurobiol., 2012, 32, 491-507.
8 X. Fan, C.J. Heijnen, M.A. van der Kooij, F. Groenendaal and F. van Bel, Brain Res.
Rev., 2009, 62, 99-108.
9 S.H. Yeh, L.C. Ou, P.W. Gean, J.J. Hung and W.C. Chang, Brain Pathol., 2011, 21, 249-262.
10 M.G. Jones, J. Hughes, A. Tregova, J. Milne, A.B. Tomsett and H.A. Collin, J. Exp.
Bot., 2004, 55, 1903-1918.
11 C.M. Chen, M.C. Yin, C.C. Hsu and T.C. Liu, Nutrition, 2007, 23, 589-597.
12 R. Wassef, R. Haenold, A. Hansel, N. Brot, S.H. Heinemann and T. Hoshi, J.
Neurosci., 2007, 27, 12808-12816.
13 S. Ishiwata, S. Ogata, A. Umino, H. Shiraku, Y. Ohashi, Y. Kajii and T. Nishikawa, Amino Acids, 2013, 44, 1391-1395.
14 S.A. Fuchs, C.M. Peeters-Scholte, M.M. de Barse, M.W. Roeleveld, L.W. Klomp, R.
Berger and T.J. de Koning, Amino Acids, 2012, 43, 355-363.
1 2 3 4 5 6 7 8 9 10 11 12 13 14 15 16 17 18 19 20 21 22 23 24
15 B.J. McCranor, R.A. Bozym, M.I. Vitolo, C.A. Fierke, L. Bambrick, B.M. Polster, G. Fiskum and R.B. Thompson, J. Bioenerg. Biomembr., 2012, 44, 253-263.
16 S.J. Tsai, C.Y. Lin, M.C. Mong, M.W. Ho and M.C. Yin, J. Agric. Food Chem., 2010, 58, 7104-7108.
17 B. Lenart, D.B. Kintner, G.E. Shull and D. Sun, J. Neurosci., 2004, 24, 9585-9597.
18 W. Fu, H. Luo, S. Parthasarathy and M.P. Mattson, Neurobiol. Dis., 1998, 5, 229- 243.
19 B.A. Sutherland, O.M. Shaw, A.N. Clarkson, D.N. Jackson, I.A. Sammut and I.
Appleton, FASEB J., 2005, 19, 258-260.
20 M.T. Rizzo and H.A. Leaver, Mol. Neurobiol., 2010, 42, 52-63.
21 M.D. Martín-de-Saavedra, L. del Barrio, N. Cañas, J. Egea, S. Lorrio, E. Montell, J.
Vergés, A.G. García and M.G. López, Neurochem. Int., 2011, 58, 676-683.
22 Y.M. Leung, BioMedicine, 2011, 1, 16-20.
23 Z. Mo, Y. Fang, Y. He and X. Ke, Cell Biol. Int., 2012, 36, 1043-1048.
24 B.C. White, J.M. Sullivan, D.J. DeGracia, B.J. O'Neil, R.W. Neumar, L.J. Grossman, J.A. Rafols and G.S. Krause, J. Neurol. Sci., 2000, 179, 1-33.
25 S.M. Cardoso, A.C. Rego, N. Penacho and C.R. Oliveira, Neurochem. Int., 2004, 45, 693-698.
26 A.M. Sharifi, H. Eslami and B. Larijani, Neurosci. Lett., 2009, 459, 47-51.
27 G. Esposito, D. De Filippis, M.C. Maiuri, D. De Stefano, R. Carnuccio and T.
Iuvone, Neurosci. Lett., 2006, 399, 91-95.
28 Q. Lu, T.F. Rau, V. Harris, M. Johnson, D.J. Poulsen and S.M. Black, Eur. J.
Neurosci., 2011, 34, 1093-1101.
29 V. Sivakumar, J. Lu, E.A. Ling and C. Kaur, Brain Pathol., 2008, 18, 71-85.
30 S.C. Correia and P.I. Moreira, J. Neurochem., 2010, 112, 1-12.
1 2 3 4 5 6 7 8 9 10 11 12 13 14 15 16 17 18 19 20 21 22 23 24 25
31 W.T. Lee, S. Hong, S.H. Yoon, J.H. Kim, K.A. Park, G.J. Seong and J.E. Lee, Brain Res., 2009, 1281, 64-70.
32 C. Nito, H. Kamada, H. Endo, P. Narasimhan, Y.S. Lee and P.H. Chan, J.
Neurotrauma, 2012, 29, 2404-2412.
33 H. Ihara, H. Yamamoto, T. Ida, H. Tsutsuki, T. Sakamoto, T. Fujita, T. Okada and S.
Kozaki, Biosci. Biotechnol. Biochem., 2012, 76, 1843-1848.
1 2 3 4 5 6 7 8