行政院國家科學委員會專題研究計畫 期中進度報告
營建專案績效前瞻預測與成因萃取之探討(1/2) 期中進度報告(精簡版)
計 畫 類 別 : 個別型
計 畫 編 號 : NSC 94-2211-E-011-034-
執 行 期 間 : 94 年 08 月 01 日至 95 年 10 月 31 日 執 行 單 位 : 國立臺灣科技大學營建工程系
計 畫 主 持 人 : 呂守陞
報 告 附 件 : 出席國際會議研究心得報告及發表論文
處 理 方 式 : 本計畫可公開查詢
中 華 民 國 96 年 01 月 01 日
行政院國家科學委員會專題研究計畫成果報告 營建專案績效前瞻預測與成因萃取之探討 (1/2)
Study on Short-term Prediction and Cause-and-effect Analysis on Project Performance Prediction and Evaluation
計畫編號:NSC 94-2211-E-011-034
執行期限:94 年 8 月 1 日至 95 年 10 月 31 日
主持人:呂守陞 國立台灣科技大學營建工程技術系 計畫參與人員:許毓萱、何彥毅、陳禱安、劉燕妮(Jenny)
一、中英文摘要
傳統專案績效之管理,多著重於專案之事 後督導及考核,屬於被動、落後且靜態之管理 方式,表達的形式也多以統計數字為主,而且 大都需在專案執行一段落後,始能進行。本研 究首先期望能不同以往以數字型態表現之專案 績效方式,藉由專案績效資料之蒐集彙整及有 效利用,並配合專案績效管理機制之探討,建 立以統計管制圖為手段所建置之視覺化之專案 績效指標,以展現專案執行之績效趨勢,協助 解釋專案建設計畫之表現。具體而言,本研究 期望藉由專案績效資料的分析,結合「完成實 值管理系統(Earned Values)」及「統計製程管制 圖(Statistical Process Control)」,建立進度與預 算整合並可展現整體專案執行的績效趨勢。
進之,本研究藉由獲利價值管理系統理論 及統計製程管制圖概念之運用,再結合短期預 測模型(Short-term Prediction Models),以建 立前瞻的績效預測模型,以主動掌握未來專案 之執行情況。此外,為能迅速掌握計畫執行狀 況,並即時發掘影響執行績效之問題點,本研 究試圖以序列型樣分析技術(Sequential Pattern Analysis)加以探勘績效影響因素,以增進監測 督導與協調的能力。並據此瞭解並掌握計畫推 動執行之關鍵資訊,進而採取適當之管理決 策。更且,透過分析探討各指標管制圖類型與 對應之成因,利用資料探勘技術建立各績效指
回饋至專案績效管理機制。
關鍵詞:專案績效指標、實獲值、資料探勘、
統計管制圖、短期預測模式、序列型樣分析 The earned value management (EVM) method is considered as a powerful tool that supports the management of project scope, time, and cost.
However, conventional EVM may cause some project managers to ignore the information that it can provide about the performance trends of their projects as well as cause and effect. The research first attempts to refine and improve the performance of traditional EVM method by the introduction of statistical control chart techniques.
Individual control charts are used as a tool to monitor project performance data so that adverse changes can be detected in a timely manner. It allows analysis of the trend of project cost and schedule in progress and highlights the possible needs for corrective action. A comparative analysis between traditional EVM and new approach is undertaken to identify the effectiveness of new approach.
Second, short-term prediction models will be incorporated into performance management system to provide a beforehand performance forecasting system that can assist performance managers in the decision making process because
research also explores the relationships between the project performance and the causes that influence plan performance trends by using sequential pattern analysis. The information provides important direction to timely control and corrective action of project performances.
Keywords: Performance index, Earned value, Data mining, Statistical control charts, Short-term prediction, Sequential pattern.
二、緣由與目的
綜觀目前工程專案之績效管理方式,對於 專案的進度及成本績效評估制度,著重於專案 事後之督導與考核,屬於被動且靜態之管理方 式,其雖以專案績效數據為評估,並無法從中 瞭解專案執行之持續變動情況。更且,於蒐集 彙整許多管考資訊後,資料流於符合管考資料 格式之規定,僅能作為初步瞭解專案執行之情 況。此可能導致有用的訊息或是能實際反應現 況之訊息被忽略,以致於無法與進度、成本所 呈現的績效資料相呼應,無法即時反應專案實 際運作狀況,亦無法對專案實際執行狀況提出 警示,甚而無法有效判斷專案執行績效及其相 關之問題點探討。若整體專案包含範圍廣泛,
其協調與溝通手段以解決問題之層面更為廣 泛,牽連甚廣。故若能於專案執行當中持續預 測績效變動趨勢,並掌握未來可能遭遇之問題 與成因,適時提出警訊,將有利進度及成本有 效管理。
有鑑於此,本研究主要之目的,即在有限 的管理人力及複雜之管理業務下,對於現行的 管考制度上採取預測的方式。將由被動轉為主 動,由落後轉為前瞻管制方式,由單一轉為連 續趨勢檢核,並以視覺化的方式呈現,建立績 效評估指標與管制圖,籍由管制圖的判讀機 制,判別管制圖之類型。再由資料探勘(data mining)之觀念,運用序列型樣分析技術,挖掘 資料隱性資訊,以找出各管制圖類型影響之因
素,尋找影響專案執行績效之問題點所在並予 以修正,並預測未來可能發生之因素,籍此強 化管考行為之功能,事先對於影響因素加以研 礙預防措施,增進監測督導及協調之能力,有 效掌握執行專案之重點。
各類專案均有其不同之工程特性及屬性,
為迅速掌握各主管部門辦理之專案推動情形,
藉由專案重要績效評估指標及動態的績效預測 模式系統的建立,有效掌握專案執行績效,並 即時發現問題予以修正,本研究目的可分為下 列幾點:
1、有效應用專案之基本屬性、執行狀況及影響 因素等管考資料,並探討其潛在問題,以便 尋找建立符於合理性、預測性及描述能力等 考量之重要績效評估指標的方法。
2、以進度與預算整合觀點,建立專案之績效評 估指標。並利用視覺化之績效管制圖趨勢,
展現專案之持續執行績效,俾利專案績效評 估指標重要訊息之傳達。
3、建立管制圖判讀機制,判定與分析管制圖之 類型。
4 、透過短期預測技術 ( short-term prediction techniques)建立動態之績效預測模式系統。
5、利用序列型樣分析技術(sequential pattern analysis),診斷影響專案執行績效之因果關 係,即時掌握與矯正異常之專案,以利專案 未來之良性發展趨勢。
6、藉由專案績效指標、管制圖類型與影響執行 因素之探討,瞭解指標管制圖與影響因素間 之關係,並據以驗證管制圖類型形成之原 因。
本年度研究範圍聚焦於(1)建立視覺化績效 指標管制圖;(2)建立客觀之管制圖判讀機制;
(3)指標管制圖與影響因素對應關係分析;(4)建 構本研究績效評估模式運用分析流程。以期使 動態績效管理機制得以於本年度大體建構完
成,進而有效應用於第二年度之短期預測模式 研發及應用。
三、結果與討論
本研究為建構一合理有效的動態視覺化績 效指標,經由探討實獲價值(Earned Value)之應 用於工作績效評估[1]、工程/設計階段進度成本 管理[2],以及之後為使此概念得以充分利用,
而提出克服之技術,使其更有效於績效管理之 應用[3][4]。於應用貨幣為共同單位來整合專案 時間與預算之管理技術-實獲價值管理系統 (Earned Value Management System, EVMS)完成 修訂後,許多專家學者致力於有效應用此系統 而發展出許多績效衡量指標;進而衍生建立成 本績效指標(CPI)與進度績效指標(SPI)結合之評 估邏輯[5]。爾後更有學者針對 CPI 與 SPI 對專 案 初 期 有 效 性 之 缺 漏 加 以 改 善 , 提 出 Work Package Method (WPM)以更完善的管控專案之 績效[6]。進之,為使專案績效管理更具系統化 與準確性而建立績效得分範圍與等級加以管控 [7],以及發展出圖解方法評定專案績效趨勢等 [8]。本研究綜整 EVMS 目前發展的限制與缺點 如下:
1. EVMS 僅得以探討單一時間點之績效,無法 有效反應專案整體執行狀況。
2. 缺乏合理之判斷標準及準則,造成專案進度 常有浮報以致管控作業無法落實。
3. 侷限於結果績效的呈現,無法提供預測及解 釋能力,以致專案無法有效執行預防性管 理。
本研究基於 EVMS 的廣泛應用,故而致力於改 善上列之限制與缺點,透過結合統計製程管制 圖(SPC),有效將時間序列概念及監測時間績效 變化管理概念[9]引進 EVMS。進而建構出以結 合 EVMS 之成本與進度績效指標(CPI、SPI)及 SPC 之個別值與移動全距管制圖(Individual and Moving Range Control Chart, X-Rm Chart)之動態 視覺化績效指標。如圖一所示。以下即分別就
績效指標之建立、管制圖判圖機制及指標管制 圖與影響因素對應關係分析分別說明:
(1) 視覺化績效指標建立:
如圖一所示為績效指標建立之流程,首先 進行 SPI 及 CPI 之計算,得到時間序列資料。
進而為結合 SPC 之應用,需符合其基本假設(a) 樣本需服從常態分配;(b)樣本與樣本間為獨立 且相同分佈;(c)應用於各管制圖之抽樣方式一 樣且隨機。因此,需進行常態分佈檢定,本研 究 採用 One-sample Kolmogorov-Smirnov Test 適合度檢定。同時經過案例顧問工程司之管控 資料發現營建產業相關之績效資料多非屬於常 態分佈。因此,本研究提出相關因應之策略,
乃應用[10]所提及若樣本為常態分配,其樣本與 其倒數所各別繪製之管制圖應呈鏡射狀態,若 非為常態資料則應先將樣本資料及其倒數取自 然對數函數(Natural Logarithm Function)進行轉 換,再進行管制圖繪製,如圖二、三為本研究 非常態分佈之案例資料,顯現此法可有效達成 鏡射效果,亦即轉換為常態分佈之基本假設;
其主要目的在於將差異甚大的資料轉化成差異 較小的數值,以在管制圖上呈現有效之資訊。
經由績效指標之轉換後即可進行管制圖之 繪製,基於西方電器手冊[11]提及(a)X、Rm兩圖 具有互相加強,故需同時考慮兩圖之中心及其 散佈狀況;(b)兩圖合併考慮可獲得新的資訊。
故需同時繪製兩種圖形,其繪製原則需遵守(a) 當 Rm圖超出管制時,不要試圖解釋 X 管制圖;
(b)先行消除 Rm圖之原因,則 X 圖的原因有機 會隨之消失。
(2) 績效指標管制圖判讀
如表一所示,為西方電器手冊[11]所歸納之 15 種管制圖型式,各具有其專案之特性。若能 有合理解讀管制圖型式,將有助於了解專案之 特性。由於目前並未有相關已開發成熟的技術 或軟體,得以自動判讀這些管制圖類型,所以 皆採用人工判斷的方式,為避免人為主觀所造
成的失真,及判讀時耗費的大量時間。因此本 研究透過文獻有效整理出管理圖型式之特性,
初步建構了管制圖判讀機制如圖四所示,期望 藉由多面向的查核來增加管制圖判讀的客觀正 確性以及節省判讀所耗用的大量時間。
本研究參考西方電器手冊中對於各類型管 制圖之描述以及管制圖異常判讀準則,訂定各 類型之特徵值與門檻點數。由於西方電器手冊 中之管制圖趨勢類型多達 15 種,其中諸多類型 為某一類型之特殊型式,或為管制圖有中斷之 情形者,或為選用之計量型管制圖類型不同而 不致於產生之趨勢類型,為了達到簡化分類之 效果,將之某些特定類型合併或刪除。本研究 排除西方電器手冊管制圖趨勢類型中的「混合
(mixtures)」、「穩定型混合(stable forms of mixture)」、「不穩定型混合(unstable forms of mixture)」、「週期(cycle)」、「兩圖相似 趨勢(tendency of one chart to follow another)」
等五種。依據條件樹手段,本研究建立之管制 圖判讀機制如下:
(1)原始數值:經由 one-sample K-S test 後,
為常態分配而選用之績效指標,若非常 態,則取自然對數。
(2)移動全距 Rm:為逐點之間的距離,即 SPI 或 CP 之 差 值 取 絕 對 值 , 其 運 算 式 為
1 i i
i SPI SPI
Rm = − −
,i=1,2,...,n,為計 算上下管制界限必要之參數。
(3)小波動 w:為點與點之間的距離小於等於 ( UCL - CL)/6 稱 之 , 其 運 算 式 為
( )
6 CL Rm UCL
w= i− −
,i=1,2,...,n, 當 w 為負值則小波動認為發生,此項主要 用於辨識 trend 與 grouping or bunching 的 條件之一。
(4)逐點平均增減趨勢 AT:為觀察值隨著時 間 推 進 之 逐 點 平 均 , 其 運 算 式 為
1 n
SPI n
SPI AT
n
1 i
1 i n
1 i
i
− −
= ∑ ∑
= −
=
, n
,..., 2 , 1
i= ,當 AT 為正值則為遞增,負 值則為遞減。此項主要辨識管制圖是否有 遞 增 或 遞 減 的 趨 勢 , 用 於 辨 識 gradual change in level 與 trend 特徵,若逐點平均 連續 10 點以上(含)發生遞升或遞減之 趨勢,則端視發生的時間區間內,是否有 過半數之點存有小波動的發生,存在,則 判定其時間區間發生 trend 之趨勢;反之,
則判定為 gradual change in level。
(5)分界 BL:用於分辨觀察值之點落於 CL 之上或下,其運算式為BL=SPIi−CL,
n ,..., 2 , 1
i= ,BL 值為正值表示觀察值落 於 CL 之上;負值表示落於 CL 之下。此 項 主 要 辨 識 sudden shift in level 、 systematic variables 與 interaction,當連續 8 點正值或負值,則表示 sudden shift in level 趨勢發生;若連續二個 sudden shift in level 發生,則為 interaction 趨勢。此條件 配合(8)落點,可用於判斷 systematic variables 特徵。
(6)大波動 M:為點與點之間的距離大於等於 ( UCL - CL) 稱 之 , 其 運 算 式 為
(UCL CL) Rm
M= − − ,當 M 值為負值 時,表示點與點發生大波動;正值,則表 示波動在( UCL-CL)之內。當大波動存在 時,則判讀為 instability 特徵發生。
(7)落點 P:用於判斷點於 A 區、B 區、C 區 或 是 outlier , 其 運 算 式 為
3 CL BL UCL
PC = − −
,
( )
3 CL UCL BL 2
PB = − −
,
(UCL CL)
BL
PA = − −
,當 PA、PB、PC
值為負值時,則表示點分別落於 A 區 B 區 C 區,且當 PC為負值時則不需計算 PB, PB與 PA亦然。當 PA值為正值時,表示該 點落於管制界限之外,即為 outlier。PC用 於判斷 stratification 特徵,當點落 A 區連 續 6 點以上,則屬於 stratification 特徵。
PB與 PA配合 BL 可用於判斷 grouping or bunching 特徵,當點落於 B 區連續 4 點以 上或 A 區 3 點以上,且點之間有小波動之 存在,則屬於 grouping or bunching 特徵。
其中 PA亦可用於判斷特徵 freaks,當 PA
值為正值時,則表示點於上下管制界限 外,即 outlier,則判斷為 freaks 特徵。而 BL 值與 PA、PB、PC值配合可用於判斷 systematic variables 特徵,當 BL 數值呈現 一正一負狀態出現,且發生在正負之同區 者,則判斷為 systematic variables 特徵。
而各趨勢類型所需使用的特徵值,以及管 制圖趨勢類型與特徵辨識運算式之關係 圖如圖五所示。
(3) 績效指標管制圖與影響因素對應關係分析 如表一所示,每一種管制圖型態其所展現 的特性不同,亦意謂著不同型態的管制圖形,
其隱含的專案特性亦有所不同,若能將管理要 素結合管制圖型式,將有助於了解專案所需聚 焦的管理核心問題。本研究期望透過所蒐集到 的案例顧問工程司管考資料,建構出績效管制 圖與專案影響因素之對應關係。由於 73 件有效 樣本之專案影響因素,係以文字敘述性的方式 表達,在進行績效與影響因素之關係探討上過 於複雜,且分析運用上也較為困難。因此,為 了能將這些因素資料以更簡單且簡潔的方式表 達,首先,我們需先將所蒐集的因素資料予以 量化。
本研究透過「影響次數」及「影響時間」
的角度來進行統計分析。所謂「影響次數」即 是指各種因素影響的專案件數;而「影響時間」
則是各種因素對專案的影響時間。將各專案依 據績效指標管制圖類型予以分類,同時對其影 響因素之「影響次數」及「影響時間」進行統 計分析。
接下來則是要如何利用上述的統計資料來 判斷各類管制圖與影響因素之間的關係。為了 明確釐清二者之間的關係,除了必須考量「頻 率」的問題,也就是「影響次數」;對於「程 度」的調查,也就是「影響時間」亦應包含在 內;因此在判斷過程中,本研究將各種因素影 響的專案件數稱為「影響頻率」;而將各種因 素對專案的影響時間稱為「影響程度」。
透過「影響頻率」及「影響程度」的綜合 考量,將可找到各類型管制圖與影響因素之關 聯規則,進而發現專案執行績效的影響因素。
依據上述判斷的方式,SPI-X、SPI-Rm及 CPI-X、
CPI-Rm 各管制圖類型所對應之影響因素,彙整 如表二所示。
由上述之說明,本研究所建立的動態視覺化績 效指標以確立完成,透過結合獲利價值管理系 統 及 統 計 製 程 管 制 圖 兩 種 理 論 , 將 傳 統 的 EVMS 績效指標轉變成具「視覺化」的績效指 標管制圖,可協助監控專案整體執行狀況。同 時藉由資料探勘的技術,對各績效指標管制圖 之影響因素作探勘。後續可透過績效指標管制 圖類型及歷史專案基本資料間之關係,來建置 預測模型。本研究即期望透過該預測模型預測 出之績效指標管制圖類型,能協助管理者找出 新專案的整體性影響因素,以利事先研擬預防 措施,進而提升績效。其運用分析流程如圖六 所示,以下便將其分成兩部分,分別予以說明 該如何運用。
(1)預測績效指標管制圖類型
將本研究所建立之績效指標管制圖當成
「輸出變數」,然後把專案基本屬性資料,如 業主類型、專案類型及主辦部門等等,當成「輸 入變數」,利用資料探勘的技術,分類分析模 式(Classification Model),探討兩者間之關係並 建立預測模型。
換句話說,當有新專案形成時,即可透過 該專案基本資料(輸入變數)間之關聯性,經由所 建立之分類分析預測模型,即可先行預測出其 未來執行後之績效指標管制圖類型。接著再依 據各類型管制圖所對應之影響因素,便得以找 出未來可能發生之影響因素,以利作為預防性 管理的依據。
(2)整體性影響因素探勘
在預測出績效指標管制圖類型後,由於 X 與 Rm管制圖最終需互相結合加以解釋,所以表 二所示之 SPI-X、SPI-Rm及 CPI-X、CPI-Rm需 聯合解釋。
若專案利用分類分析預測模式所預測之 CPI-X 管制圖類型為 Trends,則其所對應的影 響因素分別為施工作業、業主期望與要求、計 畫變更及行政作業;而 CPI-Rm指標為 Grouping or Bunching,其影響因素則對應為設計變更、
計畫變更及其他。因此,該專案的整體性影響 因素經聯合解釋後,即為施工作業、業主期望 與要求、計畫變更、行政作業、設計變更及其 他等 6 個影響因素,據此得以與前項之指標管 制圖獲得對應關係,而建構出完整之績效管理 系統。
四、計畫成果自評
依據研究計畫,本研究第一年度之研究要 旨在於建構動態視覺化績效指標,並建立其指 標於績效管理之評估分析運用流程。就視覺化 績效指標之建立,本研究透過結合 EVMS 與 SPC,達到績效管理得以時間序列方式之圖形化 呈現,同時建構管制圖對應之管理要因,以期 使績效管理更具系統化及有效性。如表三、四 之分析結果做一比較,可發現以傳統 EVMS 之
SPI 與 CPI 所繪製之圖形趨勢,呈現績效表現狀 況之全部正常與部分異常的合計比例,各為 89.04%及 75.34%,顯示大部分的專案執行績效 皆為良好;然而,在進行各專案實際訪談後,
發現大部分的專案在執行過程中,皆有若干的 問題發生,明顯地與圖形趨勢所呈現的結果不 同。這意味著若以傳統之 EVMS 績效指標來進 行管控,並不能確實反應專案執行進展的狀 況。而在透過結合統計製程管制圖後,所呈現 的趨勢表現狀況,異常的比例卻高達為 84.93%
及 75.34%,顯示大部分的專案執行績效,為不 佳的狀況。兩種績效評估方式形成強烈的對 比,顯示本研究於導入統計製程管制圖後,能 確實反映專案之整體執行績效。
茲自評本年度研究的主要成果如下:
(1) 成功結合 EVMS 與 SPC,建構圖形化與時 間序列之動態視覺化績效管理指標。
(2) 建構客觀多面向之管制圖判讀機制,增進判 讀之有效性與節省大量之判讀時間。
(3) 建構績效指標管制圖型式與專案影響因子 之對應模式,期使導入此系統時更能明確有 效的標示出專案的管理重點與核心問題。
(4) 應用案例顧問工程司資料,成功建構出績效 指標之運用評估系統架構,可於專案開始前 進行專案績效之預測,進而獲得專案特性資 訊,同時標示出未來可能發生的重要影響因 子,以利預防性管理的措施建立。
本研究於第二年度,將以本年度所建構之 模式為基礎,建立短期績效預測模式,同時導 入影響因子時間序列型樣分析,以期使除了本 年度可獲得事前預防性管理外,亦能進一步探 知未來以作為管理行動之修正與矯正措施進行 之依據,進而建構全生命週期完善之績效管理 系統。
參考文獻︰
1. McConnell, D. R., “Earned Value Technique
for Performance Measurements,” Journal of Management in Engineering, ASCE, Vol. 1, No. 2, pp. 79-94, 1985
2. Eldin, N. N., ”Management of engineering/design phase,” Journal of Construction Engineering and Management, ASCE, Vol. 117, No. 1, pp. 163-175, 1991 3. Fleming, Q., and Koppleman, J., “The essence
of evolution of earned value,” Cost Engineering, Vol. 36, No. 11, pp. 21-27, 1994
4. Brandon, D. M., Jr., “Implementing earned value easily and effective,” Project Management Journal, Vol. 29, No. 2, pp.
11-18, 1998
5. Christensen, D. S., Using the Earned Value Cost Management Report to Evaluate the Constructor’s Estimate at Completion, Acquisition Review Quarterly,1999
6. Howes, R., “Improving the performance of Earned Value Analysis as a construction project management tool,” Engineering Construction and Architectural Management, Vol. 7, No. 4, pp. 399-411, 2000
7. Chang, A. S., “Defining cost/schedule performance indices and their ranges for design projects,” Journal of Management in Engineering, ASCE, Vol. 17, No.2, pp.
122-130, 2001
8. Anbari, F. T., “Earned value project management method and extensions,” Project Management Journal, Vol. 34, No.4, pp.
12-23, 2003
9. Corbett, C. J. and Pan J N., “Evaluating Environmental Performance Using Statistical Process Control Techniques,” European Journal of Operational Research, 139: 68-83.
2002.
10. Walt, L., “Statistical Process Control of Project Performance”, Oklahoma City Air Logistics Center, 2002
11. Western Electric Company, Statistical quality control handbook / Western Electric Company, Inc., New York:Western Electric Company, Inc., 1956
圖一 績效指標管制圖建構流程
P00008 ln(CPI)
21 19 17 15 13 11 9 7 5 3 1 3.778
2.031
.284
-1.462
-3.209
P00008 ln(CPI) UCL = 3.5193 Average = .2845 LCL = -2.9504
圖二 ln(CPI)管制圖 ln( CPI )
Months
σ=1.100
P00008 ln(1/CPI)
21 19 17 15 13 11 9 7 5 3 1 3.209
1.462
-.284
-2.031
-3.778
P00008 ln(1/CPI) UCL = 2.9504 Average = -.2845 LCL = -3.5193
圖三 ln(CPI-1)管制圖
圖四 專案形成階段整體性影響因素分析運用流程 ln( CPI-1 )
Months
σ=1.100
圖五 管制圖趨勢類型分類架構圖
表一 管制圖趨勢類型彙整表
管制圖類型 圖形說明 呈現圖型
Cycles (週期)
圖形呈連續性高低起伏且有規律 的週期性變化,為一種非機隨型
式。
Freaks (畸形)
圖形為單一測量值相較其他觀察 值有明顯的差異,且顯著的落在 上下管制界限外,稱為異質點。
Gradual change in level (水平逐漸改變)
圖形呈現前後觀察點較異常,而 中間的觀察點則趨於正常的現 象。為Sudden Shift in Level中的
一個特例。
Grouping or Bunching (成團或成串)
當測量數以非隨機式的群集在一 起時,則表示有極不相同的原因
突然進入。
Instability (不穩定)
圖形呈現為觀測點頻繁地出現在 管制界限的兩邊,並呈上下不規 則、異常的巨大波動且幅度非常
的廣闊。
Interaction (交互作用)
交互作用為一個變數可以改變另 一變數的作用。也是兩個以上的 變數組合所產生一種綜合影響。
Mixtures (混合)
在此種混合的類型中,圖形呈各 測量點有落在上、下管制界限的 傾向,且在中心線附近缺乏正常
的波動。
Stables forms of mixture (穩定型混合)
為混合型式的一種特例,此種類 型混合一種以上的分配型態,且
這些分配是均勻的。
Unstable forms of mixture (不穩定型混合)
不穩定型混合為混合型態之一種 特殊類型。其由若干個分佈構 成,這些分佈可能為位置改變,
或僅是比率改變。
表一 管制圖趨勢類型彙整表(續)
Natural pattern (自然圖型)
自然圖型係在所繪製之一長串點 數中,型態是穩定的;沒有趨勢;
沒有突然移動,且在製程管制狀 況下。
Stratification (層化)
圖形呈現少數的資料點靠近中心 線;而沒有資料點靠近管制界
限,是不正常的一種形式。
Sudden shift in level (水平突變)
圖形中之資料點的位置突然改變 方向,且不規則(亦即非隨機的
點)的點出現在同一邊。
Systematic variables (系統化變數)
系統化變數為自然圖型特徵之 一。然其具有可系統之預知性,
並常呈現規律的鋸齒狀型態產 生。
Tendency of one chart to follow
another (兩圖相似趨向)
此為具有相似傾向之圖型趨向,
在所觀察之管制圖出現。如兩圖 發生相互依隨之情況,代表兩圖
有關係存在。
Trends (趨勢)
所謂趨勢,乃是一種連續性向上 或向下移動之現象,且一連串之
點數方向不改變。
表二 SPI 與 CPI 各管制圖類型影響因素彙整表
影響因素 管制圖類型
SPI-X SPI-Rm CPI-X CPI-Rm
Freaks
工作範圍界定
行政作業
業主期望與要求
其他
業主期望與要求
計畫變更
其他
其他
業主期望與要求
工作範圍界定
計畫變更
計畫變更
業主期望與要求
行政作業
其他 Gradual
change in level
行政作業
計畫變更
其他
設計介面
-
其他
行政作業
設計變更
-
Grouping or Bunching
施工作業
設計變更
設計審查
業主期望與要求
施工作業
設計時程
設計變更
設計時程
業主期望與要求
設計變更
設計變更
計畫變更
其他
Instability
其他
行政作業
設計變更
設計審查
業主期望與要求
工作範圍界定
業主期望與要求
施工作業
設計審查
-
Interaction
業主期望與要求
計畫變更
施工作業
業主期望與要求
設計變更
行政作業
其他
計畫變更
行政作業
設計審查
施工作業
設計審查
業主期望與要求
Natural pattern
設計審查
其他
計畫變更
業主期望與要求
行政作業
業主期望與要求
設計審查
計畫變更
設計審查
業主期望與要求
其他
設計介面
業主期望與要求
設計審查
其他
設計變更 Sudden shift in
level
業主期望與要求
計畫變更
行政作業
施工作業
業主期望與要求
計畫變更
其他
施工作業
設計審查
業主期望與要求
施工作業
Trends
其他
計畫變更
業主期望與要求
設計審查
施工作業
施工作業
業主期望與要求
計畫變更
行政作業
-
表三 傳統 EVMS 之圖形趨勢呈現正異常統計
SPI CPI 績效指標
圖形趨勢 數量(件) 比例(%) 數量(件) 比例(%)
全部正常 17 23.29 18 24.66 部分異常 48 65.75 37 50.68
異常 8 10.96 18 24.66
合計 73 100 73 100 備註: 部分異常:本研究定義為異常月份佔總時程的20%以下
異常:本研究定義為異常月份佔總時程的80%以上
表四 結合管制圖後圖形趨勢呈現正異常統計
SPI CPI 績效指標
圖形趨勢 數量(件) 比例(%) 數量(件) 比例(%) 正常
(Natural pattern) 11 15.07 18 24.66 異常
(其他類型管制圖) 62 84.93 55 75.34
合計 73 100 73 100
出席國際學術會議心得報告
計畫編號 NSC 94-2211-E-011-034
計畫名稱 營建專案績效前瞻預測與成因萃取之探討 (1/2) 出國人員姓名
服務機關及職稱 呂守陞,國立台灣科技大學 營建工程系所 會議時間地點 早稻田大學(Wasada University),日本東京
會議名稱 23rd 「International Symposium on Automation & Robotics in Construction」
發表論文題目 Improving Traditional Earned Value Management by Incorporating Statistical Process Charts (見附件),pp. 275~280
一、 參加會議經過
國際營建自動化與機器人研討舉辦迄今已二十三屆,過去陸續在歐亞美洲舉 辦,在日本陸續舉辦三次(1988, 1992, 1996)。今年研討會於 2006.10.3~5 在早稻田大學(Wasada University)舉辦,本屆研討會重點如下:
z Future outlook for automation & robotization in civil engineering z OS: Automation & robotization in marine construction
z Design and construction information management z Design, planning and management system
z Construction planning and management methods
z OS: robotic house: robots and Ambient intelligence for amenity life z Construction robot
z Planning and management
z OS: Automation & robotization in construction maintenance and inspection
z Information technology in construction management
z OS: Advanced production technologies of industrialized houses
z OS: Interdisciplinary study on construction management and engineering
z OS: RT and IT in construction
z OS: Autonomous systems for construction z Mobile robot navigation
z Robot control system
z Sensing and imaging technology in construction z Automation & robotization in civil engineering z Logistics and robot control technology
z Building construction application system
z Knowledge engineering and management system z IT usage management system
z Planning and dismantling z Autonomous robotic system
z Construction planning and management methods
我發表之文章被安排在 A5:Planning and management。本文章之重點:國內 外對於專案執行績效方面之研究相當多,而以往有關專案執行績效之探討,都著 重於專案之督導及考核,屬於被動且靜態之管理方式,表達的形式也多以統 計數字為主,而且大都需在專案完工或者年度告一段落後,始能進行。
本研究期望結合獲利價值管理系統(EVMS)及統計製程管制(SPC)之理論 基 礎 , 建 立 視 覺 化 之 績 效 評 估 指 標 , 以 展 現 專 案 執 行 之 績 效 趨 勢 , 並 協 助 解 釋 設 計 專 案 之 表 現 , 藉 以 改 善 傳 統 較 被 動 且 靜 態 的 績 效 管 控 方 式 。 同 時 運 用 資 料 探 勘 (data mining)技術建立專案形成階段之預測模型,以主動掌握專案 未 來 之 執 行 狀 況 ; 並 同 時 挖 掘 出 各 績 效 指 標 管 制 圖 所 對 應 之 影 響 因 素 。 以 利 管 理 者 能 事 先 掌 握 專 案 之 執 行 狀 況 , 並 得 知 影 響 專 案 執 行 績 效 之 問 題 點 , 進 而研擬預防措施,以提升專案執行之績效。
二、與會心得
日 本 營 造 自 動 化 之 研 究 與 運 用 在 全 世 界 皆 首 屈 一 指 , 如 清 木 建 設 之 全 自 動化建築施工系統等。本年度日本營造廠商除參與論文發表外,亦在場外提供 營建自動化海報。其內容除包括改良式營建自動化施工技術外,對於資訊技術 之運用亦是本年之重點。如全測站資料之運用,包括開挖與監測。
在 研 討 會 結 束 後 , 主 辦 單 位 亦 舉 辦 前 往 竺 波 參 訪 營 建 自 動化技術。當日 參訪項目包括:1)全自動搬運技術:利用 GPS,雷射測距等整合技術,安置 在 搬 運 車 ( hauler ) 車 上 , 開 發 全 自 動 搬 運 系 統 。 2) 智 慧 型 運 輸 系 統 : 利 用 GPS 導航系統,前置型道路資訊系統等,開發智慧型運輸系統。3)自動化道路 品質測試系統:將 GPS,雷射測距等技術安置在測試車上,進行全天候無人 測試道路品質,以獲取完整的品質使用資訊。4)遙控施工系統:利用遙控器與 施工機械結合,進行遠距施工控制。
IMPROVING TRADITIONAL EARNED VALUE MANAGEMENT BY INCORPORATING STATISTICAL PROCESS CHARTS
Sou-Sen Leu
Dept. of Const. Engrg.
National Taiwan Univ. of Science and Technology P.O.Box 90-130, Taipei,
Taiwan, 10672, Republic of China.
You-Che Lin
Dept. of Const. Engrg.
National Taiwan Univ. of Science and Technology P.O.Box 90-130, Taipei,
Taiwan, 10672, Republic of China.
Tao-An Chen
Dept. of Const. Engrg.
National Taiwan Univ. of Science and Technology P.O.Box 90-130, Taipei,
Taiwan, 10672, Republic of China.
Yann-Yih Ho
Dept. of Const. Engrg.
National Taiwan Univ. of Science and Technology P.O.Box 90-130, Taipei,
Taiwan, 10672, Republic of China.
Abstract: The earned value management (EVM) approach is considered to be the most objective method available in the measurement of project performances. Nevertheless, the method is limited and does not directly account for variation in individual performance values about a normal or natural level of project performances. Because of that, conventional EVM may cause some project managers to ignore the information that it can provide about the performance trends of their projects as well as their causes and effects. This paper attempts to refine and improve the performance of traditional EVM by the introduction of statistical control chart techniques. Individual control charts are used as tools to monitor variation in performances so that adverse changes can be detected in a timely manner. This allows analysis of in-progress project cost and schedule trends and highlights possible needs for corrective action. In conclusion, the proposed SPC control chart techniques used in EVM can effectively assist managers to timely monitor and manage project performance.
Keywords: project performance, earned value, statistical control charts, cause-and-effect analysis
1. INTRODUCTION
The earned value management (EVM) method has been used to manage project scope, schedule, and budget worldwide for a long time. EVM is considered as a powerful tool that supports the management of project scope, schedule, and budget. It is a powerful approach for quantitative measure of work performance in terms of cost deviation and schedule deviation and for quantitatively estimating actual completion time and actual cost at completion. Traditional EVM monitoring of project performances is based on the budgeted cost of work performed (BCWP), budgeted cost of work scheduled (BCWS) and actual cost of work performed (ACWP). And then, the cost variance (CV) and schedule variance (SV), or cost performance index (CPI) and schedule performance index (SPI) are calculated to measure the project performances. CPI and SPI are usually expressed in the periodic or cumulative way. Although that the EVM approach is considered to be the most objective method available in the measurement of project performances, the method is limited and does not directly account for variation in individual performance values about a normal or natural level of project performances. A gap exists between the use of existing methods and the availability of an appropriate methodology that specifically addresses variation in performances. The nature of this variation when depicted in the cumulative way is not directly apparent and only a slight wavelike pattern is evident. This is not relevant were the EVM approach used, since only the final cumulated value is required, but it is important if a causal connection between individual project performance values and events or
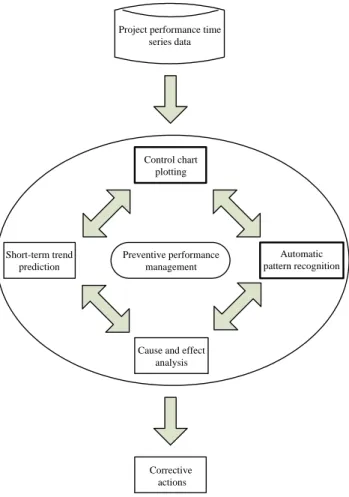
conditions were to be considered. Given the nature of the variation in project performance, it would appear that different types of events or conditions are operating, which may or may not be attributable to project managers. The above-mentioned situations can obviously be improved by providing the construction industry with statistical process control (SPC) method which supports the functions of continuous monitoring on the variation of project performances and effective analysis of cause and effect to provide corrective action recommendations. An overall scheme of preventive performance management by incorporating SPC is shown in Fig. 1. It consists of four main components: 1) control chart plotting; 2) automatic control chart pattern recognition; 3) short-term trend prediction; and 4) cause and effect analysis. The algorithms and the operational procedures of each component will be surveyed in the future research. This paper mainly describes the basic concept and techniques of the SPC-based EVM.
This paper adopted the concept of SPC to analyze project performance data: CPI and SPI. In Section 2, we discuss the concepts of EVM and SPC used in this study.
Section 3 explains, in detail, the stepwise procedure for combining SPC techniques for evaluating project performance trends and assignable causes of adverse trends.
Conclusions are drawn and future directions are indicated in the final section.
Project performance time series data
Control chart plotting
Cause and effect analysis
Automatic pattern recognition Short-term trend
prediction
Preventive performance management
Corrective actions
Fig. 1 Overall Scheme of SPC-based Performance Management System
2. METHODOLOGIES 2.1 Earned Value Management
The basic concept of EVM has not changed for past three decades since its inception [2,5,6,7,11]. EVM is an established method for the evaluation and financial analysis of project performances throughout project life cycle so that project managers and the organization can take timely actions in response to indicators of poor performance and increase the opportunities for project success [5,6].
Nevertheless, due to the over-complication of EVM methodologies and procedures, as well as massive efforts involved in data gathering, reporting and integrated information analysis, it is underused [2,7]. In addition to the above-mentioned deficiencies, there is one more deficiency in traditional EVM. It relates purely to cost and schedule performances only at the report date and no account is taken in time sequence. Generally, only single cost and schedule status at specific report date and completion forecast are conducted to represent project performance. The variation in individual performance values is not directly evaluated in most cases. The persistent performance variations and their consequences are not detected in traditional EVM. To overcome the limitations of traditional EVM, SPC techniques are adopted in this research.
The kernel of EVM is earned value (EV). EV is basically the budget for the completed work up to a point in time [2,6]. Earned value is also known as budgeted cost of work performed (BCWP). It is usually expressed in dollars and can be periodic or cumulative. In addition to BCWP, there are two basic data elements on the EVM report that are central to proper planning, measurement, and analysis:
budgeted cost of work scheduled (BCWS) and actual cost of work performed (ACWP). BCWS is the budget for work scheduled to be completed. ACWP is the actual cost incurred in accomplishing the work within a given time period. Nearly all of the other data items in EVM may be derived from these three data items.
Two important performance indices are CPI and SPI.
The indices are ratios. During project execution, CPI and SPI provide information about performance efficiency. CPI is the efficiency of achieving earned value with respect to the actual costs (CPI=BCWP/ACWP). SPI is the efficiency of achieving earned value with respect to the performance baseline (SPI=BCWP/BCWS). In the above formulas, 1.00 indicates that performance is on target. More than 1.00 indicates excellent performance; and less than 1.00 indicates poor performance. In practice, the warning level of SPI is generally drawn at 0.90 in Taiwan. When the index reaches within 0.90 and 1.00, more intensive monitoring measurements need to be taken. When the index reaches below 0.90, corrective actions need to be taken to avoid losing control of project.
2.2 Statistical Process Chart (SPC)
SPC are one of major statistical process control tools for performing statistical process control [9,10,12,13,14].
The SPC technique was first proposed in 1924 by Shewhart at Bell Lab [3,9,10,12]. The main purpose of SPC is used as a feedback system that aids in preventing defects rather than allowing defects to occur. The control chart could graphically depict variation. SPC is used to distinguish variations due to assignable causes from those due to unavoidable chance causes. Based upon the output of SPC, it allows for the elimination of assignable causes and the reduction of common cause variation. SPC techniques have been intensively used for quality control in the manufacturing industry [3,9,10,13]. SPC technique was also used as an aid to monitor environmental performance and software development [4,9,14].
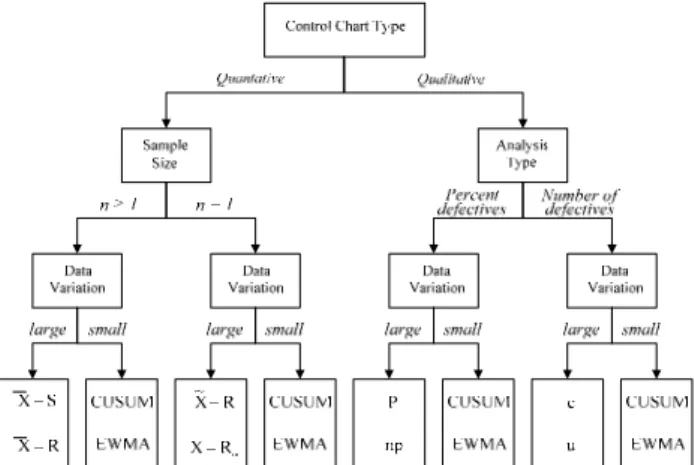
There are seven SPC control chart types, each having a specific application [12]. A summary of SPC types is depicted in Fig. 2. Due to only individual datum per run in our case, the control chart technique, Individuals and Moving Range (termed as X-Rm) is used for the study. The formulas of X-Rm are depicted in the following. The theoretical principles underlying X-Rm are three: 1) samples are from normal distribution; 2) samples are independent and identically distributed; 3) samples are randomly selected. Lipke’s research (2002) showed that if the requirement of normal distribution is not satisfied, the analysis and calculated results of control charts may be affected. The data with non-normal distribution need to be
transformed. The individual control chart (X Chart) is depicted as follows:
Central line (CL) =
k X X
X k
X = + + + k
=∑ ...
X 1 2 ……….………...(1)
Upper control line (UCL) =
k X X
X1+ 2+...+ k + 2.660
1
1
+
−
∑ − + n k
X Xi i
……...(2) Lower control line (LCL) =
k X X
X1+ 2+...+ k - 2.660
1
1
+
−
∑ − + n k
X Xi i
…..…..(3) where X: average of observed data; k: the number of observed data; n: run length (n=2 in our case).
A control chart consists of a central line and two control limits (upper and lower limits). If all process data are plotted within the control limits and without any particular tendency, the process is regarded as being in the controlled state. Control chart patterns provide the information about the state of a process. As stated above, when points fall outside the control limits or show a particular tendency, the process is regarded as being out of control, i.e., there exist assignable causes of variations and they need to be identified for process improvement. There are several ways to classify control chart patterns [3,9,10,13]. The rules used in this study to detect control chart trend patterns are based on Western Electric Company edition.
Fig. 2 Architecture of Statistical Control Charts
3. DATA COLLECTION AND TRANSFORMATION Data for the performance evaluation in this paper were taken from an engineering consultant company. The original data set contained 209 records. However, some data were deleted due to incompleteness and vagueness in data, and incompatible data conditions (such as different project types). Furthermore, in order to get higher correct prediction of performance analysis, the uniform distribution of data sets was also crucial. Based upon the above-mentioned data selection principles, there were only 171 data pairs remaining for the performance analysis. The
BCWS, BCWP and ACWP data are collected and analyzed from their budget plans and actual cost summary reports.
To evaluate whether the data set fullfils the principle of normal distribution, Kolmogorov-Smirnov (K-S) test was adopted for the evaluation. K-S test concentrates on the deviations between the hypothesized cumulative distribution function and the observed cumulative histogram. Its basic procedures are: 1) to rank the observations from the smallest to the largest; 2) to define the observed cumulative value (F( )Xi = in); 3) to compute the largest of the absolute values of the differences between the hypothesized CDF and the observed cumulative histogram evaluated at the observed values in the samples;
4) to compare the test statistic and threshold to decide the acceptance or the rejection of the hypothesis. The level of significance for this case was defined as 0.10. If the values of calculated level of significance are smaller than 0.10, the alternative hypothesis H1: not normal distribution was accepted, i.e., samples are not from normal distribution.
Table 1 shows that over one-third of performance data do not satisfy the requirement. Lipke’s research (2002) showed that if the requirement of normal distribution is not satisfied, the analysis and calculated results of control charts may be affected. In this study, the natural logarithm function was applied for data transformation.
Table 1 K-S Hypothesis Test for Non-normal Distribution Performance
Index Number of Projects Percentage (%)
SPI 56 32.8 CPI 78 45.6
4. ANALYSIS AND COMPARISON
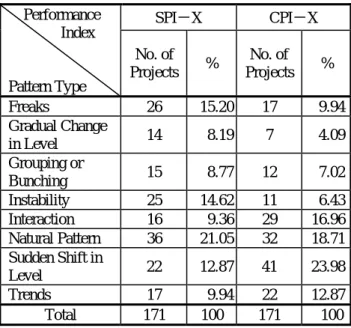
171 data pairs of project performances and their related causes were collected for analysis. The natural logarithm function was applied for data transformation. Transformed project performance data were then plotted in the SPC control chart (see Fig. 3). Basic pattern analysis flowchart of the SPC control chart is depicted in Fig. 4. The analysis results of 171 projects are summarized in Table 2. As seen in Table 2, only 36 SPI-X charts and 32 CPI-X charts are regarded as natural patterns. This is, only around one-fifth projects are in statistical control. Based upon the SPC control chart principles, there exist assignable technical and management causes that appear during the project process.
They need to be identified and tackled. To evaluate the output of SPC analysis, traditional EV analysis was executed and its result was compared with SPC results.