國立臺灣大學環境工程學研究所 碩士論文
Graduate Institute of Environmental Engineering College of Engineering
National Taiwan University Master Thesis
建立具都市化特徵的氣候變遷調適能力指標 Incorporating the Effect of Urbanization in Measuring
Climate Adaptive Capacity
朱驊 Andrea Chu
指導教授:闕蓓德 博士 Advisor: Pei-Te Chiueh, Ph.D.
中華民國 105 年 6 月
June, 2016
Acknowledgements:
First and foremost, I would like to thank my advisor, Dr. Pei-Te Chiueh 闕蓓 德, for her tireless efforts in guiding me through the process of research and writing. I
am unendingly appreciative of the time, heart, and care devoted to me and my fellow classmates.
Secondly, I want to express my thanks to my thesis committee members, 馬鴻 文 and 童慶斌, for their time and thoughts, which were instrumental in honing my
final work in both content and clarity. Their expertise was greatly appreciated.
I would also like to thank the Ministry of Science and Technology for their grant which allowed me to attend an international conference, where I was able to contextualize my research in the broader field and to communicate my work to other inspired people working in climate adaptation.
I must thank my classmates, 劉冠妤, 劉致均, 黃教程, 沈敬中, 許桓瑜, 林佳君, and 蕭明瑜 for their help and support over the last two years, in things
both big and small. And my deepest thanks to Laura VanVliet, Stephanie Vanvliet, and Corinne Swanson for their invaluable edits and comments which helped me clarify and strengthen this thesis.
And lastly, thank you to my family for making this all possible.
中文摘要
氣候變遷調適能力的評估可用以推估當地政府與人民在未來面對氣候變遷影響時,是否
能採行足夠且適當的調適措施。但目前相關指標的發展並未考量都市化對調適措施的影
響,因此可能會高估調適能力。本研究目的為建立氣候變遷調適能力指標系統,該系統
中納入與都市化相關指標 如:建設面積和教育程度,並設定三種社會經濟發展情境,
包括:基線 (情境 BAU,Business As Usual)、重視經濟發展(情境 A) 及重視環境與社
會 (情境 B);以期能提高氣候變遷調適能力評估的準確性,並可供地方發展與規劃之
參考。以美國佛羅里達洲的 West Palm Beach 和臺灣新北市的淡水區為研究案例,使用
土地利用模擬軟體 What if,分別模擬三種社會經濟發展情境,於 2030 年及 2050 年之
土地利用狀況;並將結果輸入本研究所建立之指標系統計,以推估兩地的氣候變遷調適
能力。在 West Palm Beach,情境 A 在 2030 年的調適能力為三者最高,然而在 2050 年
的則降低為各情境中最低;情境 BAU 與情境 A 類似,但起伏的程度較小;情境 B 在 2030
年和 2050 年的分數都呈逐步上升,並於 2050 年具有最佳的氣候變遷調適能力。淡水區
的趨勢測不同於 West Palm Beach,從基準年起三個情境的調適能力都會下降,但以情
境 B 降低的幅度較小。綜合而言,情境 A 是短期最佳的發展方向,不過以長期來看會有
調適能力的限制,而情境 B 雖然發展較慢,但到 2050 年會有較高的氣候變遷調適能力。
本研究可做為當地政府規劃未來發展的參考。
關鍵字:都市化、土地利用變遷、氣候變遷、調適能力、調適
English Abstract:
Measuring the ability of a community to face climatic changes, or its adaptive capacity, is necessary in order to plan and guide development as the global climate continues to warm. One factor that has not been thoroughly addressed by previous attempts at measuring adaptive capacity is urbanization. This study looks to measure adaptive capacity in relation to urbanization, as many areas of the world are undergoing this rapid transition. An indicator system was created with land-use sensitive measures and applied to three different land use projection scenarios (high, medium, and low growth) to 2030 and 2050 for two case study areas, Tamsui, Taiwan and West Palm Beach, USA. In Tamsui, the adaptive capacity decreased in all scenarios, but most dramatically for the high growth scenario. The low growth scenario decreased more slowly through each time slice. For West Palm Beach, the high growth scenario had the highest score in 2030, but declined in 2050. The medium growth Scenario BAU, also had a higher adaptive capacity score in 2030 than in 2050. The low growth Scenario B had a score that improved less dramatically but continued to rise through 2050. Scenario A would be ideal for short term gains, but its benefits would plateau in the long term.
Scenario B, with conservation measures and more restricted growth would be the most ideal alternative. This study shows that urbanization has short term socioeconomic
gains, but long term environmental consequences, and it successfully incorporates the effect of land use change into an adaptive capacity indicator system and can be used in other localities expecting significant increases in urbanization.
Keywords: urbanization, land use change, climate change, adaptive capacity,
adaptationTable of Contents
Acknowledgements ... i
Chinese Abstract ... ii
English Abstract ... ii
Table of Contents ... v
List of Tables ... viii
List of Figures ... ix
1 Introduction ... 1
2 Literature Review ... 3
2.1 Introduction ... 3
2.2 Conceptual Overview ... 4
2.2.1 Failure of Mitigation and the Ascent of Adaptation ... 4
2.2.2 Relating Adaptation, Adaptive Capacity, Vulnerability, Resilience and Risk ... 10
2.2.3 Indicators ... 21
2.2.4 Land Use and Urbanization Dynamics ... 25
2.3 Study-Specific Review ... 30
2.3.1 Case Study Sites ... 30
2.3.1.1 Tamsui, New Taipei City, Taiwan ... 30
2.3.1.2 West Palm Beach, Florida, USA ... 32
2.3.2 Indicator Systems – Previous Studies & Indicator Selection ... 34
2.3.2.1 Biophysical Indicators ... 34
2.3.2.2 Socioeconomic Indicators ... 36
2.3.3 Scenario Building ... 40
2.4 Conclusion ... 42
3 Methods ... 44
3.1 Case Study Sites ... 45
3.1.1 Introduction ... 45
3.1.2 Tamsui, Taiwan ... 46
3.1.3 West Palm Beach, Florida ... 48
3.2 Indicator System and Scoring ... 51
3.3 Land Use Scenarios and What If? ... 54
3.3.1 Data ... 54
3.3.2 Scenarios ... 55
3.3.3 What If? ... 55
4 Results and Discussion ... 61
4.1 What If? Allocation Maps ... 61
4.2 UACI Scores ... 66
4.2.1 Tamsui Scores ... 66
4.2.1.1 Baseline ... 66
4.2.1.2 Predicted ... 69
4.2.2 West Palm Beach Scores ... 70
4.2.2.1 Baseline ... 70
4.2.2.2 Predicted ... 72
4.2.3 Discussion ... 76
5 Conclusion ... 80
References ... 85
Appendices ... 95
What If? Projections Calculations and Assumptions ... 95
What If? Allocation Output Reports ... 103
List of Tables
1. Biophysical indicators ... 52
2. Socioeconomic indicators ... 52
3. Scenario assumptions/factors ... 55
4. Tamsui baseline indicators, sources, values, and scores for 2010 ... 67
5. Tamsui baseline score change from 2000 to 2010 ... 68
6. West Palm Beach baseline indicators, sources, values, and scores for 2010 . 71 7. West Palm Beach baseline score change from 2000 to 2010 ... 71
8. Tamsui index scores by scenario ... 74
9. West Palm Beach index scores by scenario ... 75
A1. Tamsui population project calculations ... 95
A2. West Palm Beach population projection calculation for Scenario BAU ... 96
A3. West Palm Beach population projection calculations for Scenarios A and B 96 A4. Tamsui employment projection calculations ... 97
A5. West Palm Beach employment projections (6) ... 98
List of Figures
Figures:
1. Hockey Stick Graph showing increase in temperature anomaly over time ... 6
2. SREX conception of disaster risk ... 13
3. Relationships between Adaptive Capacity, Resilience, and Vulnerability ... 18
4. Relationship between Adaptive Capacity, Resilience, and Vulnerability ... 19
5. IPCC scenario approach ... 42
6. Research flow ... 44
7. Relative positions of Tamsui and West Palm Beach... 45
8. Map of Tamsui ... 46
9. Tamsui land use 1997 ... 47
10. Tamsui land use 2008 ... 47
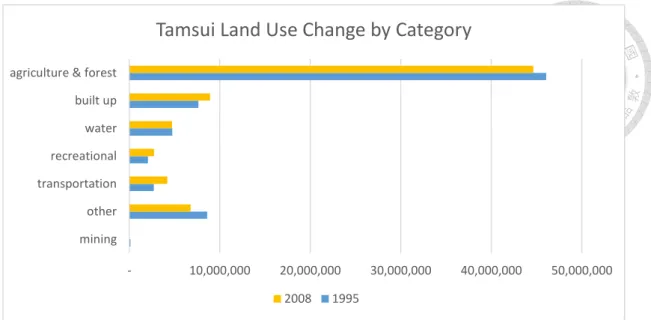
11. Tamsui land use change by category ... 48
12. Map of West Palm Beach ... 48
13. West Palm Beach land use 2000 ... 50
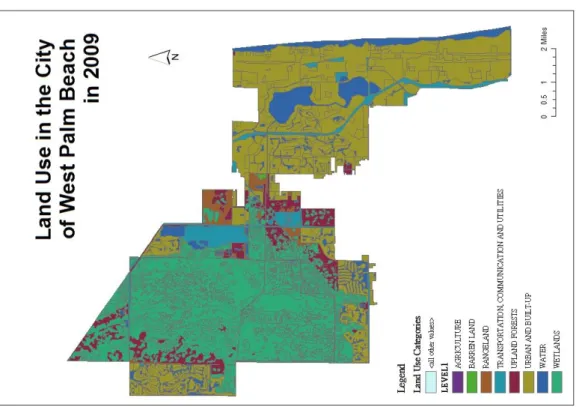
14. West Palm Beach land use 2009 ... 50
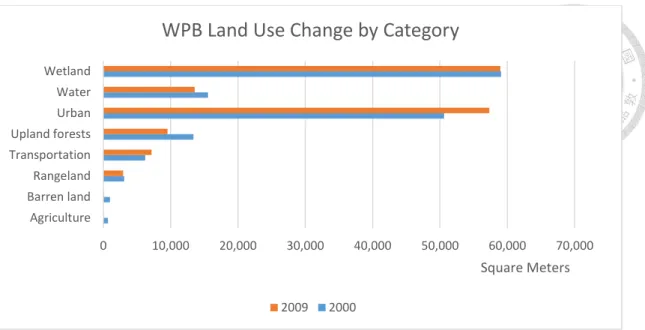
15. West Palm Beach land use change by category ... 51
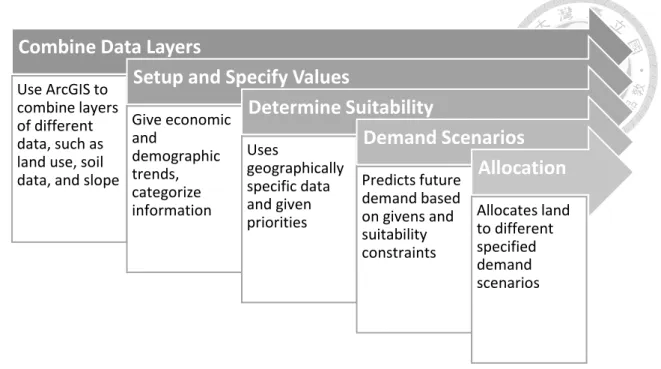
16. What If? steps... 57
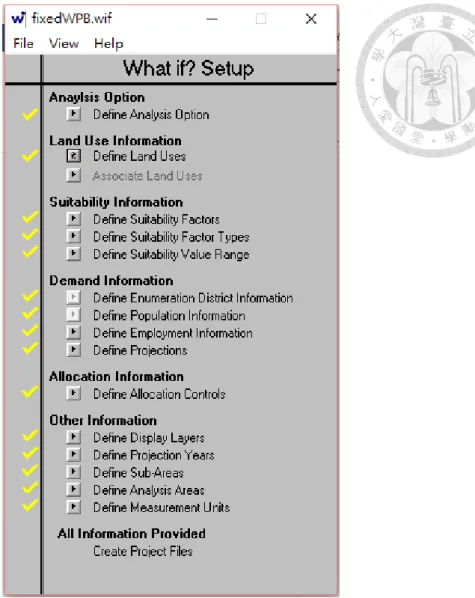
17. What If? setup ... 58
18. What If? Specify Values window ... 59
19. What If? Specify Values window (2) ... 59
20. What If? Suitability Scenario Assumptions window ... 60
21. Tamsui land use maps for Scenarios A, BAU, and B ... 64
22. West Palm Beach land use maps for Scenarios A, BAU, and B ... 65
23. Tamsui baseline percent change ... 68
24. West Palm Beach baseline percent change ... 72
25. Index scores of each scenario at each case study site over time ... 76
Chapter I: Introduction
In the coming centuries, humanity must adapt or perish. Changes in precipitation patterns, average temperatures, and frequency of extreme climate events are being observed and attributed to global climate change; with no end in sight for carbon emissions these changes are likely to lead to negative impacts such as water stress, food shortages, and higher health risks, and even a rise in conflict as a result of these effects (IPCC 2014). Along with this increase in climatic pressures on societies, urbanization is continuing at a breakneck pace. The development of cities is spatially uneven, as are its effects on social systems and ecosystems, with its effect on climate change being a prime example. Urban development and climate change both have resounding effects on society that are further complicated by their complex relationship with each other.
As international attempts at climate change mitigation continue to stall, climate adaptation is increasingly important on a local scale in order to lessen potential impacts on communities.
Considering that environmental, economic, political, and social factors all play critical roles in the capacity of communities to adapt to climate change, it has become increasingly relevant to consider how land development affects adaptive capacity at a local level. In areas that are undergoing massive land use change, how will adaptive capacity be influenced? To answer these questions, this research will focus on Tamsui
in northern Taiwan, and West Palm Beach in Southern Florida in the US. Both are areas that have experienced significant growth, and are slated for still more urban development and land use change in the next decade, making them interesting cases for an international comparison of how these changes affect adaptive capacity. This research aims to contribute to existing adaptation science by creating a new indicator system, the Urbanizing Adaptive Capacity Index (UACI), targeted specifically at areas in transition, which can measure current and future adaptive capacities under various scenarios based on both biophysical and socioeconomic factors to assist decision makers and policy builders in climate adaptation planning. This will be the first small- scale adaptive capacity index which accounts for the pressures of urbanization on communities.
Chapter II: Literature Review
2.1 Introduction
The purpose of this literature review is to cover concepts and previous literature utilized in this research, as well as provide literature-based explanations for methods to be covered in the next chapter. The complexities of concepts and practicalities will be discussed as both a theoretical and practical understanding of the literature is necessary as a foundation to this study.
The structure of this literature has two main parts, the conceptual overview and the study-specific review. This conceptual overview has four main subsections that
review the overarching tenets of this research. The first subsection of the first half,
“Failure of Mitigation and the Ascent of Adaptation,” is a general overview of climate
change and the modern history of human response, which introduces the wider context of my research. Subsection two, “Relating Adaptation, Adaptive Capacity,
Vulnerability, Resilience, and Risk,” covers a basic review of several concepts that are
important in climate adaptation research and explains adaptive capacity as a main component of this study. “Indicators” is the third subsection, which discusses the use
of indicators and indices as ways of measuring concepts reviewed in subsection two.
The last subsection of the first half, “Land Use and Urbanization Dynamics,” covers
the effect of urbanization, land use, and land cover on aspects of climate adaptation, and reviews the latest studies on these topics.
Following the conceptual overview of the literature review, the second section is separated into three subsections and functions an in-depth look at the more specific studies that influence the methodology choices in this research. First, the two case study sites are described and relation to the concepts reviewed in the first half of the literature review. The second subsection reviews previous studies which constructed similar kinds of indicator systems and provide justifications for the methods of this study, and the last subsection reviews literature on scenario building.
With these two halves, a conceptual overview to theory behind this field of research as well as a practical, study-specific review, we can understand the underlying contextual basis for this study.
2. 2 Conceptual Overview
2.2.1 Failure of Mitigation and the Ascent of Adaptation
Climate change adaptation was once considered to be a defeatist strategy, a path for those who had prematurely given up efforts of mitigating of greenhouse gas emissions. Many in the climate change community actively discouraged the thought
that adaptation might important, because mitigation, the decrease of carbon emissions to reduce overall atmospheric greenhouse gas concentration, was a preventative
strategy and would render adaptation unnecessary. As Benjamin Franklin once said,
“an ounce of prevention is worth a pound of cure.” There used to be a time where many
hoped, and many believed, that if society hurried, we could succeed in mitigating climate change.
That time, unfortunately, has passed.
Now, in 2016, few in that same community think that adaptation should not be pursued. Adaptive moves, such as building seawalls, relocation, or developing drought- resistant crops, are all seriously considered or enacted. Despite all efforts, scientists and activists and policy makers have not succeeded in decreasing emissions and thus carbon
dioxide concentrations have soared past 400 ppm, the concentration historically considered the threshold at which effects are “acceptable.” The science is clear that
humanity will experience effects of climate change for the foreseeable future. Due to carbon’s staying power in the atmosphere, even if emissions decline or stop
immediately, communities will still have to deal with shifting temperature ranges and precipitation patterns, rising sea levels, changes in biodiversity, differences in availability and quality of water and other resources for centuries to come (IPCC 2014).
There is now no choice but to adapt.
With such drastic implications, one might wonder: How did this happen, and what is being done?
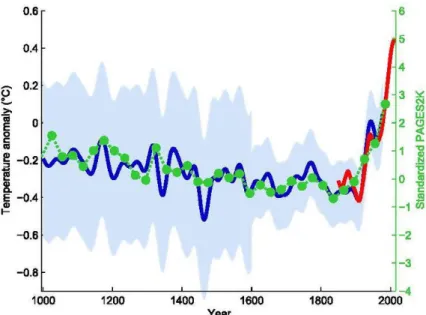
Carbon emissions began to rise with the advent of the Industrial Revolution, a result of burning of fossil fuels to power factories and burgeoning cities, and average global temperature rose soon after. The infamous “hockey stick graph” illustrates the increase in temperature over the last thousand years, which directly corresponds anthropogenic causes and is shown in Figure 1 (Mann et al 1998).
Mann et al (1998)
Figure 1: Hockey Stick Graph showing increase in temperature anomaly over time
While studying the mechanisms of heating effects of carbon dioxide and other
gases in 1896, Arrhenius and Chamberlin were the first to speculate that human activity could have a significant impact on Earth’s climate via anthropogenic emissions.
Although greenhouse gas effects were well studied by various scientists throughout the 19th century, anthropogenic climate change was not considered at the time and thus the full scope of the phenomenon did not mature until almost a century later. A complete scientific theory on anthropogenic climate change would not materialize until the late 1950s and it took until the late 1980s for the information on climate change to finally reach the general populace. (Maslin 2004)
When it finally became clear in the scientific community that climate change would have significant global impacts, the United Nations Environment Programme and the World Meteorological Organization established the Intergovernmental Panel on Climate Change (IPCC) in 1988 (IPCC 2016), which is now considered the international authority on climate change science. The IPCC has since published five highly reputable and are widely cited reports of compiled science regarding the different aspects of climate change since its inception. The United Nations Framework Convention on Climate Change was signed in 1992 and is currently the most important international climate policy body, and has held annual international climate
negotiations since 1995, most famously in Copenhagen in 2009 and most recently in Paris.
Despite the overwhelming scientific consensus presented by climate scientists and the IPCC, skepticism remains, particularly in the US, the highest per capita emitter of carbon dioxide in the world. As of 2015, only 67% of Americans believe in anthropogenic climate change (Yale 2015), compared to 81% of Taiwanese in 2008, which represents one of the highest percentages of countries where the study was conducted (Gallup 2009). Taiwan, despite not having UN membership and thus no ability to join the UNFCC, takes climate change matters seriously both programmatically and legally (Su 2011). On the other hand, over the last twenty years, the percentage of Americans that believe that climate change is happening or will happen in their lifetime has hovered a bit above 50 percent, and has never in the history of the poll has it risen above 61% (Gallup 2015). Naomi Oreskes and Eric Conway outline the origins of this phenomenon in their book Merchants of Doubt (2010), in which they describe how the public perception of climate science was skewed and how controversy was engineered. The legacy of this denial remains today in the minds of the American people: the public most responsible for climate change refuses to believe in its validity. Furthermore, the US government never ratified any binding agreements to cut carbon emissions. This refusal incited much debate about which countries should
bear the responsibility of the more intense emissions cuts, considering historical emission rates. Factions arose between developed and developing countries. The exact methods through which emissions agreements were to be executed were another issue, and those debates continue every year.
Without broad commitments, particularly by the US, carbon concentration in the atmosphere continues to climb. The purpose of mitigation is to prevent or decrease the impact of climate change. But society has, on an international level, failed in this endeavor to reduce carbon emissions enough to prevent global climate change.
Consensus and commitments do not seem to be in the near future.
We are now “locked in” to climate change, as many earth systems are not linear
but rather change due to global feedbacks and have “tipping points” which govern cycles. Many scientists believe there is enough evidence to say we are now beyond those tipping points. Carbon emission decreases now cannot completely prevent the
effects that are already ongoing; thus, climate change is no longer a question of “if” but rather of “when” and “how much.” The opportunity for complete or even substantial
mitigation has passed, and adaptation will be increasingly important. Because of the inevitability of climate impacts, trends such as sea level rise and higher global average temperatures will be, and already are, a reality to be dealt with.
2.2.2 Relating Adaptation, Adaptive Capacity, Vulnerability, Resilience, and Risk
If adaptation is a necessity for our rapidly changing environment, how is it defined and operationalized? What are its origins and under what contexts is it used?
What other terms are relevant to its utilization? These questions are to be addressed in this section.
The origins of adaptation can be traced back to evolutionary ecology, particularly in terms of species being well adapted to a specific environment. This definition of adaptation describes having traits that are more suited to thriving in a particular environment or the process of adapting to a different environment, but the literature now includes a larger breadth of possibilities. A word that once referred to an evolved state has now itself evolved to refer to an active human process -- a key concept in various social sciences and in the realm of global environmental change, and particularly important in regards to climate change. But also because of this diversity, many different definitions of adaptation exist, with a wide range of geographic and temporal scales, stimuli, and adapters (Smit & Wandel 2006). Even within the focus of climate change adaptation specifically, there exist myriad conceptual differences. The United Nations Development Program (UNDP) defines adaptation as “a process by
which individuals, communities and countries seek to cope with the consequences of climate change, including variability” (Lim et al 2004). Adaptation, defined by Brooks (2003), is “adjustments in a system’s behavior and characteristics that enhance its ability to cope with external stress,” and for Smit et al (2000) adaptations are
“adjustments in ecological-socio-economic systems in response to actual or expected climatic stimuli, their effects or impacts.” Despite the variety, the definitions of
adaptation generally include a stressor or stimuli, as well as a potential response to the stress, or a capacity of response. Stressors can be hazards such as flooding or drought.
Responses to these stimuli can manifest in a suite of forms that respond to both biophysical and socioeconomic changes, such as seawalls and levees, heat stress plans, diversifying revenue, adjustment of planting and harvest times, and relocation (IPCC 2007). But maladaptations can also occur, in which responses to stimuli are not positive or are not constructive. Some maladaptations are beneficial in the short term but damaging in the long term.
Discussions of adaptation to climate impacts are almost always followed by references to vulnerability and resilience. Adaptation is often viewed in terms of reducing vulnerability to climate impacts and increase resilience of systems. But, like adaptation, the way in which these terms are used and operationalized vary greatly, and their relationship with each other is often even more confusing. Vulnerability and
resilience also are rooted in different traditions that approach problems in divergent ways.
The field of vulnerability has been described as being in a state of “Babylonian confusion” and there have been over 35 definitions compiled (Hinkel 2011). The IPCC
definition in the Fifth Annual Report describes vulnerability as the propensity or predisposition to be adversely affected (IPCC, 2014). Exposure and sensitivity are often listed as components of vulnerability, sometimes accompanied by adaptive capacity.
However, there is more consensus on the meanings of exposure and sensitivity with regards to vulnerability, exposure being understood as contact with hazards as hurricanes or disease, and sensitivity being defined as the degree to which that hazard may negatively affect the system (Monterroso et al 2014, Engle 2011, IPCC 2007, Adger 2006, Cutter 2008). For example, a population with frequent outside contact may be more or less vulnerable to disease outbreak, depending on exposure and sensitivity.
Exposure may refer to the amount of contact with infected individuals from outside the area, whereas sensitivity might be the general immunity of the population as a whole.
Both exposure and sensitivity are seen as directly impacting vulnerability; as either increases, vulnerability also increases. Vulnerability is often conceptualized as shown in the equation below (Ahsan and Warner 2014, Binita et al 2015, Pandey and Bardsley 2015, Salik et al 2015):
vulnerability =𝑒𝑥𝑝𝑜𝑠𝑢𝑟𝑒 × 𝑠𝑒𝑛𝑠𝑖𝑡𝑖𝑣𝑖𝑡𝑦 𝑎𝑑𝑎𝑝𝑡𝑖𝑣𝑒 𝑐𝑎𝑝𝑎𝑐𝑖𝑡𝑦
The IPCC released a special report on Managing the Risks of Extreme Events and Disasters to Advance Climate Change Adaptation (SREX) which conceptualizes vulnerability as a component of risk, along with exposure and climate events (i.e.
hazard), as seen in Figure 2 (IPCC 2012). Moving exposure outside the realm of vulnerability and into a component of risk allows the separation of social and physical aspects of risk. This a refined version of the conception seen in Equation 1.
IPCC 2012 Figure 2: SREX conception of disaster risk
SREX also addresses the strengths of vulnerability studies as a lens for disaster risk. Vulnerability originated in hazard-risk and poverty studies, and the recent
(1)
literature still reflects this disciplinary legacy. The concept was prominent in development, food security studies, and political ecology, particularly in the fields of geography and anthropology (Janssen & Ostrom 2006, Gallopin 2006, Engle 2011, Adger, 2006). This history of approaches, compared to resilience studies, lends itself well to program and policy applications, which is helpful for those working on climate change adaptation (Engle 2011).
From this context, vulnerability is often described in negative terms but its relationship to adaptation is unclear. Is a system vulnerable because it is less able to adapt or is it less vulnerable after adapting? Some scholars disagree that vulnerability is always a negative trait (Gallopin 2006) and that vulnerability to transformation (rather than collapse) may provide unforeseen opportunities that can lead to more equitable or more effective systems. For instance, some studies have also shown that in certain cases increased exposure may actually decrease sensitivity by encouraging preparation by households or communities or governments, or by a sense of practice.
(Coulston and Deeny 2010). In other words, if a community is plagued by regular flooding, they may developing coping mechanisms that strengthen society at large. This is sometimes described as increasing resilience. However, it is not clear that vulnerability is necessarily unequivocally negative, nor that the equation above holds in all cases.
Relatedly, resilience is not necessarily always a positive thing. An invasive species, for example, may be resilient yet detrimental to the ecosystem. Additionally, an undesirable state, such as an oppressive political system, may be very resilient and able to revert back from different sources of stress (Engel 2011, Gallopin 2006).
Resilience is sometimes seen as the opposite of vulnerability, meaning if vulnerability is generally “bad” then resilience is generally “good.” But, it is possible a system can
vulnerable yet resilient, or both invulnerable and not resilient. “The relation of
resilience to the sensitivity component of vulnerability is also unclear. A sensitive system may or may not be resilient. An insensitive system (i.e., an ‘‘armored system’’)
may exhibit low vulnerability and low resilience (it is the exposure to perturbation that builds resilience in natural systems).” Furthermore, “sensitivity may open a system to threats, but an insensitive system may be unable to adapt and seize opportunity. The concept of resilience does not include exposure (similar to vulnerability as adopted here) but refers to the reaction of the system when exposed to perturbations. On the other hand, a history of past exposures may be important to build resilience.” (Gallopin 2006) Although it is clear that situations can vary, vulnerability and resilience are seen to have generally inversely related connotations in most practical applications thus far.
But a more nuanced understanding and consensus on issues may provide clarity for further collaborative works.
The concept of resilience is rooted in ecology, particularly within population studies, and it has a strong basis in mathematical models. Complexity theory, agent- based modeling, and systems analysis play a role in resilience studies and thus there is great emphasis on interactions, dynamics, and processes (Janssen & Ostrom 2006,
Gallopin 2006, Engle 2011). Resilience in a climate change context is sometimes defined as “as the ability of groups or communities to cope with external stresses and
disturbances as a result of social, political, and environmental change,” (Adger 2000) or, in a wider context, “achieving desirable states in the face of change” (Folke 2006).
These understandings are helpful in both pre- and post-disaster circumstances, unlike vulnerability which tends to focus on pre-disaster or pre-harm situations.
When faced with the challenge of combining the strengths of resilience studies with vulnerability studies, having a clear conception of how they are related becomes essential. Many attempts have been made to consolidate the discrepancies of vulnerability, resilience, and adaptation (Folke 2006, Gallopin 2006, Engle 2011, Cutter 2008) and the concept of adaptive capacity as a common bridge comes up repeatedly in the literature. The question then becomes: how exactly can adaptive capacity clarify the discord between these issues and what about it is most useful to policy applications?
Smit and Wandel (2006) outline the concept of adaptive capacity in relation to adaptation and vulnerability. Both Gallopin (2006) and Engle (2011) stated that the
concept of adaptive capacity is key in combining resilience and vulnerability literatures, despite the range of definitions that it also carries. It is “the ability of social actors to
make deliberate changes that influence the resilience of their complex social-ecological systems” (Ensor 2011, Walker et al 2004) and also “the ability of a system to adjust to
climate change (including climate variability and extremes), to moderate potential damages, to take advantage of opportunities, or to cope with the consequences” (IPCC
2001, Brooks et al 2005) or “a vector of resources and assets that represents the asset base from which adaptation actions and investments can be made,” according to
Vincent (2007). The SREC report also encourages the integration of vulnerability and resilience with adaptive capacity, seeing adaptive capacity as similar to resilience concepts, and as a component of vulnerability (IPCC 2012). Cutter (2008) consolidated much of the discussion into the figure below to display the wide range of combinations that had been proposed.
Cutter et al (2008)
Figure 3: Relationships between Adaptive Capacity, Resilience, and Vulnerability
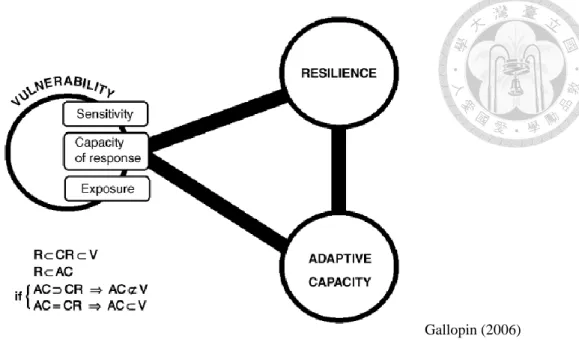
For the purposes of this research, the arrangement in which Gallopin (2006) combines the concepts of resilience, vulnerability, and adaptive capacity will be utilized, and is shown in Figure 4. Adaptive capacity is taken to mean capacity of response, and thus a subset of vulnerability, clarifying its relationship with resilience and vulnerability.
Resilience and adaptive capacity are internal to a system, whereas vulnerability can refer to outside pressures. Exposure in this model would point to climate change pressures, and sensitivity would be defined as how affected the system is by climate change, whether in reduced crop output, health impacts or any number of other manifestations.
Gallopin (2006)
Figure 4: Relationship between Adaptive Capacity, Resilience, and Vulnerability. “A diagrammatic summary of the conceptual relations among vulnerability, resilience…The signs represent relations between sets: = “subset of”; =”not a subset of”.”
Thus, adaptation, vulnerability, adaptive capacity, and resilience are often discussed together and are related, despite the specific relationships being highly inconsistent in the literature. Yet despite this wide range of definitions, there exist coherent ways to combine the ideas into a cohesive framework. Adaptive capacity remains key, as it is a useful measurement to help with climate adaptation because, unlike resilience and vulnerability, it is always positive, and there is no limit or maximum amount of capacity. It is a mutable property and can effectively incorporate the key concepts of vulnerability and resilience literatures (Engle 2011). Its diversity in definitions does not take away from its conceptual strength. Vulnerability studies are more easily translated into actionable policies. Similarly, due to its strong relationship
to vulnerability, adaptive capacity can also be smoothly utilized in policy applications.
But, incorporation of resilience concepts is also more easily encompassed by adaptive capacity than using vulnerability alone because of its flexibility in both pre- and post- harm conditions.
It is most beneficial to see vulnerability and resilience not as opposite sides of a
spectrum but rather two somewhat opposing concepts that are not necessarily “good”
or “bad” in all contexts. Of the various relations that have been previously discussed,
adaptive capacity has the strongest theoretical basis in which to incorporate different strengths of vulnerability and resilience studies. It has been utilized in many studies regarding environmental change (Acosta et al 2006, Posey 2009, Panda et al 2012, Goldman and Riosmena 2013, Quiroga et al 2014, Hogarth 2015, Nhuan et al 2016).
The literature does support the idea that systems with high adaptive capacity tend to be less vulnerable to harm and therefor are more capable of moving towards desirable states. These concepts are much more nuanced and context dependent, yet are both closely linked with adaptive capacity, which is more easily defined and represents a more tangible goal for climate adaptation.
This study will take adaptive capacity as a common focal point between vulnerability and resilience literatures, as a way to see community adaptation as continually flexible. Adapting Gallopin’s conception of adaptive capacity as a
component of vulnerability, emphasis will be placed on understanding adaptive capacity via a top-down approach. As such, resilience will not ultimately underpin the methodology of this research, but a grasp on the contributions of resilience studies anchors the definition of adaptive capacity and allows it to be more robust in understanding the dynamics of different social and ecological systems. Due to the
nature of this project, the use of adaptive capacity will tend more towards the vulnerability studies perspective, but will incorporate resilience studies’ nuances in an
attempt to bring the fields of study closer together. Climate change remains a continuously complex topic which necessitates interdisciplinary approaches to address.
2.2.3 Indicators
Not only are the concepts of vulnerability, resilience, or adaptive capacity complicated, but measuring them is also fraught with difficulties. All are multidimensional concepts that some would argue, that by their nature, cannot be measured at all (Vincent 2006, Hinkel 2011). But when trying to measure the immeasurable, particularly in the socioeconomic realm, indicators are often the yardstick used.
Indicators are a way of making theoretical concepts, like vulnerability or adaptive capacity, operational. Indicators are data that quantify and rank via different aspects, and are often used to compare areas to one another or from time frame to time frame.
Single indicators are often scalar and linear, and can be combined to create composite indices (Hinkel 2011). Indicator systems have been created for a variety of scales and have been applied in a number of ways, as they are a useful way in which to evaluate adaptive capacity and provide insights on the areas where strengthening is most needed.
Indicators are most often associated with socioeconomic indicators, particularly large national indicators of well-being as put out by institutions like the World Bank.
Some common socioeconomic indicators are GDP as an indicator of wealth, literacy rate as an indicator of education level, or the Gini Index as a measure of inequality.
Indicators can be measures of biophysical qualities too, particularly ones which are difficult to directly measure or calculate. Species richness as a way of representing ecological health, or AQI as a measure of air quality, and CTSI for measuring eutrophication, are biophysical indicators or indices commonly used.
Many studies using indicator systems to measure vulnerability and adaptive capacity have been conducted. Yohe and Tol (2002) constructed a system based on adaptive capacity determinants which they tested on increased flooding situations in the Netherlands, whereas Brooks et al (2005) created a national scale vulnerability index
between many different countries, with particular emphasis on data-based indicator weighting. Acosta et al (2006) applied a novel, spatially-explicit adaptive capacity index to Europe. Sietchipeng (2006) and Vincent (2007) investigated indicator uncertainty across scales with cross-country and household case studies, Jubeh and Mimi (2012) focused on national level water resource stress and vulnerability in the Middle East, and Monterroso et al (2012) researched agricultural vulnerability to climate change. Ahsan and Warner (2014), Binita et al (2015), Pandey and Bardsley (2015), Salik et al (2015), and Xenarios et al (2016) conducted vulnerability assessment indices in various case study areas. Whatever the system, indicators provided quantitative, easily understood data on which to draw conclusions.
Despite being commonly used, easily understood, and generally accepted, many indices are often considered incomplete, unrepresentative, or have too much uncertainty to be relied on for policy or program planning. The use of indicators is widespread, but the critiques of the method are prevalent also.
Hinkel (2011) outlines many of the issues with indicator use in regards to concepts such as vulnerability. From a science to policy perspective, unclear objectives and confusion about what indicators are able to achieve often undermines the usefulness of indicators and indices. Steps from selective indicators to how to aggregate them and validate them are all difficult to evaluate and substantiate. Socioeconomic systems are
never completely defined by a few variables, nor are they linear, yet indicators used to describe them often are. Sufficient data is also difficult to find at smaller, more context- specific scales. Hinkel argues that indicators are the wrong method for identifying mitigation targets, raising awareness of climate change, and monitoring adaptation policy. But Hinkel suggests that indicators may be a helpful tool in identifying particularly vulnerability of communities or sectors, providing the system can more narrowly defined. It is also suggested that, “they should only serve as high-level entry points to further more detailed information behind. Since indicators reduce complexity, they can be interpreted in a variety of different ways and background information is necessary to prevent misinterpretation.” He further recommends that “the different types of arguments used in developing indicators should be made transparent. In particular, normative arguments should be made explicit and be based on the
preferences of stakeholders.” Finally, it is recommended that “due to the inherent
“wickedness” of the task, any vulnerability indicator would need to be updated
regularly, based on new research findings.”
Vincent (2006) also described some aspects of uncertainty with regards to indicators, particularly in terms of scale, and both Vincent and Hinkel describe the issues with both inductive and deductive foundations for building indicators. Many researchers, like Yohe and Tol (2002), focus on deductive (theory-driven) selection of
indicators, based on theoretical determinants of adaptive capacity, whereas studies like Brooks et al (2005) or Monterroso et al (2012) take a more inductive (data-driven) approach. Deductive systems often do not have complete frameworks for all variables necessary or do not have theories available for how to aggregate data. Inductive methods often suffer from lack of data (particularly experienced harm through past disasters) and systems that are not narrow defined.
Thus, creating indices of value are difficult, but there are indeed ways that mitigate problems with methodologies and continue to improve them. As data becomes more widely available at smaller scales, uncertainty can be decreased. The literature suggests that narrowly defined systems with clearly outlined purposes for the indicator system, transparency in methodology, and awareness of the weaknesses of indicators as a whole are the most important in creating and utilizing an indicator system for measuring adaptive capacity.
2.2.4 Land Use and Urbanization Dynamics
With all these issues in mind, from climate change to climate adaptation to adaptive capacity, there are several ways to refine these concepts for application. One
phenomenon in particular has not been well addressed in discussions of measuring adaptive capacity, and that is urbanization. This section hopes to draw connections between urbanization, land use and land cover (LULC) change, climate and adaptive
capacity, as “accelerated urbanization is an important trend in human settlement, which has implications for the consideration of exposure and vulnerability to extreme events”
(IPCC 2012).
In 2014, 54% of the world’s population lived in urban areas, and that figure has
surely risen since. Urbanization is expected to continue well into the future all over the world. By 2050, the global urban population is predicted to be two thirds of the global
population, with most of the change concentrated in Africa and Asia. Asia, in particular, will continue to hold about half of the world’s urban population. Driven by a number
of social and economic transformations, urbanization catalyzes a number of its own changes, affecting the state of poverty, of land use and land cover, and more. This has, and will continue to have, a great effect on demographic and environmental developments. (UN WUP 2014)
World urbanization has a profound impact on the extent and spatial character of urban land cover and land use. With geographic movement of demography comes geographic change of resources, capital, and demand, all of which have corresponding physical manifestations. With more people living and working in cities, metropolises
expand and agricultural and natural vegetated land cover is developed, increasing the concentration and total area urban land. Natural land cover, due to its physical and chemical properties, has cooling and water retention functions, as well as important for soil and ecological health. Transition to urban land cover can lead to the heat island effect and pollution problems. Thus when urbanization causes a decrease in natural land surface it affects carbon, energy, and water budgets, and a number of other biophysical mechanisms with far reaching consequences (Dale 1997, Pyke and Andelman 2007, Pielke et al 2011).
Land use and land cover (LULC) and urbanization are also both major drivers
and results of global climate change (Dale 1997, Kalnay and Cai 2003, van der Werf
and Peterson 2009). LULC have complex interactions with atmospheric conditions, which contributes to climate change while simultaneously compounding or mitigating climate impacts at a range of scales (Dale 1997, Pyke and Andelman 2007, Lee 2009, Pielke et al 2011). Most notably, deforestation can add significantly to carbon dioxide levels by releasing carbon from vegetation, and removal of wetlands can have similar effects. Conversely, climate impacts can also spur urbanization or reallocation of agriculture land or pasture land (Lee 2009). Pyke and Andelman (2007) state that “the impact of global climate change is mediated at regional and local scales by biophysical processes associated with LULC.” LULC and climate change are intimately linked;
both climate mitigation and adaptation are influenced by, and in turn influence back, LULC and urbanization.
These have impacts on both socioeconomic and biophysical systems. More specifically, LULC affect soil moisture, length of growing season, diurnal temperature range, temperature extremes, suspended dust volumes, rainfall patterns, albedo, and storm frequency, which all influence agricultural production and thus food security.
Urban land increases heat at lower levels of the atmosphere and can change peak heat times and elevate minimum temperatures, affecting thermal comfort and health. The increase in impervious surfaces and decrease in forest coverage that comes with urbanization tend to have negative effects on ecological functions, such as loss of soil fertility or decline in species diversity. Thus, from both historical data and modeling results, it has been shown that climate is intertwined closely with changes in LULC.
As mentioned before, changes in land use have clear, observable effects on greenhouse gas emissions and vice versa (Liao et al 2013, Jones et al 2013). But it would be remiss not to realize that climate adaptation is also mediated by LULC. Many determinants of adaptive capacity are affected by levels of urbanization as LULC have effects on both social and ecological systems. Socioeconomic determinants, like access to resources or income level, are highly related to urbanization. The rural-urban disparity is key in considering factors that influence adaptive capacity. Many economic
resources are concentrated in urban areas, as they are linked to international markets and finance. Also, urban areas tend to be well serviced by infrastructure from roads to electricity, compared to rural areas that may not have as easy access to things like running water or cellular service. But cities are complex places, and have both positive and negative impacts on adaptive capacity. Cities may be associated with more resources, but they also bring many consequences like increased inequality or weaker social ties that provide support in times of stress. Biophysical factors are also often dependent on land cover, as previously mentioned; for example, flooding impacts are exacerbated by loss of coastal wetlands and wetlands have historically been filled in for the sake of agriculture or other kinds of development. Forest cover has also been shown to have cooling effects, or other positive impacts on soil retention or precipitation patterns.
Studies have shown clear links between LULC and climate change and the feedback between them, but a literature gap remains in drawing connections between LULC change and measuring adaptive capacity, although SREX addressed urbanization specifically as a potential driver of vulnerability. This study aims to use the existing literature to create a new measure in which to connect the effects of urbanization on the ability of communities like Tamsui and West Palm Beach to adapt to oncoming climate change.
2.3 Study Specific Review
2.3.1 Case Study Sites
To illustrate the influence of urbanization on adaptive capacity, this research will focus on Tamsui in northern Taiwan, and West Palm Beach in Southern Florida in the US as case study sites. Both are areas that have experienced significant growth in recent years, and are slated for still more development and land use change in the next decade, making them suitable for investigation. Further background on the two case study sites will be continued in the Methods section. Here, the study sites will be reviewed in terms of the literature regarding their ecological, historical, and legal implications. This section will clarify some of the effects of land use change on the two sites.
2.3.1.1 Tamsui, New Taipei City, Taiwan
There have been numerous studies on climate change in Taiwan, land use change processes, as well as several on the relationship between the two. Taiwan will be strongly affected by climate change and has already begun to see significant warming trends and changes in precipitation patterns. Taiwan will likely see greater change between the rainfall difference in the wet and dry season, temperature increases, increases in extreme rainfall events, as well as a number of other varying local changes (Hsu et al 2011, Hsu and Chen 2002). These changes will affect a number of facets in
Taiwanese life, such as food and agriculture, energy, and health (Hsu et al 2011, Chang 2002), yet Taiwan has limitations in the international realm of climate negotiations as it is not a member of the UN and has different, if not limited, capacity to affect change on a larger scale (Su 2011).
Much of previous land use policy and planning law has inadvertently promoted urban sprawl and the conversion to low density development. Chou and Chang (2008) found that politics in local planning governance led to an oversupply of serviced land,
resulting in urban sprawl in Taiwan. Regulations for development were relaxed, and local politicians used “land use plans to channel dynamic economic activities and urban development into their own territories.” Local capitalists took advantage of a series of
rezoning and lack of taxation policies for land speculation in rural and suburban areas.
The effect of LULC on hydrology of northern Taiwanese watersheds was investigated by Lin et al (2009) and Lin et al (2007). Increased land use intensity increased hydrological output, in fact the percentage of forest converted to built-up land was the factor that most strongly influenced peak flow and runoff volume. Total vegetated landscape outweighed landscape configuration in importance regarding hydrological output of the watershed, which indicates that in some cases, quantity still overshadows some qualitative characteristics. But “the hydrological components were impacted by land use change even through time and low land use change pressure.
Runoff from built up areas increased and groundwater discharge decreased as infiltration reduced owing to replacement of vegetation resulting from development.”
The study found that increased peak differences in streamflow, surface runoff, groundwater discharge, and stream-flow variability were all linked to land use change (Lin et al 2009).
Chen and Huang (2013) investigated land use on mountainous areas and its effect on landslide ratios. Agricultural products like betel nuts or tea have shallow roots and tend to result in higher landslide ratios than land covered with natural forest, and development also results in higher occurrence of landslides. These studies show the effect of LULC change on ecosystem processes, not just from vegetated to urban transitions but also from forest to agricultural uses. These changes have complex interactions with hydrology and disaster rates in Taiwan.
2.3.1.2 West Palm Beach, Florida, USA
Southern Florida is also an area that is vulnerable to climate impacts. As a low- lying state, it is particularly concerned with sea-level rise, elevated storm surges, and saltwater intrusion, and like Taiwan, there have been recorded changes in precipitation patterns and temperatures due to urbanization, natural variability, and climate change (Obeysekera et al 2011). Water stress is of particular concern.
Urbanization and agriculture have been the main drivers for the land use change in Florida over the last century, which has resulted in draining of large portions of marshland. Crop freezes have been linked to LULC changes across Florida, which were attributed to converting wetland to agricultural land across the state that resulted in
larger temperature ranges (Obeysekera et al 2011, Marshal et al 2003). In a climate report, overviews of previous studies in southern Florida showed that “urbanization has
also dramatically altered the local climate. From an analysis of 57 weather stations for a 58-year period (1950–2007) in the state of Florida, Winsberg and Simmons (2009) found that the length of the hot season has increased at most locations. However, of the seven stations that had at least a three-week increase, five were in large cities and, therefore, Winsberg and Simmons (2009) attributed the “urban heat island” effect (urban areas tend to increase temperatures locally due to increased radiation of heat and reduced evaporation from asphalt surfaces, roofs, etc.) as the primary cause of the change in the length of the hot season.” The urban heat island effect was also report to have changed precipitation patterns downwind of urban areas. But real estate is a massively influential sector in Florida, and is a main driver of land use change, zoning decision-making, and adaptation decisions (Obeysekera et al 2011). The history of human activity in Florida has led to a number of ecological and climatic changes that
will in turn influence many aspects of society in Florida, from real estate to health.
2.3.3 Indicator Systems – Previous Studies and Indicator Selection
This study bases indicators on the determinants of adaptive capacity, which were adapted from IPCC’s report “Adaptation to Climate Change in the Context of Sustainable Development and Equity” (Smit et al 2001). Below are the indicators
chosen for the Urbanizing Adaptive Capacity Index (UACI) and some reasoning for their selection, as well as a list of previous studies that used variants of these determinants in their indicator systems. Data availability, previous literature, and relationship to urbanization were the major priorities in choosing indicators.
2.3.3.1 Biophysical Indicators
Storm water and Runoff: percent impervious surface – This is a very important indicator associated with urbanization and its effect on adaptive capacity. LULC change can influence flood intensity and frequency (IPCC 2012). As discussed in Lin et al (2002, 2009), built up land area is closely related to the increase in runoff and stress on storm water systems, as water is not able to be absorbed into the soil and trickle down into aquifers and instead runs along the top of impervious surfaces in larger volumes. It
increases the number of flood events or intensity of flood events (Remondi et al 2016).
With the increase of impervious surfaces like concrete or asphalt, biophysical systems are less able to adapt to changing precipitation patterns, as the land’s ability to retain
water or ability to remove it from the surface decreases. Cutter (2008), Jubeh and Mimi (2012), and Monterroso (2014) also used similar measures in their indicator systems.
Temperature Variance: degrees difference – Surface temperature is another aspect affected by urbanization through transformation of material with varying capacity for heat-retention (Fu and Weng 2016, Zhou et al 2016, Maimaitiyiming et al 2014). The urban heat island effect is a phenomenon associated with cities, and it can exacerbate many health-related issues (Li et al 2016). With more urban surfaces, areas are less able to adapt to changes as temperature differences are exacerbated, affecting both people and ecosystems. Monterroso (2014) and Binita et al (2015) both included temperature related indicators in their assessments.
Surface Water Stability: percent natural land cover – This indicator is related to the issues discussed with impervious surfaces. Hydrological changes are often linked to amount of natural vegetated land cover (Lin et al 2002, 2007). The more natural land cover, such as wetland or forest, rather than agriculture, the better the land is able to
provide ecosystem services and remain productive. Development into higher elevations or steeper sloped areas can be decrease the stability of land, potentially resulting in landslides during rains. Brooks et al (2005) also used a similar indicator.
Each of these adaptive capacity indicators has been used in previous studies and are correlated with urbanization in one way or another. Iframed differently, they may also be seen as indicators of exposure to climate impacts or indicators of urbanization as a driving force of climate change. But in this study, they will be used as indicators of ecosystem adaptive capacity
. The UACI as a whole will be used to measure adaptive capacity as a function of urbanization, which will be covered in the Methods section.
2.3.3.2 Socioeconomic Indicators
Networks – occupancy rate and trust: Networks, social capital, and community ties are important support systems for individuals and families during times of crisis, but are among some of the most difficult things to measure. The social ties that people have to others that can help them are very important for adaptive capacity and other benchmarks of wellbeing. However, urban populations are often found to have fewer community
ties as compared to rural areas (Beggs et al 2010, Ziersch et al 2009). Because of this determinant’s difficulty to measure and lack of comparable measures across
international borders, two indicators, occupancy rate and trust, were chosen to represent them. Cutter et al 2008, Monterroso 2014, Salik et al 2015, Xenarios et al 2016, and Nhuan et al 2016 all used some form of network measure in their indicator systems.
Economic Resources – GDP and median household income: GDP and income were the most frequent and straightforward measure used in many of the previous studies on adaptive capacity and vulnerability. More economic resources allows entities to prepare better for or recover more quickly from disasters or stressors. GDP is an indicator of the health of the entire economy, whereas median household income measures household or individual level adaptive capacity, and both are included in the UACI.
GDP and household income are both positively correlated with urbanization (Hope and Edge 1996). Acosta et al 2013, Cutter et al 2008, Jubeh and Mimi 2012, Posey 2009, Daramola et al 2016, Brooks et al 2005, Cutter et al 2008, Kelly 2000, Metzger et al 2006, Sietchipeng 2006, Vincent 2007, Binita et al 2015, Ahsan and Warner 2014, Xenarios et al 2016, Nhuan et al 2016, Panda et al 2013 all used economic resources in their indicator systems or listed it as a contributing factor for adaptive capacity and vulnerability.
Information and Skills – education level: Education level or literacy are almost ubiquitously positive characteristics and are the most commonly used general measure of information and skills. Education levels are also shown to be positively related to urbanization (USDA 2015, Pradhan et al 2000, Hope and Edge 1996). Among those that used education level in their studies of adaptive capacity and vulnerability, some are listed here: Acosta et al 2013, Brooks et al 2005, Jubeh and Mimi 2012, Metzger et al 2006, Monterroso 2014m, Sietchipeng 2006, Binita et al 2015, Ahsan and Warner 2014, Salik et al 2015, Xenarios et al 2016, Nhuan et al 2016, Panda et al 2013, Posey 2009.
Equity – Gini Index Score: The Gini index has its shortcomings, but has been measured at various levels for an extended period of time and remains the most widely used and comparable measure of economic equality. Urban areas, particularly in the developing world, have higher levels of inequality than rural areas (UN 2014, 2011). Equity is one of the 6 main determinants of adaptive capacity, and thus this indicator uses the Gini to account for this influence. Acosta et al 2013, Brooks et al 2005, Kelly 2000, Metzger et al 2006, Pandey and Bardsley 2015, McManus et al 2014 are several previous studies
which used equity in their indicators, on the assumption that greater levels of equality were positively correlated with adaptive capacity.
Management and Institutions – existence of government plans: Governmental management is a huge factor in adaptive capacity and general well-being. Effective government is also measured in a number of ways, and has been used for many different indicator systems, but for the purpose of this study existence of emergency plans were chosen to show government attention to adaptive capacity. Trends show that rural areas do not receive the same level of service from government entities as urban areas (UN 2014). Brooks et al 2005, Cutter et al 2008, Jubeh and Mimi 2012, Kelly 2000, Sietchipeng 2006, and Posey 2009 all utilized a measure of government or institutions in their studies.
Technology and Infrastructure – internet access: Internet access was chosen to represent technology and infrastructure. Internet access is and will continue to be a major conduit of information access, which is crucial for adaptation. Internet access tends to be higher
in urban areas, and is an important technology. There are a number of factors that influence internet access and its diffusion, but “countries with a larger urban population
and stronger participation within a global network of urban civilization would develop
the internet faster than others” (Li and Shiu 2012). Acosta et al 2013, Cutter et al 2008,
Metzger et al 2006, Sietchipeng 2006, Vincent 2007, Ahsan and Warner 2014, Salik et al 2015, Xenarios et al 2016, Nhuan et al 2016, and Panda et al 2013 all highlighted the importance of technology and infrastructure in their indicator systems.
2.3.4 Scenario Building
IPCC defines a scenario as a coherent, internally consistent description of a future state. The basis for scenario building in this study are several IPCC reports. The Special Report on Emission Scenarios (2000) and Chapter 3 of Working Group II from TAR on Developing and Application of Scenarios (2001) and Scenario Process for AR5 (2014) are the key references used in this research.
Socioeconomic, land use and land cover, environmental, climate, and sea-level rise, are the types of scenarios outlined by IPCC. They can each have a number of functions, such as illustrating impacts of climate change, to communicate potential consequences, to assist in strategic planning, guide emission policies, or for other methodological purposes (IPCC 2001). Because the emphasis of this study, land use and land cover change is the scenario used, based on socioeconomic rather than climatic drivers. Land use can be affected by climate change but tends to be mostly influenced by socioeconomic trends.
The Special Report on Emission Scenarios (SRES) created four different narrative storylines based on socioeconomic development paths (2000). The scenarios fall along two axes, A to B and 1 to 2. A represents an emphasis on rapid economic growth, whereas B is environmentally and equity oriented. Scenarios that fall along 1 are more globally oriented, in contrast to regionally or locally centered scenarios along B.
For Assessment Report 5 (AR5), IPCC changed their approach to scenarios from a sequential approach to a parallel approach, as shown in Figure 5 from the IPCC website (2014). No new SRES would be published, IPCC would instead take on an assistive role and rely on scenarios created by the research community. Narrative storylines from SRES would continue to be referenced, but no longer as the first step in scenario generation.
IPCC, (2014) Figure 5: IPCC scenario approach
One previous study that has utilized the storylines to investigate adaptive capacity or vulnerability is Acosta et al (2006), which models adaptive capacity in Europe under the four storylines, A1, A2, B1, and B2 with twelve socioeconomic indicators. But not many studies combine future scenarios, land use change, and indicator systems, and thus this research aims to address, in part, this gap.
2.4 Conclusion
In order to prepare for the inevitable climatic changes of the future, local adaptation strategies are key to attempting to allay potential harm, such as sea level rise
or changes in precipitation patterns, but to do so assessments of adaptive capacity must be made. Such a task is a complex undertaking, requiring a clear understanding terms such as adaptation, adaptive capacity, vulnerability, and resilience, as well as their relation to each other, to make appropriate decisions and contextualize information.
Their different perspectives allows for and necessitates an interdisciplinary approach to climate change adaptation policy. Furthermore, when measuring adaptive capacity, limitations of measurement methods must be kept in mind. This study focuses on adaptive capacity through the lens of urbanization, which is not only a wider global phenomenon but a specific direction of LULC change, namely, from vegetated land cover to agriculture and built-up land.
To investigate this, an adaptive capacity indicator was constructed based on socioeconomic and biophysical indicators affected by land use change, called the Urbanizing Adaptive Capacity Index (UACI). Two sites—Tamsui, Taiwan and West Palm Beach, US – were chosen as case studies to illustrate the difference between three different scenarios. This literature reviewed the conceptual underpinnings of this research, as well as some literature-based justifications for methodological directions, which will be elaborated on in the next section.