TGR5 activation ameliorates hyperglycemia-induced cardiac hypertrophy in H9c2 cells
Kai-Chun Cheng
1, Wei-Ting Chang
2,3, Feng Yu Kuo
4, Zhih-Cherng Chen
2,5, Yingxiao Li
1,3&
Juei-Tang Cheng
3Left ventricular hypertrophy is an independent risk factor in diabetic patients. TGR5 is shown to express in hearts, but its functional role in diabetes-induced cardiac hypertrophy remained unclear. The current study investigated the role of TGR5 on high glucose-induced hypertrophy of H9C2 cells. After incubation with a high level of glucose, H9C2 cells showed hypertrophic responses. Activation of TGR5 by lithocholic acid (LCA) ameliorated cell hypertrophy and enhanced SERCA2a and phosphorylated phospholamban (PLN) expression in H9C2 cells. Triamterene inhibited these effects at an effective dose to block TGR5. However, LCA failed to modify the free radical elevation induced by high-glucose in the H9c2 cells. Moreover, PKA inhibitors, but not an Epac blocker, markedly improved hyperglycemia- induced hypertrophy and attenuated the increased SERCA2a expression by LCA; it also attenuated the phosphorylated PLN and SERCA2a protein expression levels in high glucose-treated H9C2 cells. In conclusion, TGR5 activation stimulated protein kinase A (PKA) to enhance PLN phosphorylation, which activated SERCA2a to remove Ca2+ from cytosol to sarcoplasmic reticulum in addition to the reduction of calcineurin/NFAT pathway signaling to ameliorate the hyperglycemia-induced cardiac hypertrophy shown in cardiomyocytes. TGR5 may service as a new target in the control of diabetic cardiomyopathy.
Bile acids (BAs) have been introduced as the byproducts of cholesterol metabolism in liver to secret into the duo- denum1. Recently, BAs were also recognized as signaling molecules that may integrate with TGR5 or muscarinic receptors, the plasma membrane G-protein-coupled receptors, in addition to the nuclear receptors, including the farnesoid (FXR) and pregnane (PXR) xenobiotic receptors. The roles of BAs in regulating metabolic homeo- stasis and other important physiological functions have been documented2,3. BA binding sites and/or receptors are known to express in cardiovascular tissue, but the details regarding BA-induced changes in cardiovascular function are still unclear4.
TGR5, also named as M-BAR, BG37 or GPBAR1, is belonged to G-protein-coupled receptors (GPCRs).
Therefore, TGR5 activation may induce cyclic AMP (cAMP) accumulation5. TGR5 expression has been identified in cardiomyocytes6. However, most observations were challenged to conduct the association between TGR5 and cardiac modulation without a direct effect4.
Cardiac hypertrophy, one of the initial disorders in cardiovascular system, is known to induce heart fail- ure. Cardiac hypertrophy is usually identified by an increase in cell size including physiological and pathologi- cal hypertrophy7. Additionally, cardiac hypertrophy is also introduced as an elevation in protein synthesis and/
or reactivation of the fetal gene program in cellular levels8. During the hypertrophic stimulation, calcineurinn dephosphorylated the nuclear factor of activated T-cells (NFAT) that may translocate into the nucleus to promote the gene expression, partly after forming a complex with GATA4. Therefore, calcineurin and NFAT are known for activation of the fetal gene program in response to hypertrophic stimuli, and they function as essential effec- tors during the formation of cardiac hypertrophy9. Consequently, atrial natriuretic peptide (ANP) and B-type natriuretic peptide (BNP) levels, which are raised as a result of hypertrophic gene expression, are used as clinical
1Department of Psychosomatic internal Medicine, Kagoshima University Graduate School of Medical and Dental Sciences, Kagoshima, 890, Japan. 2Department of Cardiology, Chi-Mei Medical Center, Yong Kang, Tainan City, 71003, Taiwan. 3Department of Medical Research, Chi-Mei Medical Center, Yong Kang, Tainan City, 71003, Taiwan.
4Cardiovascular Center, Veterans General Hospital, Kaohsiung City, 81362, Taiwan. 5Department of Pharmacy, chia Nan University of Pharmacy & Science, Jean-Tae City, Tainan County, 71701, Taiwan. Correspondence and requests for materials should be addressed to Y.L. (email: yingxiaoli009@gmail.com) or J.-T.C. (email: jtcheng@mail.cjcu.
edu.tw) Received: 22 October 2018
Accepted: 6 February 2019 Published: xx xx xxxx
OPEN
indicators10. Interestingly, ANP has shown antihypertrophic properties11. Moreover, the Ca2+ -calcineurin-NFAT signaling may integrate with another pathway, such as protein kinase C or mitogen-activated protein kinases (MAPKs), to coordinate the hypertrophic response12. Additionally, more transcription factors participated in cardiac hypertrophy were mentioned to explain it in detail13.
Diabetic cardiomyopathy (DCM) is one of the diabetic complication; cardiomyocytes exposed to high glucose levels exacerbates the hypertrophic response14. Many studies have used H9c2 cells to investigate hyperglycemia-induced cardiac damage15,16. However, the effect of TGR5 on DCM remains unknown4. Llithocholic acid (LCA), has been shown to modulate the bile acid pool and can specifically activate TGR517. Thus, we used LCA to activate TGR5 and investigated the mechanism for alleviating the hyperglycemia-induced cardiac hypertrophy in cultured cardiac H9c2 cells. Additionally, cyclic AMP (cAMP) is the major cellular signal coupled to TGR55. In the cAMP signaling pathway, protein kinase A (PKA) is activated by elevations in cAMP, and the exchange protein directly activated by cAMP (Epac) has been reported as another regulator of cAMP in the heart18. Therefore, we used specific inhibitors to investigate the potential mediation of LCA-induced effects in H9c2 cells by PKA or Epac.
Results
Lithocholic acid alleviates high glucose-induced cardiac hypertrophy in H9c2 cells.
In Fig. 1A, H9c2 cells exposed to high glucose (30 mmol/l) demonstrated a profound hypertrophic response. The media- tion of osmolarity in the effects of high-glucose has been previously ruled out19. High-glucose treatment signif- icantly increased in cardiomyocyte size compared to that of the normal group. Moreover, LCA inhibited high glucose-induced increases in cell size in a dose-dependent manner (Fig. 1A). Quantification of the changes in cell size is shown in Table 1. Additionally, changes in biomarker levels for cardiac hypertrophy were also assessed (Table 1); the results showed that ANP, BNP, and β-MHC mRNA levels changed in parallel. High glucose induced a marked upregulation of hypertrophy-associated signals, such as calcineurin and nuclear NFAT, as shown in Fig. 1B, and they were reversed by LCA treatment (Table 1). Although high-glucose increased the mRNA levels of hypertrophic biomarkers, LCA could attenuate them in parallel (Table 1). Interestingly, TGR5 protein expres- sion was higher in hyperglycemic condition and it was further dose-dependently increased by LCA (Fig. 1B).Therefore, we identified that LCA may alleviate the hyperglycemia-induced cardiac hypertrophy using cultured cardiomyocytes.
Triamterene inhibits the effect of lithocholic acid in H9c2 cells.
To assess whether the effects of LCA were mediated by TGR5 in the cardiomyocyte, triamterene has been used as a TGR5 inhibitor20. In H9c2 cells, triamterene at doses sufficient attenuated the LCA-induced changes in cell size and hypertrophic signals (Fig. 1C,D), and the quantitative results were given in Table 2. Thus, the beneficial effects by LCA are mainly through an activation of TGR5 in H9c2 cells.High glucose treatment resulted in markedly increased calcium levels in H9c2 cells (Table 1). LCA sig- nificantly inhibited the increase in calcium levels (Table 1). As shown in Table 2, this action of LCA was also reversed by triamterene but it was not influenced by atropine at an effective dose to block muscarinic receptors.
Intracellular Ca2+ levels were 178.3 ± 3.8 nM in the presence of atropine (1 μM), which was similar (P > 0.05) to the level in vehicle-treated samples (173.7 ± 7.0 nM) induced by LCA (10 μM) under high-glucose condition.
Mediation of reactive oxygen species (ROS) in the effects of lithocholic acid in H9c2 cells.
As previously reported14, ROS induces DNA damage, which was markedly increased in H9c2 cells by high glucose (Fig. 2A). However, LCA treatment did not affect the increase in ROS, although the levels were markedly reduced by the antioxidant tiron.TGR5 activation prevents high glucose-mediated reduction of SERCA2a expression in H9c2 cells.
As shown in Fig. 2, SERCA2a expression was markedly reduced in H9c2 cells under high-glucose conditions. This trend was markedly reversed by LCA treatment and was also blocked by triamterene. Thus, TGR5 activation ameliorates the reduction in SERCA2a expression in H9c2 cells under high glucose conditions.Additionally, LCA also promoted PLN phosphorylation in the same manner (Fig. 2D).
The SERCA2a mRNA level was also modified by LCA, increasing markedly to 1.18 ± 0.08 from 0.69 ± 0.36 under high-glucose conditions. The effect of LCA was blocked by triamterene; the mRNA level was only increased to 0.86 ± 0.14, which showed no difference with that under high-glucose conditions. However, the effect of LCA was not modified by the pre-treatment of GLP-1 receptor blocker exendin (9–39); the SERCA2a mRNA level promoted by LCA did not differ between the cells pretreated with exendin (9–39) and vehicle (0.97 ± 0.16 vs.
0.98 ± 0.17) under the high-glucose conditions. Therefore, mediation of GLP-1 receptor activation by LCA appears unlikely.
Signaling coupled to TGR5 activation ameliorating high-glucose injury in H9c2 cells.
Western blotting analysis shown in Fig. 3B indicated that LCA-promoted PLN phosphorylation was reduced by treatment with pharmacological inhibitors specific for PKA but not Epac. Additionally, PKA inhibition (via PKA I or H-89) and Epac inhibition (via ESI-09) failed to affect TGR5 expression in H9c2 cells treated with LCA. Consequently, recovery of the decrease in SERCA2a expression induced by LCA was similarly influenced. Taken together, our results show that TGR5 activation by LCA induces elevation of cAMP to activate PKA and increase PLN phos- phorylation, which may relieve the inhibition of SERCA2a. Finally, the decrease in SERCA2a expression was reversed by LCA treatment.Effect of TGR5 activation on hypertrophy in H9c2 cells.
We utilized pharmacological inhibitors to identify major signaling pathways involved in H9c2 cell hypertrophy. As shown in Fig. 4, LCA alleviatedhypertrophy in a manner that was sensitive to PKA inhibitors but not to Epac inhibitors (Fig. 4C). Therefore, linkage of PKA with TGR5 activation may ameliorate the high-glucose stimulated hypertrophic response in H9c2 cells.
Discussion
The present study found that TGR5 activation might ameliorate hyperglycemia-induced hypertrophy in H9c2 cells. These novel results demonstrate the effectiveness of TGR5 in a relevant cell line. The presence of the TGR5 receptor in the heart has previously been demonstrated6. TGR5 activation has been reported to have cytoprotec- tive effects in the mouse heart21. TGR5 belonged to G-protein-coupled receptor, also named as M-BAR, GPBAR1 or BG37, is an established target of bile acids. Therefore, TGR5 activation may result in cAMP accumulation and/
or receptor internalization5. cAMP is introduced to stimulate cardiac function22, but mice with biliary fibrosis show cardiac dysfunction6. The influence of bile acids in heart seems likely due to an integration with TGR5 and muscarinic receptors, the plasma membrane G-protein-coupled receptors, in addition to the nuclear receptors, such as the FXR and PXR xenobiotic receptors2,3.
We used the rat-derived H9c2 cell line in current study to investigate the role of TGR5 activation according to previous report23. The cells were exposed to high glucose to mimic diabetic cardiomyopathy as described pre- viously15. Similarly, hypertrophy was identified in H9c2 cells under hyperglycemic conditions and was induced through the calcineurin/NFAT hypertrophic pathway based on Western blotting analysis. Then, we used the Figure 1. Effects of lithocholic acid (LCA) on high glucose-induced hypertrophy in H9c2 cells. (A)
Morphological changes in H9c2 cells maintained in high-glucose medium (High Glucose) treated with vehicle (Vehicle) were compared with those of cells treated with LCA at the indicated doses or cells grown in normal medium (Control) (n = 6). (B) Western blots showing the TGR5 and hypertrophic signaling protein expression levels in H9c2 cells treated as described above and indicated in the representative image (n = 4). (C) The morphological changes in H9c2 cells under high glucose (High Glucose) conditions attenuated by LCA were reversed with triamterene at the indicated doses (n = 6). (D) Western blots showing the TGR5 and hypertrophic signaling protein levels in H9c2 cells treated as described in (C) are indicated in the representative image (n = 4). The quantified data are shown in Table 1.
established cell model to investigate the influence of TGR5 activation using LCA, which has previously been documented as a physiological ligand for TGR524. Interestingly, LCA ameliorated the hypertrophy in H9c2 cells in a dose-dependent manner. The effects of LCA were reduced by triamterene treatment at a dose used to inhibit TGR520. Therefore, TGR5 activation alleviated hyperglycemia-induced hypertrophy in a cell model. These novel findings were supported by Western blotting data, which showed changes in hypertrophy-associated signaling proteins, and by RT-PCR, which was used to evaluate mRNA levels of hypertrophic biomarkers.
Oxidative stress is mentioned to involve in hyperglycemia-induced cardiac injury25 and is related to the development of diabetic cardiomyopathy26. The ROS-induced oxidative stress in cardiac and vascular myocytes is mentioned to link with cardiac hypertrophy27. The diabetic cardiomyopathy is developed by oxidative stress mainly due to the elevated ROS production and/or decreased antioxidant defenses28. High-glucose produces a marked elevation in ROS, including oxygen free radicals, in H9c2 cells29. Moreover, TGR5 activation appears to exert several effects on ROS production30. Our data showed that LCA reduced oxidative stress in hypertrophic H9c2 cells, which was consistent with previous reports27,28,31. However, LCA failed to modulate elevated free radical levels, which were significantly attenuated by treatment with the antioxidant tiron in H9c2 cells. This finding is similar to the effects of GLP-1 receptor activation, which showed that Exendin-4 did not affect the ROS levels elevated by high-glucose in neonatal cardiomyocytes32. Thus, the effects are downstream of free rad- icals and are likely associated with endoplasmic reticulum stress. Moreover, apoptosis is popularly used indicate the hyperglycemia-induced cardiac damage16,25,32. However, hypertrophic and apoptotic signaling pathways are known to be regulated by ROS in cardiac myocytes27. Cells possessed various sensitivities to oxidative stress, which leads to myocyte-specific hypertrophy and apoptosis phenotypes. H2O2 has been shown to induce hyper- trophy at a dose lower than that used to produce apoptosis in H9c2 cells33 and adult rat cardiac myocytes34. In addition to observations in clinical practice, cardiac hypertrophy has been identified in mice with excess bile acid levels6. Therefore, we focused on hypertrophic changes in cardiac cells.
Calcium ions are known as the key-regulator of cardiac hypertrophy9,12. Although cardiac transcription fac- tors are involved in hypertrophic responses13, the Ca2+-calcineurin-NFAT cascade has been established as the main pathway responsible for cardiac hypertrophy12. In the present study, high glucose levels increased Ca2+
levels in cardiac myocytes15,35. LCA attenuated the increased Ca2+ levels in a dose-dependent manner, and tri- amterene treatment revered these effects at a dose enough to inhibit TGR5. However, atropine treatment did not modify the effectiveness of LCA in H9c2 cells. The muscarinic M2 receptor has been reported to mediate bile acid-induced protection of arrhythmia in the heart36. These results agreed with a recent report using neonatal murine cardiomyocytes37 showing that ursodeoxycholic acid (UDCA) is a specific agonist of TGR5 but not FXR or M2 receptors. Therefore, LCA may reduce intracellular Ca2+ levels in H9c2 cells primarily through TGR5 activation.
The mechanisms underlying the reduction in Ca2+ levels in H9c2 cells in response to TGR5 activation did not associate with a decrease in free radicals, as shown above. Diabetic cardiomyopathy is related with a reduction in sarco/endoplasmic reticulum Ca2+ ATPase-2a (SERCA2a) expression and/or activity32. A decrease in SERCA2a levels is known to correlate with a lower myocardial function in addition to the impaired force-frequency and
Parameters Control Vehicle in High
Glucose LCA (1 × 10⁻⁶M)
in High Glucose LCA (5 × 10⁻⁶M) in High Glucose Cell size level (fold change)
(n = 4) 1.00 ± 0.14 4.86 ± 0.18** 2.47 ± 0.15*# 0.98 ± 0.12##
Relative level of ANP/β-actin
(n = 6) 1.00 ± 0.00 1.92 ± 0.05** 1.45 ± 0.06*# 1.01 ± 0.07##
Relative level of BNP/β-actin
(n = 6) 1.00 ± 0.00 1.75 ± 0.07** 1.39 ± 0.04*# 1.11 ± 0.03##
Relative level of β-MHC/β-actin
(n = 6) 1.00 ± 0.00 1.92 ± 0.05** 0.31 ± 0.05*# 0.92 ± 0.10##
[Ca2 + ](nM)
(n = 6) 184.25 ± 6.23 216.00 ± 5.31** 226.32 ± 2.02*# 186.94 ± 4.86##
Ratio of TGR5/β-actin protein
(n = 4) 0.41 ± 0.05 0.57 ± 0.03* 0.69 ± 0.08**# 0.86 ± 0.10**##
Ratio of Calcineurin/β-actin protein
(n = 4) 0.38 ± 0.04 0.80 ± 0.07** 0.60 ± 0.04*# 0.38 ± 0.06##
Ratio of NFAT3/Histone H3 protein
(n = 4) 0.52 ± 0.06 0.91 ± 0.11** 0.69 ± 0.04*# 0.56 ± 0.03##
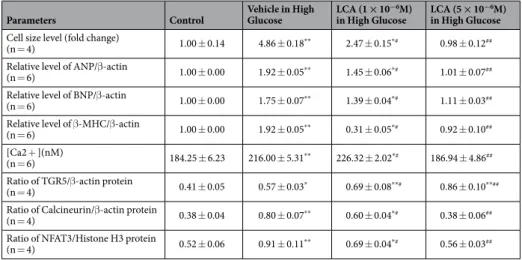
Table 1. Effects of lithocholic acid (LCA) on the mRNA levels of hypertrophic biomarkers and intracellular calcium ions, in addition to the quantified data from Fig. 1A,B. The changes in cell size shown in Fig. 1A were quantified for comparison in the first. The cell size was markedly enhanced by almost 5-fold by high glucose treatment (30 mM) in H9c2 cells and was reduced by lithocholic acid (LCA) treatment at the indicated doses. Similarly, the mRNA levels of hypertrophic markers, including ANP, BNP, and β-MHC, promoted by high glucose were also attenuated by LCA treatment in a dose-related manner. The merits of LCA for the amelioration of the hypertrophic response were supported by the changes in hypertrophic signals through calcineurin and NFAT3, as shown in the last two rows. Moreover, the intracellular calcium levels are indicated in the middle of the table. Each value is shown as the mean ± SEM at the indicated sample size (n) per group.
*P < 0.05 and **P < 0.01 vs the control. #P < 0.05 and ##P < 0.01 vs the vehicle-treated samples in high glucose (Vehicle in High Glucose).
diastolic responses that may appear during the heart failure41. The membrane protein PLN is known to bind to SERCA2a, and phosphorylation of PLN may reduce SERCA2a inhibition and enhance SERCA2a function38. In current study, SERCA2a expression is markedly decreased by high-glucose in H9c2 cells32. Similarly, phospho- rylated PLN was reduced. Triamterene blocked the effects of LCA at a dose used to inhibit TGR5. Our find- ings are similar to previous results regarding the GLP-1 receptor activation in neonatal mouse cardiomyocytes32. However, exendin-(9–39), the specific antagonist of GLP-1 receptor, did not modulate the LCA-induced changes in SERCA2a mRNA levels, which indicated that direct stimulation of GLP-1 receptors by LCA appears unlikely to occur.
Phosphorylation of PLN has been suggested to be cAMP-dependent39. TGR5 is known to enhance the cAMP accumulation5. Thus, TGR5 activation may promote PLN phosphorylation, as has been characterized in the cur- rent study. The classical cAMP effectors, e.g., PKA, and the exchange protein directly activated by cAMP (Epac), have been indicated in heart tissue38. We were therefore using pharmacological inhibitors to investigate the poten- tial mediation by PKA or Epac on LCA-induced effects in H9c2 cells. Two pharmacologic inhibitors of PKA atten- uated the effectiveness of LCA, however, an Epac blocker failed to produce similar inhibition. Thus, the increase in PLN phosphorylation by TGR5 activation is likely primarily PKA-dependent, which is similar to the GLP-1 receptor activation in neonatal murine cardiomyocytes32. PKA activates PLN via phosphorylation at Ser1639. It is interesting that LCA enhanced both SERCA2a and phosphorylated PLN levels. However, administration of PKA inhibitors and an Epac inhibitor did not affect the activation of TGR5 induced by LCA, which implied that a TGR5-triggered PKA/cAMP signaling pathway appears unidirectional. SERCA2a removes Ca2+ from cytosolic fraction to the sarcoplasmic reticulum, which is consistent with the reduction in the cellular Ca2+ levels induced by TGR5 activation. In animals, SERCA2a overexpressed hearts show an enhanced contractility, while SERCA2a knock-out mice develop heart failure earlier than the wild-type mice after pressure overload39. However, treat- ment with a TGR5 agonist did not modify the contractility in cardiomyocytes37. SERCA2a activated by a TGR5 agonist appears largely responsible for removing Ca2+ to the sarcoplasmic reticulum, which may alleviate hyper- trophic responses in H9c2 cells. Therefore, as shown in Fig. 4, PKA inhibitor treatment reversed the effectiveness of TGR5 activation based on amelioration of hypertrophy in H9c2 cells.
There are certain limitations to the present study. Application of an animal model of hyperglycemia, primary rat cardiomyocyte culture and genetic manipulation of TGR5 to further clarify the role of TGR5 in cardiac hyper- trophy will be included in future work.
In summary, we report novel findings that TGR5 activation may ameliorate the hypertrophic response in car- diac cells. TGR5 activation may stimulate PKA to enhance the phosphorylation of PLN, which activates SERCA2a to remove Ca2+ from cytosolic fraction and reduce hypertrophic signaling, e.g., via the calcineurin/NFAT path- way, to alleviate hypertrophy in H9c2 cells.
Materials and Methods
Materials.
Atropine and exendin (9–39) from Sigma-Aldrich (St. Louis, MO, USA) were prepared in solu- tion using culture medium. Additionally, lithocholic acid and triamterene from same supplier were prepared in dimethyl sulfoxide (DMSO) as stock solutions. The PKA inhibitor 14–22 amide (PKA I) is myristoylated at the N-terminus, which enhances its cell permeability (Tocris Bioscience, Bristol, UK). H89 is a potent selectiveParameters Control Vehicle in High
Glucose LCA(5 × 10⁻⁶ M)
in High Glucose Triamterene(5 × 10⁻⁷M) + LCA
(5 × 10⁻⁶ M) in High Glucose Triamterene(1 × 10⁻⁶M) + LCA (5 × 10⁻⁶ M) in High Glucose Cell size level (fold change) (n = 4) 1.00 ± 0.10 3.51 ± 0.22** 1.09 ± 0.14## 1.94 ± 0.13*# 3.81 ± 0.25**
Relative level of ANP/β-actin (n = 6) 1.00 ± 0.00 1.87 ± 0.07** 1.18 ± 0.09## 1.48 ± 0.04*# 1.94 ± 0.03**
Relative level of BNP/β-actin (n = 6) 1.00 ± 0.00 1.85 ± 0.05** 1.14 ± 0.05## 1.52 ± 0.04*# 1.75 ± 0.07**
Relative level of β-MHC/β-actin (n = 6) 1.00 ± 0.00 1.85 ± 0.03** 1.17 ± 0.05## 1.49 ± 0.07*# 1.93 ± 0.03**
[Ca2+](nM) (n = 6) 168.19 ± 4.65 247.83 ± 6.47** 175.03 ± 4.57## 199.33 ± 7.20*# 239.05 ± 8.16**
Ratio of TGR5/β-actin protein (n = 4) 0.28 ± 0.03 0.58 ± 0.05* 0.83 ± 0.07**# 0.70 ± 0.09**# 0.54 ± 0.02* Ratio of Calcineurin/β-actin protein (n = 4) 0.33 ± 0.06 0.86 ± 0.03** 0.50 ± 0.04## 0.67 ± 0.03*# 0.84 ± 0.08**
Ratio of NFAT3/Histone H3 protein (n = 4) 0.41 ± 0.06 0.78 ± 0.08** 0.43 ± 0.08## 0.61 ± 0.05*# 0.76 ± 0.06**
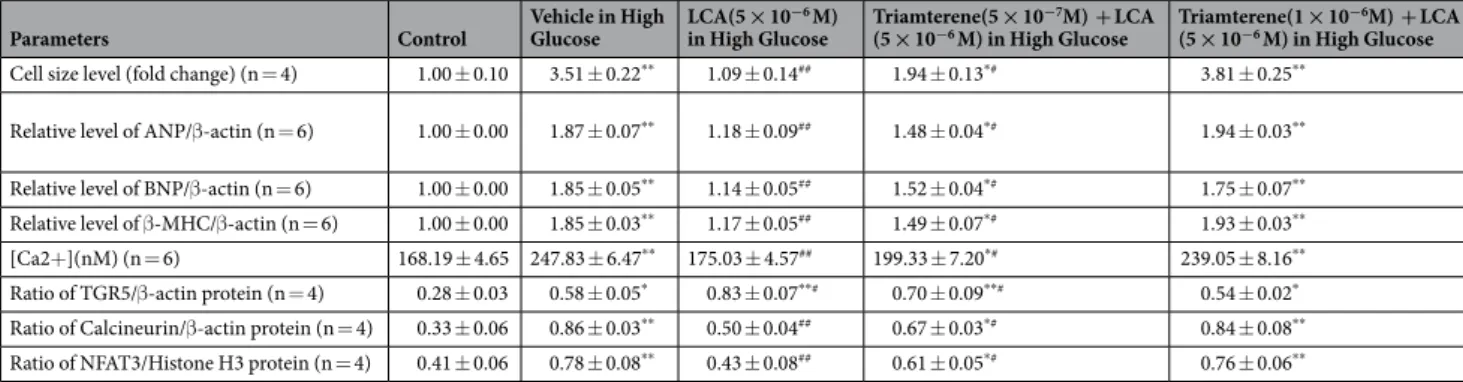
Table 2. Triamterene inhibited the effects of lithocholic acid (LCA) on the mRNA levels of hypertrophic biomarkers and intracellular calcium ions, in addition to the quantified data from Fig. 1C,D The changes in cell size shown in Fig. 1C were quantified for comparison in the first row. The cell size enhanced by high glucose (30 mM) in the H9c2 cells was reduced by lithocholic acid (LCA) at the indicated dose, and this effect was reversed by triamterene in a dose-related manner. Similarly, the increased mRNA levels of hypertrophic markers, including ANP, BNP, and β-MHC, by high glucose that was attenuated by LCA were also reversed by triamterene. The merits of LCA for the amelioration of cellular hypertrophy, which was supported by changes in hypertrophic signals of calcineurin and NFAT3, were reversed by triamterene as shown in the last two rows.
Moreover, similar changes in the calcium levels are indicated in the middle of the table. Each value is shown as the mean ± SEM at the indicated sample size (n) per group. *P < 0.05 and **P < 0.01 vs the control. #P < 0.05 and ##P < 0.01 vs the vehicle-treated samples in high glucose (Vehicle in High Glucose).
inhibitor of PKA (Sigma-Aldrich). ESI-09 (Sigma-Aldrich) has been shown to block EPAC activity and function.
Other reagents from indicated suppliers were all of analytical grade.
Cell culture and treatment.
H9c2 cardiomyoblast cell line (BCRC No. 60096) was cultured in Dulbecco’s modified Eagle’s medium (DMEM) and Supplemented with 10% FBS. To generate the cellular model of cardiac hypertrophy, high-glucose medium containing 30 mmol/L glucose and 2% FBS H9c2 cells were used to incubate with H9c2 cells for 48 h after achieving 70% confluence. The D-glucose (Sigma) was dissolved in normal medium to prepare a medium with 30 mmol/L glucose. In preliminary experiments, the hypertrophic responses were compared between H9c2 cells and primary rat neonatal cardiomyocytes under high-glucose conditions using RT-PCR. The mRNA level of hypertrophic genes, such as BNP and β-MHC40, in H9c2 cells was not varied with that in primary rat neonatal cardiomyocytes. It is the same as a previous report that hypertrophic responses in H9C2 cell line were similar as primary neonatal cardiomyocyte cells in vitro41.Measurement of hypertrophy in cells.
Cells seeded into a 24-well plate were starved in the serum-free medium for 4 h before the treatment with a TGR5 agonist (lithocholic acid) for 72 h. Following treatment, at room Figure 2. Effects of lithocholic acid (LCA) on oxidative stress-related signals in H9c2 cells with high glucose- induced hypertrophy. (A) Expression of ROS in H9c2 cells characterized using fluorescence as indicated in the upper panel. The quantified data from 6 experiments are compared in the lower panel (n = 6). (B) The ROS expression in H9c2 cells is characterized as described above. The results show that ROS elevated by high glucose was markedly reduced by the antioxidant tiron, but not by LCA (n = 6). (C) Representative image of Western blots indicating changes in protein levels of TGR5, SERCA2, phospholamban (PLN), and phosphorylated PLN (PPLN) using Actin as an internal control (n = 4). (D) The density of the different bands was quantified and compared (n = 4). The upper panel shows the variations in TGR5/Actin among the 4 groups, the middle panel compares the differences in PPLN/PLN expression among the 4 groups, and the lower panel shows the changes in SERCA2/Actin expression among the 4 groups (n = 4). The results from (C) and (D) suggest that the LCA-induced alleviation of the changes induced by high glucose was blocked by triamterene (*p-value < 0.05,**p-value < 0.01 versus control group; #p-value < 0.05, ##p-value < 0.01 versus vehicle group).
temperature, we fixed the cells with 4% paraformaldehyde for 15 min and permeabilized them with 0.5% Triton X-100 for another 5 min. The actin filaments in cells were characterized after staining with rhodamine phalloidin (Invitrogen, Carlsbad, CA, USA) for 20 min. Then, the nucleus was identified with 4–6-diamidino-2-phenylindole dihydrochloride (DAPI) (Abcam, Cambridge, MA, USA) after staining for 15 min. Cells were imaged under flu- orescence microscope (IX71; Olympus, Tokyo, Japan; magnification, ×200) with an imaging system (DP2-BSW) from same supplier. We measured the myocytes that completely observed in the field. Changes in cell size were then quantified using NIH ImageJ software42.
Identification of intracellular ROS levels.
In the present study, dihydroethidium (DHE) (Thermo Fisher Scientific Inc., Rockford, IL, USA) is applied to detect the intracellular ROS levels. Similar to a previous report43, H9c2 cells were seeded at a density of 7.5 × 10³ cells/ml in 24-well plates to incubate overnight. The cells were starved for 4 h and then exposed to LCA at the effective doses for another 72 h. After treatment, cells were incu- bated with 10 μM of DHE for 30 min at 37 °C. They were then fixed and imaged as described previously43. Five images of each sample were randomly selected under a microscope, and the average was used for analysis. We compared the results shown as percentage of the ROS level in cells from the image analysis as described above42.Measurement of changes in intracellular calcium levels.
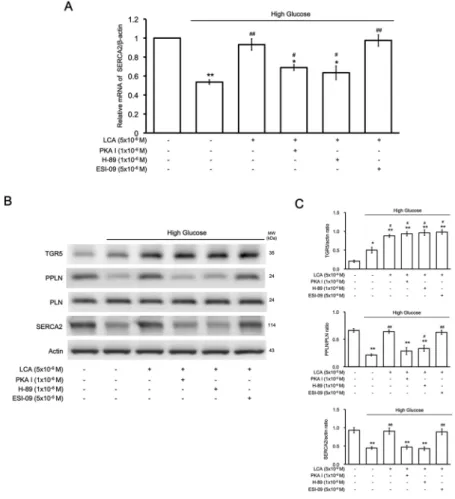
We measured the intracellular calcium lev- els using fura-2, a fluorescent probe, as described previously44. Changes in fluorescence were recorded using a fluorescence spectrofluorometer (F-2000; Hitachi, Tokyo, Japan). The [Ca2+]i values were estimated according to our previous report44. Background autofluorescence obtained from the unloaded cells was subtracted from all measurements. Additionally, the inhibitor effectiveness was compared after a 30-min pretreatment.Figure 3. Identification of the signaling pathway responsible for lithocholic acid (LCA)-induced effects in H9c2 cells incubated in high-glucose medium. (A) Effects of LCA on the SERCA2 mRNA levels modified by high glucose in H9c2 cells were blocked by the protein kinase A (PKA) inhibitors PKAI and H-89, but not by the Epac inhibitor ESI-09 (n = 6). (B) Representative image of Western blots indicating the changes in protein levels of TGR5, SERCA2, phospholamban (PLN), and phosphorylated PLN (PPLN) using Actin as an internal control (n = 4). (C) The upper panel shows the variations in TGR5/Actin expression between the 6 groups, the middle panel compares the differences in PPLN/PLN expression between the 6 groups, and the lower panel shows changes in SERCA2/Actin expression between the 6 groups. The results indicate that cells treated with high glucose that improved with LCA treatment were blocked by the PKA inhibitors but not by the Epac inhibitor (n = 4), (* p-value < 0.05, **p-value < 0.01 versus control group; #p-value < 0.05, ##p-value < 0.01 versus vehicle group).
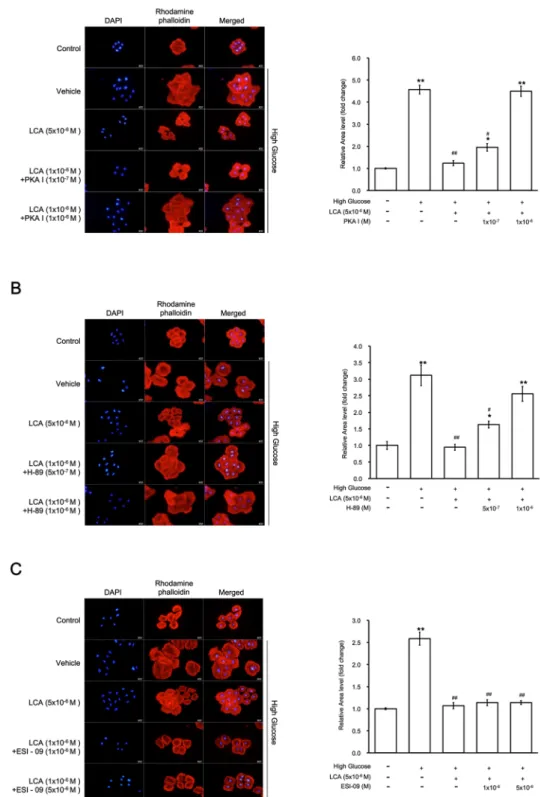
Figure 4. The effects of lithocholic acid (LCA) on hypertrophy are mainly mediated through protein kinase A (PKA) in H9c2 cells. (A) The effects of LCA were reversed by PKAI at the indicated doses; the right side shows the morphological changes in H9c2 cells, and the left side indicates the quantified data. (B) The effects of LCA treatment were also reversed by H-89 at the indicated doses; the right side shows the morphological changes in H9c2 cells, and the left side indicated the quantified data as described above. (C) Effects of LCA were not modified by ESI-09 treatment at doses effective to inhibit Epac; the right side shows the morphological changes in H9c2 cells, and the left side indicates the quantified data as above. Therefore, the LCA-induced alleviation of hypertrophy induced by high glucose is mainly mediated through the PKA pathway (*p-value < 0.05,
**p-value < 0.01 versus control group; #p-value < 0.05, ##p-value < 0.01 versus vehicle group, n = 6).
Nuclear extraction.
Nuclear fractions were extracted by the application of CNMCS Compartmental Protein Extraction Kit (BioChain Institute, Inc., Hayward, CA, USA) following a previous report45.Real-time reverse transcription-polymerase chain reaction (RT-PCR).
Following our previous report46, we estimated the mRNA level of each signaling target gene in current study. Briefly, TRIzol reagent (Invitrogen, Carlsbad, CA, USA) is applied to extract the total RNA from cell lysates. Then, 200 ng of the total RNA was reverse-transcribed into cDNA using the random hexamer primers (Roche Diagnostics, Mannheim, Germany). All PCR experiments were performed using a LightCycler (Roche Diagnostics GmbH, Mannheim, Germany). The primers for ANP, BNP, β-myosin heavy chain (β-MHC), SERCA2a, and β-actin are as follows:ANP F: 5′-CACAGATCTGATGGATTTCAAGA-3′;
ANP R: 5′-CCTCATCTTCTACCGGCATC-3′;
BNP F: 5′-GTCAGTCGCTTGGGCTGT-3′;
BNP R: 5′-CCAGAGCTGGGGAAAGAAG-3′;
β-MHC F: 5′-CATCCCCAATGAGACGAAGT-3′;
β-MHC R: 5′-GGGAAGCCCTTCCTACAGAT-3′;
SERCA2a F: 5′-ATTGTTCGAAGTCTGCCTTCTGTGG-3′;
SERCA2a R: 5′-CATAGGTTGATCCAGTTATGGTAAA-3′;
β-actin F: 5′-CTAAGGCCAACCGTGAAAAG-3′;
β-actin R: 5′-GCCTGGATGGCTACGTACA-3′.
Western Blotting Analysis.
Western blotting analysis was performed using our previous method42. Protein extract were loaded at equal amounts into SDS-PAGE and transferred to a polyvinylidene difluoride membrane. Western blots were preformed to probe for calcineurin (Sigma-Aldrich, St. Louis, MO, USA), NFAT3 (Thermo-Fisher Sci., Rockford, IL, USA), SERCA2a (Cell Signaling), phospholamban (PLN) (Cell Signaling), and phosphorylated PLN (P-PLN) (S16/T17; Cell Signaling) in addition to the internal standard, β-actin (Sigma-Aldrich, St. Louis, MO, USA) and Histone H3 (Santa Cruz, Dallas, TX, USA). Subsequently, membranes were washed with 1 × PBS-Tween and hybridized with appropriate secondary antibody (1:5000). Membranes were incubated with the ECL detection reagent and imaged using the Avegene imaging system (Avegene Life Science, Taipei, Taiwan). Densities of the bands were quantified using NIH ImageJ software and normalized to β-actin or Histone H3 expression45. This assay was replicated with 4 independent experiments.Statistical Analysis.
Results shown as means ± SEM were calculated from the determined samples (n) in each group. Statistical analysis using two-way analysis of variance (ANOVA) followed by Tukey’s post hoc analysis was used to compare the differences. Then, p < 0.05 was considered significant.References
1. Russell, D. W. The enzymes, regulation, and genetics of bile acid synthesis. Annual review of biochemistry 72, 137–174, https://doi.
org/10.1146/annurev.biochem.72.121801.161712 (2003).
2. Staels, B. & Fonseca, V. A. Bile acids and metabolic regulation: mechanisms and clinical responses to bile acid sequestration. Diabetes care 32(Suppl 2), S237–245, https://doi.org/10.2337/dc09-S355 (2009).
3. Vallim, T. Q. & Edwards, P. A. Bile acids have the gall to function as hormones. Cell metabolism 10, 162–164, https://doi.
org/10.1016/j.cmet.2009.08.005 (2009).
4. Khurana, S., Raufman, J. P. & Pallone, T. L. Bile acids regulate cardiovascular function. Clinical and translational science 4, 210–218, https://doi.org/10.1111/j.1752-8062.2011.00272.x (2011).
5. Tiwari, A. & Maiti, P. TGR5: an emerging bile acid G-protein-coupled receptor target for the potential treatment of metabolic disorders. Drug Discov Today 14, 523–530, https://doi.org/10.1016/j.drudis.2009.02.005 (2009).
6. Desai, M. S. et al. Hypertrophic cardiomyopathy and dysregulation of cardiac energetics in a mouse model of biliary fibrosis.
Hepatology 51, 2097–2107, https://doi.org/10.1002/hep.23585 (2010).
7. Bernardo, B. C., Weeks, K. L., Pretorius, L. & McMullen, J. R. Molecular distinction between physiological and pathological cardiac hypertrophy: experimental findings and therapeutic strategies. Pharmacology & therapeutics 128, 191–227, https://doi.org/10.1016/j.
pharmthera.2010.04.005 (2010).
8. Sadoshima, J. & Izumo, S. The cellular and molecular response of cardiac myocytes to mechanical stress. Annual review of physiology 59, 551–571, https://doi.org/10.1146/annurev.physiol.59.1.551 (1997).
9. Heineke, J. & Molkentin, J. D. Regulation of cardiac hypertrophy by intracellular signalling pathways. Nature reviews. Molecular cell biology 7, 589–600, https://doi.org/10.1038/nrm1983 (2006).
10. Sagnella, G. A. Measurement and significance of circulating natriuretic peptides in cardiovascular disease. Clinical science 95, 519–529 (1998).
11. Calderone, A., Thaik, C. M., Takahashi, N., Chang, D. L. & Colucci, W. S. Nitric oxide, atrial natriuretic peptide, and cyclic GMP inhibit the growth-promoting effects of norepinephrine in cardiac myocytes and fibroblasts. The Journal of clinical investigation 101, 812–818, https://doi.org/10.1172/JCI119883 (1998).
12. Fiedler, B. & Wollert, K. C. Interference of antihypertrophic molecules and signaling pathways with the Ca2+−calcineurin-NFAT cascade in cardiac myocytes. Cardiovascular research 63, 450–457, https://doi.org/10.1016/j.cardiores.2004.04.002 (2004).
13. Akazawa, H. & Komuro, I. Roles of cardiac transcription factors in cardiac hypertrophy. Circulation research 92, 1079–1088, https://
doi.org/10.1161/01.RES.0000072977.86706.23 (2003).
14. Zuo, L., Youtz, D. J. & Wold, L. E. Particulate matter exposure exacerbates high glucose-induced cardiomyocyte dysfunction through ROS generation. PloS one 6, e23116, https://doi.org/10.1371/journal.pone.0023116 (2011).
15. Asadi, F., Razmi, A., Dehpour, A. R. & Shafiei, M. Tropisetron inhibits high glucose-induced calcineurin/NFAT hypertrophic pathway in H9c2 myocardial cells. The Journal of pharmacy and pharmacology 68, 485–493, https://doi.org/10.1111/jphp.12522 (2016).
16. Jiang, P. et al. Tiron ameliorates high glucose-induced cardiac myocyte apoptosis by PKCdelta-dependent inhibition of osteopontin.
Clinical and experimental pharmacology & physiology 44, 760–770, https://doi.org/10.1111/1440-1681.12762 (2017).
17. Roda, A. et al. Semisynthetic bile acid FXR and TGR5 agonists: physicochemical properties, pharmacokinetics, and metabolism in the rat. J Pharmacol Exp Ther 350, 56–68, https://doi.org/10.1124/jpet.114.214650 (2014).
18. Ruiz-Hurtado, G. et al. Epac in cardiac calcium signaling. Journal of molecular and cellular cardiology 58, 162–171, https://doi.
org/10.1016/j.yjmcc.2012.11.021 (2013).
19. Kuo, S. C. et al. Molecular mechanisms regarding potassium bromateinduced cardiac hypertrophy without apoptosis in H9c2 cells.
Mol Med Rep, https://doi.org/10.3892/mmr.2018.9470 (2018).
20. Li, Y. et al. Investigation of triamterene as an inhibitor of the TGR5receptor: identification in cells and animals. Drug design, development and therapy 11, 1127–1134, https://doi.org/10.2147/DDDT.S131892 (2017).
21. Eblimit, Z. et al. TGR5 activation induces cytoprotective changes in the heart and improves myocardial adaptability to physiologic, inotropic, and pressure-induced stress in mice. Cardiovasc Ther 36, e12462, https://doi.org/10.1111/1755-5922.12462 (2018).
22. Ye, Y. & Birnbaum, Y. Cyclic AMP-mediated pleiotropic effects of glucagon-like peptide-1 receptor activation. Focus on “Exendin-4 attenuates high glucose-induced cardiomyocyte apoptosis via inhibition of endoplasmic reticulum stress and activation of SERCA2a”. American journal of physiology. Cell physiology 304, C505–507, https://doi.org/10.1152/ajpcell.00419.2012 (2013).
23. Chen, Z. C. et al. Characterization of the mechanisms of the increase in PPARdelta expression induced by digoxin in the heart using the H9c2 cell line. British journal of pharmacology 163, 390–398, https://doi.org/10.1111/j.1476-5381.2011.01212.x (2011).
24. Sato, H. et al. Novel potent and selective bile acid derivatives as TGR5 agonists: biological screening, structure-activity relationships, and molecular modeling studies. Journal of medicinal chemistry 51, 1831–1841, https://doi.org/10.1021/jm7015864 (2008).
25. Li, Y., Li, Y., Feng, Q., Arnold, M. & Peng, T. Calpain activation contributes to hyperglycaemia-induced apoptosis in cardiomyocytes.
Cardiovascular research 84, 100–110, https://doi.org/10.1093/cvr/cvp189 (2009).
26. Tarquini, R., Lazzeri, C., Pala, L., Rotella, C. M. & Gensini, G. F. The diabetic cardiomyopathy. Acta diabetologica 48, 173–181, https://doi.org/10.1007/s00592-010-0180-x (2011).
27. Sabri, A., Hughie, H. H. & Lucchesi, P. A. Regulation of hypertrophic and apoptotic signaling pathways by reactive oxygen species in cardiac myocytes. Antioxidants & redox signaling 5, 731–740, https://doi.org/10.1089/152308603770380034 (2003).
28. Lorenzo, O., Ramirez, E., Picatoste, B., Egido, J. & Tunon, J. Alteration of energy substrates and ROS production in diabetic cardiomyopathy. Mediators of inflammation 2013, 461967, https://doi.org/10.1155/2013/461967 (2013).
29. Bugyei-Twum, A. et al. High glucose induces Smad activation via the transcriptional coregulator p300 and contributes to cardiac fibrosis and hypertrophy. Cardiovascular diabetology 13, 89, https://doi.org/10.1186/1475-2840-13-89 (2014).
30. Duboc, H., Tache, Y. & Hofmann, A. F. The bile acid TGR5 membrane receptor: from basic research to clinical application. Dig Liver Dis 46, 302–312, https://doi.org/10.1016/j.dld.2013.10.021 (2014).
31. Mortuza, R. & Chakrabarti, S. Glucose-induced cell signaling in the pathogenesis of diabetic cardiomyopathy. Heart failure reviews 19, 75–86, https://doi.org/10.1007/s10741-013-9381-z (2014).
32. Younce, C. W., Burmeister, M. A. & Ayala, J. E. Exendin-4 attenuates high glucose-induced cardiomyocyte apoptosis via inhibition of endoplasmic reticulum stress and activation of SERCA2a. American journal of physiology. Cell physiology 304, C508–518, https://
doi.org/10.1152/ajpcell.00248.2012 (2013).
33. Song, R. et al. H2O 2 induces myocardial hypertrophy in H9c2 cells: a potential role of Ube3a. Cardiovascular toxicology 15, 23–28, https://doi.org/10.1007/s12012-014-9264-0 (2015).
34. Kwon, S. H., Pimentel, D. R., Remondino, A., Sawyer, D. B. & Colucci, W. S. H(2)O(2) regulates cardiac myocyte phenotype via concentration-dependent activation of distinct kinase pathways. Journal of molecular and cellular cardiology 35, 615–621 (2003).
35. Smogorzewski, M., Galfayan, V. & Massry, S. G. High glucose concentration causes a rise in [Ca2+]i of cardiac myocytes. Kidney international 53, 1237–1243, https://doi.org/10.1046/j.1523-1755.1998.00868.x (1998).
36. Miragoli, M. et al. A protective antiarrhythmic role of ursodeoxycholic acid in an in vitro rat model of the cholestatic fetal heart.
Hepatology 54, 1282–1292, https://doi.org/10.1002/hep.24492 (2011).
37. Ibrahim, E. et al. Bile acids and their respective conjugates elicit different responses in neonatal cardiomyocytes: role of Gi protein, muscarinic receptors and TGR5. Scientific reports 8, 7110, https://doi.org/10.1038/s41598-018-25569-4 (2018).
38. Kranias, E. G. & Hajjar, R. J. Modulation of cardiac contractility by the phospholamban/SERCA2a regulatome. Circulation research 110, 1646–1660, https://doi.org/10.1161/CIRCRESAHA.111.259754 (2012).
39. Gwathmey, J. K., Yerevanian, A. I. & Hajjar, R. J. Cardiac gene therapy with SERCA2a: from bench to bedside. Journal of molecular and cellular cardiology 50, 803–812, https://doi.org/10.1016/j.yjmcc.2010.11.011 (2011).
40. Du, X. J. Divergence of hypertrophic growth and fetal gene profile: the influence of beta-blockers. Br J Pharmacol 152, 169–171, https://doi.org/10.1038/sj.bjp.0707353 (2007).
41. Watkins, S. J., Borthwick, G. M. & Arthur, H. M. The H9C2 cell line and primary neonatal cardiomyocyte cells show similar hypertrophic responses in vitro. In Vitro Cell Dev Biol Anim 47, 125–131, https://doi.org/10.1007/s11626-010-9368-1 (2011).
42. Lo, S. H. et al. Ginsenoside Rh2 Improves Cardiac Fibrosis via PPARdelta-STAT3 Signaling in Type 1-Like Diabetic Rats.
International journal of molecular sciences 18, https://doi.org/10.3390/ijms18071364 (2017).
43. Li, C. J., Lv, L., Li, H. & Yu, D. M. Cardiac fibrosis and dysfunction in experimental diabetic cardiomyopathy are ameliorated by alpha-lipoic acid. Cardiovascular diabetology 11, 73, https://doi.org/10.1186/1475-2840-11-73 (2012).
44. Lo, S. H. et al. Development of betulinic acid as an agonist of TGR5 receptor using a new in vitro assay. Drug design, development and therapy 10, 2669–2676, https://doi.org/10.2147/DDDT.S113197 (2016).
45. Wang, C. M. et al. Lung damage induced by hyperglycemia in diabetic rats: The role of signal transducer and activator of transcription 3 (STAT3). J Diabetes Complications 30, 1426–1433, https://doi.org/10.1016/j.jdiacomp.2016.07.005 (2016).
46. Cheng, K. C. et al. GW0742 activates peroxisome proliferator-activated receptor delta to reduce free radicals and alleviate cardiac hypertrophy induced by hyperglycemia in cultured H9c2 cells. J Cell Biochem 119, 9532–9542, https://doi.org/10.1002/jcb.27270 (2018).
Acknowledgements
We acknowledge Miss Cindy Y.L. Yen for help in the experiments and American Journal Experts (AJE) for editing. The present study was donated mainly by a grant from the Ministry of Science and Technology (MOST 104-2320-B-384-004-MY3) in Taiwan, the Republic of China.
Author Contributions
Y.L., K.C.C. designed the study and performed experiments. W.T.C., Z.C.C. and J.T.C. completed the literature searches and analyses. K.C.C., F.Y.K. performed the statistical analysis. All contributed authors have approved the final manuscript.
Additional Information
Supplementary information accompanies this paper at https://doi.org/10.1038/s41598-019-40002-0.
Competing Interests: The authors declare no competing interests.
Publisher’s note: Springer Nature remains neutral with regard to jurisdictional claims in published maps and institutional affiliations.
Open Access This article is licensed under a Creative Commons Attribution 4.0 International License, which permits use, sharing, adaptation, distribution and reproduction in any medium or format, as long as you give appropriate credit to the original author(s) and the source, provide a link to the Cre- ative Commons license, and indicate if changes were made. The images or other third party material in this article are included in the article’s Creative Commons license, unless indicated otherwise in a credit line to the material. If material is not included in the article’s Creative Commons license and your intended use is not per- mitted by statutory regulation or exceeds the permitted use, you will need to obtain permission directly from the copyright holder. To view a copy of this license, visit http://creativecommons.org/licenses/by/4.0/.
© The Author(s) 2019