Research Express@NCKU - Articles Digest
Research Express@NCKU Volume 10 Issue 5 - September 4, 2009 [ http://research.ncku.edu.tw/re/articles/e/20090904/3.html ]
Optimization of Engineering Tolerance Design using Revised Loss Functions
Jeh-Nan Pan
1,*and Jianbiao Pan
21Department of Statistics, National Cheng-Kung University
2Department of Industrial and Manufacturing Engineering, California Polytechnic State University
Engineering Optimization, 41 (2), pp. 99-118, February 2009
E
ngineering tolerance design plays an important role in modern manufacturing. Both symmetric and asymmetric tolerances are common in many manufacturing processes.Recently, various revised loss functions have been proposed to overcome the drawbacks of the Taguchi’s loss function. In this paper, the Kapur’s economic tolerance design model is modified and the economic specification limits for both symmetric and asymmetric losses are established. Three different loss functions: (1) Revised Taguchi’s quadratic loss function, (2) Inverted Normal Loss Function (INLF), and (3) Revised Inverted Normal Loss Function (RINLF, see Figure 1) are compared in the optimal symmetric and asymmetric tolerance design. The relationships among the three loss
functions and process capability indices are established. Considering that the quality losses above the upper or lower specification limit may not be equal, we revise Kapur’s economic tolerance design model, TC=LQ*+(1−q)×SC+IC, asTC=L*+q1×SC+q2×RC+IC, where TC is the total expected losses per unit product, SC is the scrap cost per unit, RC is the rework cost per unit, IC is the inspection cost per unit, LQ*is the expected loss per unit product shipped to the customer, L* is the expected loss per unit product shipped to the customer using the above-mentioned loss functions, q is the fraction of good products actually shipped to the customer, and q1and q2denote the probability of scrap or rework, respectively. Assuming the quality characteristics Y follows a normal distribution, i.e. Y~N(μ, σ2), the expected loss per unit product can be derived for the revised Taguchi’s quadratic, the INIF, and the RINLF loss functions. Then, the expected losses for the “nominal the best” case and “the smaller the better” case are estimated respectively. Furthermore, the relationships between process capability indices and expected loss per unit under normal distribution for symmetric and asymmetric tolerance on the “nominal the best” case are derived. The following numerical example is given to compare the
economic specification limits established by using the three loss functions.
Stencil printing is one of the most cost-effective processes for solder paste deposition and it has been widely used in traditional high-volume surface mount assembly. There are many variables that influence the quality of the stencil printing process, which are mainly measured by the amount and position of solder paste deposited. Instead of using the traditional way of setting the tolerance by T±5σ in most electronic industries, the new economic specification limits are established based on the revised Kapur’s
1 of 4
Research Express@NCKU - Articles Digest
economic tolerance design model to minimize the product variation/loss shipped to the customer. To demonstrate how to determine the new economic specification limits using RINLF, we use the solder volume on QFP (Quad Flat Package) pads deposited by a stencil of a thickness of 0.15 mm and aperture sizes of 0.5mm. The procedures of the new economic tolerance design are as follows:
Economic tolerance design for the solder deposited volume of QFP pads
Step 1. Perform statistical test
The solder deposited volume data on 264 pads data were from the experimental data (Pan, et al., 2004).
The data passed the normality test. The normal probability density function of the solder volume is shown in Figure 1, where the mean μ=0.0507 mm3 and the standard deviation σ=0.005 mm3. Step 2. Determine RINLF for the solder deposited volume
The target of solder deposited volume T=0.059 mm3. Assume the maximum quality loss per unit, K1= K2=$50 (i.e. symmetric loss function) if the solder deposited volume is deviated from the target and exceeds the specification limits. Since solder paste applied to the board is washable and the board itself is reusable even if its deposited volume is out of the specification limits. Therefore, the scrap cost is not considered in the solder paste stencil printing process. Assume the rework cost RC = $20 per unit if the solder deposited volume exceeds the specification limits and the inspection cost IC = $5 per unit if 100﹪
inspection is conducted. Suppose that we let the RINLF reach its maximum loss at T±5σ limits, where T
−5σ=0.059−5×0.005=0.034 and T+5σ=0.059+5×0.005=0.084, no quality loss will be incurred if the solder deposited volume falls in the acceptable range (L,U)=(0.0465, 0.0715), where L=0.059−
0.0125=0.0465 and U=0.059+0.0125=0.0715. Note that the parameters for controlling the shape of RINLF are: σL1=(0.0465−0.034)/4=0.0031 andσL2 =(0.084−0.0715)/4=0.0031.
Step 3. Determine the economic specification limits for the solder deposited volume
Based on the revised Kapur’s economic tolerance design model, we plug the parameter settings of RINLF from step 2 into TC=L*+q1×SC+q2×RC+IC. Due to the fact that the board can be reworked if it exceeds specification limits, the total unit cost can be written as: TC=L*RINLF +(1−q)×RC+IC Moreover, the total unit cost TC is the function of η1 andη2, the mathematical equation for determining the new economic specification limits can be written as:
Min{η1,η2:TC(η1,η2)=L*RINLF+(1-q)×SC+IC
One can solve the above equation using R computer program (referred to Pan, 2009) and achieve the optimal solutionη1=1.4653, η2=4.7846 and Min{TC(η1,η2)}=7.2421= 7.2421. After plugging the optimal solution η1 and η2 into the formula (LSL,USL)=(μ-η1σ, μ+η2σ), then the new economic lower
specification limit,
LSL= μ - η1σ = 0.0507-1.4653×0.005= 0.0434
2 of 4
Research Express@NCKU - Articles Digest
and the new upper specification limit,
USL=μ +η1σ=0.0507+4.7846×0.005=0.0746 , where the range of η1 and η2 are:
The new economic specification limits (LSL,USL)、RINLF and the probability density function N (0.0507,0.0052) for the volume of QFP pads are shown in Figure 1.
Fig. 1 New (LSL, USL), RINLF and the probability density function N(0.0507,0.0052)
Notice that one can simply input the data into the R computer program to obtain new economic specification limits and minimum total costs using various loss functions even if the scrap cost and the rework cost are different for the case of asymmetric loss. Furthermore, we can apply similar procedures to obtain the economic specification limits for solder deposited volume of QFP using INLF and revised Taguchi’s loss functions. A comparison of the economic specification limits using RINLF, INLF and revised Taguchi’s loss functions as well as their respective total quality losses have been summarized in Table 1.
Table 1. Comparison of the economic tolerance design for solder deposited volume
3 of 4
Research Express@NCKU - Articles Digest
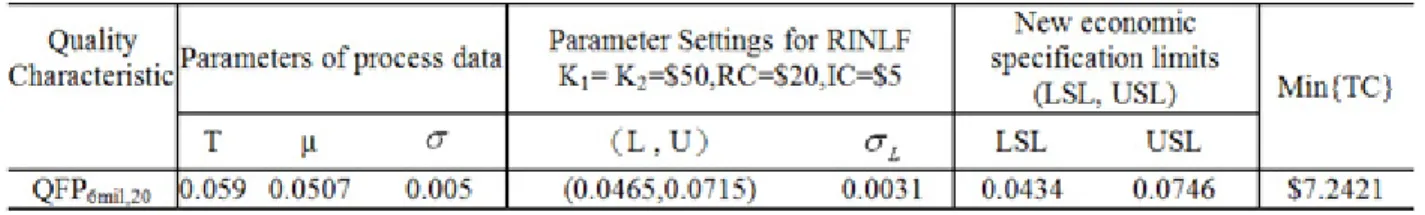
From Table 1, we know the economic specification limits for solder deposited volume of QFP using RINLF has the minimum total unit cost and the new specification limits (0.0434, 0.0746) is the most realistic one for monitoring the product quality of solder deposited volume. The basic statistics of process data, parameter settings for RINLF, the economic specification limits for the solder deposited volume are summarized in Table 2.
Table 2. The new economic tolerance design for solder deposited volume using RINLF
Conclusions
In this paper, we propose a new method for relaxing the limitation that the scrap cost and the rework cost are the same (the case of symmetric loss). Six models are derived for estimating the total expected loss in determining the economic specification limits. The six models include three models for bilateral specification (the “nominal the best” case) using the revised Taguchi’s quadratic loss function, the INLF, and the RINLF, and three models for the unilateral specifications (the “smaller the better” case) using the three loss functions. To decide which loss function is the best in the economic tolerance design, the relationships between process capability indices and expected loss per unit under normal distribution are derived. The results suggest RINLF be the most appropriate loss function in the economic tolerance design. One can easily extend it to the case of asymmetric loss (when the scarp cost is not equal to the rework cost) by simply changing the input parameters in the R program. Due to the fact that true loss structure might not be symmetric in many situations, the use of symmetric loss function in determining new economic specification limits is not recommendable always. Therefore, the asymmetric loss is considered in our models and it is suggested that RINLF be used in the optimal symmetric and asymmetric tolerance design.
(References can be referred to Pan, 2009)
4 of 4