of Sr
0.5Ba
0.5Ce
xNb
2O
6+␦Jyh-Tzong Shiue and Tsang-Tse Fang
Department of Materials Science and Engineering, National Cheng Kung University, Tainan 701, Taiwan
(Received 26 March 2003; accepted 30 July 2003)
The solid-state reaction of SrNb2O6, BaNb2O6, and CeO2to form
Sr0.5Ba0.5CexNb2O6+␦at different temperatures and heating rates was investigated. A nonisothermal kinetic empirical model was used to evaluate the activation energy and rate constant of Sr0.5Ba0.5CexNb2O6+␦. The values of the activation energy evaluated from the slopes are 762, 800, and 844 kJ/mol, respectively, for S50, 1CeS50, and 2CeS50, which increase with the increase in Ce doping. The order of reaction was found to decrease with the increase of the Ce doping. A kinetic equation was developed based on the parameters evaluated from the nonisothermal reaction model, which was successfully used to predict the isothermal reaction of Ce-doped strontium barium niobate.
I. INTRODUCTION
Strontium barium niobate, SrxBa1-xNb2O6 (SBN) (0.25 艋 x 艋 0.75), possesses excellent pyroelectric1–3 and linear electro-optic coefficients,4,5and a strong pho-torefractive effect,6,7so it has been of interest for many optical applications (e.g., volume holographic storage,8 self-pumped phase conjugation,9photoassisted switching of ferroelectric domains,10 and fast recording with en-hanced sensitivity at high light intensities11). Although SBN single crystals can be used in large number appli-cations, high cost and difficult fabrication have limited its practical use. SBN ceramic having the advantages of low cost, easy fabrication, and large size would be prom-ising in those applications. For optical applications,12
a ceramic with almost full density and uniform microstruc-ture is greatly desired.13–15
Lee et al.16
used reaction sintering to obtain translucent SBN ceramics with a uni-form microstructure and a high density. For solid-state reaction sintering, the kinetics of the system must be understood. The formation mechanism of SBN has been proposed by Fang et al.,17 in which the intermediate phases Ba5Nb4O15, Sr5Nb4O15, BaNb2O6 (BN), and SrNb2O6(SN) develop and the latter two phases react to form SBN. Moreover, the reaction kinetics of the forma-tion of SBN has been detailed.18A nonisothermal kinetic empirical model was developed that successfully pre-dicted the reaction kinetics, and the activation energy and rate constant of SBN with different Sr:Ba ratios could be evaluated.18 It is well known that dopants distort the lattice and influence the diffusivity of spe-cies under consideration. For solid-state sintering, the impurity effect on the sintering behavior is significant
and was intensively studied. By the same token, it is also important to realize the impurity effect on reac-tion kinetics during reacreac-tion sintering. The nonisother-mal kinetic empirical model18
would be used to study the effect of Ce doping on reaction kinetics for the for-mation of Sr0.5Ba0.5CexNb2O6+␦. Therefore, the pur-poses of this investigation are not only to reassess the validity of this nonisothermal model but also to obtain the reaction factors, which would affect the reaction sintering.
II. EXPERIMENTAL A. Sample preparation
High-purity powders of BaCO3 (99.99%), SrCO3 (99.995%) (Aldrich-APL, Milwaukee, WI), and Nb2O5 (99.998%) (CERAC, Milwaukee, WI), with ap-propriate molar ratios, were wet-mixed with ethyl alco-hol for 24 h and then calcined at 950 °C for 2 h to form BN and SN, respectively. Sr0.5Ba0.5CexNb2O6+␦(x⳱ 0, 0.01, and 0.02, abbreviated as S50, 1CeS50, and 2CeS50, respectively) was prepared by wet-mixing BN, SN, and CeO2in an appropriate molar ratio with ethyl alcohol for 24 h. The mixtures were microwave dried to reduce the segregation, and then lightly ground by a mortar and pestle. The reaction pellets were prepared by pressing the mixtures in a die at a pressure of 100 MPa. Each pellet was heated to a desired temperature at different heating rates (2, 5, 10, 15, and 20 °C /min), and then quenched in air. The particle size distributions of the precursor pow-ders were determined by the sedimentation method
(SediGraph 5100, Micrometrics Instrument Group, Nor-cross, GA). The average particle sizes of both SN and BN were 0.6m.
B. X-ray analysis
X-ray diffractometry (D/Max III.V, Rigaku, Tokyo, Japan) was performed on samples that had been heated to various temperatures at different heating rates. The samples were ground for analysis, and MgO was used as an internal standard to determine the amount of Sr0.5Ba0.5CexNb2O6+␦. The scanning rate was set to 1° 2/min over a range of 25°–45°, which contains the strongest diffraction-line intensities of Sr0.5Ba0.5CexNb2O6+␦ and MgO. These peaks were selected to measure the ex-tent of the reacted Sr0.5Ba0.5CexNb2O6+␦, and the counts that were collected for the peaks were fitted and inte-grated to extract the peak area.
III. RESULTS
A. Formation of Sr0.5Ba0.5CexNb2O6+␦at
different temperatures
Quantitative x-ray diffraction (XRD) was used to determine the extent of reaction as a function of tempera-ture. The calibration curve can be prepared from meas-urements on a set of synthetic samples, containing known concentrations of Sr0.5Ba0.5CexNb2O6+␦ and a con-stant concentration of a standard (MgO). Once the cali-bration curve is established, the extent of reaction in a reacted sample is obtained by the ratio of the area (inte-grated intensities) of the major peak of MgO to the area of the major peak of the product of Sr0.5Ba0.5CexNb2O6+␦ for a composite sample containing the unknown and the same proportion of standard as is used in the calibration.19
Figure 1 shows the formation fraction of S50 at dif-ferent temperatures for heating rates of 2, 10, and 20 °C/ min. As observed, the faster the heating rate, the higher the temperature required to attain the same fraction of formation (␣) of S50. For the samples that have been heated at different heating rates (i.e., 2, 10, and 20 °C/ min), the detectable reactions (∼0.15) begin at about 1000, 1025, and 1050 °C, respectively, and the fully reacted temperatures occurred at 1185, 1215, and 1230 °C, respectively. The fractions of formation of 1CeS50 and 2CeS50 at different temperatures for different heating rates are shown in Figs. 2 and 3, respectively. The reac-tion curves of 1CeS50 and 2CeS50 are similar to those of S50; however, their reaction onset temperatures are in-creased to 1060 and 1080 °C, respectively, and the fully formed temperatures are increased to 1220 and 1240 °C, respectively. Based on the above results, the amount of Sr0.5Ba0.5CexNb2O6+␦ that is formed decreases as the heating rate and Ce doping increase.
FIG. 1. Formation of S50 at different temperatures using different heating rates.
FIG. 2. Formation of 1CeS50 at different temperatures using different heating rates.
B. Nonisothermal kinetic analysis for the formation of Sr0.5Ba0.5CexNb2O6+␦
The procedure20for the analysis of the nonisothermal reaction kinetics was modified to evaluate the activation energy of the formation of Sr0.5Ba0.5CexNb2O6+␦. The time rate of conversion(d␣/dt) is given as
d␣
dt = kf共␣兲 , (1)
where k is a rate constant (k = Aexp(− Q/RT)) and f(␣) may be dependent on the particle size. For the noniso-thermal reaction kinetics with a constant heating rate ( ⳱ dT/dt), Eq. (1) can be written as
ln
冋
冉
d␣dT
冊
册
= ln关Af共␣兲兴 +冉
− QRT
冊
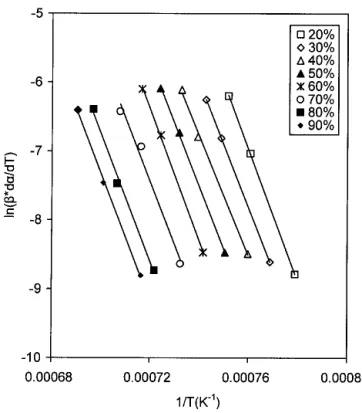
, (2)where A is a frequency factor, Q the activation energy for the reaction, R the gas constant, and T the absolute tem-perature. At a given␣ value, the activation energy can be evaluated by plotting ln[(d␣/dT)] versus 1/T at at dif-ferent heating rates. Based on Eq. (2), the values of the activation energy can be evaluated from the slopes of Figs. 4–6, and the values obtained are 762, 800, and 844 kJ/mol for S50, 1CeS50, and 2CeS50, respectively. Moreover, as observed in these figures, the lines for S50, 1CeS50, and 2CeS50 are parallel, which implies that this
empirical model is a valid description of the nonisother-mal reaction kinetics, and only one mechanism domi-nates over the range of 0.2艋 ␣.艋 0.9.
FIG. 3. Formation of 2CeS50 at different temperatures using different heating rates.
FIG. 4. Plot of ln[(d␣/dT)] versus (1/T) for S50 at different heating rates for a constant reaction fraction.
FIG. 5. Plot of ln[(d␣/dT)] versus (1/T) for 1CeS50 at different heating rates for a constant reaction fraction.
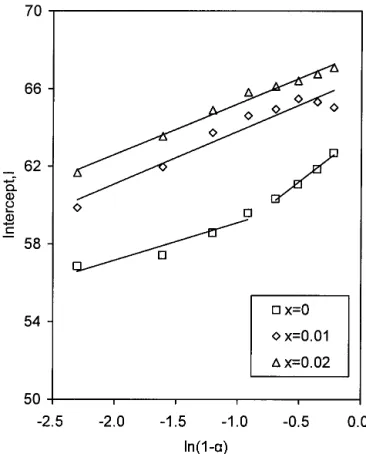
It is further assumed that f(␣) is a function of (1–␣)n
, where n is the order of the reaction of Sr0.5Ba0.5CexNb2O6+␦. If so, the intercept I⳱ 1n[Af(␣)] of Eq. (2) can be re-written as
I= ln关A共1 − ␣兲n兴 = ln A + n ln共1 − ␣兲 . (3)
Thus, if we plot I versus 1n(1–␣), we will obtain a straight line, the slope of which is n and whose intercept is ln A. As observed in Fig. 7, for undoped SBN, there are two linear regions, which is consistent with previous work,17but there is only one linear region for Ce-doped SBN. The values of n and A of each sample are summa-rized in Table I.
IV. DISCUSSION
In solid-state reactions, the reactants are not mixed on an atomic level and, therefore, must diffuse or penetrate into each other if the reaction is to start and propagate within the solid phase. Thus, the space coordinate has a significant role during the reaction. There are two fun-damental processes that are involved in a solid-state re-action: (i) the chemical reaction itself; and (ii) the transport of matter to the reaction zone. Lee et al.17 sug-gested that the surface of each particle of BN or SN would be uniformly distributed by ions from their origi-nal composition through surface diffusion before form-ing a product layer. They observed that the activation energy of the reaction increases as the Sr:Ba ratio in-creases, and they suggested that the system may be dif-fusion controlled and that the activation energy of the
reaction may reveal the activation energy of the interdif-fusivity of strontium and barium. The increase of the activation energy may also be influenced by the struc-tural change for different ratios of SBN.
SBN (0.25 艋 x 艋 0.75) has the structure of tetra-gonal tungsten bronze with a unit cell formula of [(A1)2(A2)4C4][(B1)2(B2)8]O30. This structure consists of a framework of NbO6octahedra that share corners in such a way that there are three different types of inter-stitial sites, two of which (A1and A2) may be occupied by the Ba/Sr ions. The distorted tetragonal A1 sites are occupied only by strontium ions, whereas the distorted pentagonal A2 sites are occupied by barium and stron-tium ions in a random manner. In Ce3+-doped SBN, Giles
et al.21 suggested that Ce3+ions are located in a high-symmetry environment, such as a Sr or Ba site with no neighboring vacancies, based on the observation of electron paramagnetic-resonance data. Because the ionic
TABLE I. Values of n and A from Eq. (3) and Q from Eq. (2) for undoped and Ce-doped SBN.
Sample n A Q (kJ/mole)
S50 2.85 1.51 × 1027 762
1CeS50 2.73 7.87 × 1028 800
2CeS50 2.62 2.92 × 1029 844
FIG. 6. Plot of ln[(d␣/dT)] versus (1/T) for 2CeS50 at different heating rates for a constant reaction fraction.
FIG. 7. Plots of the intercept I versus ln(1 −␣) of Sr0.5Ba0.5CexNb2O6+␦, one for x⳱ 0 showing two linear regions, and another for x ⳱ 0.01 and 0.02 showing one linear region.
radii of Ce3+ are much smaller than those of Sr2+ and Ba2+, the lattice will be distorted more as the fraction of the cerium ion increases. Moreover, in recent works22,23
the compensated defect of Ce doping would be the excessive oxygen in the O(4) and O(5) sites. If so, the interdiffusivity of Ba and Sr would be significantly influenced. Based on the aforementioned discussion, the activation energy of the reaction will increase as the amount of Ce doping increases, a concept supported by the evaluation of the data of Figs. 4–6. Regarding the order of reaction, n, although its physical meaning is ambiguous, it depends mainly on the extent of the reac-tion and the temperature. In the previous work,18the two linear regions of the plots of I versus 1n(1–␣) essentially became a linear region when the formation temperature was increased. This implies that the temperature would dominate in the process. In this investigation, this trend becomes apparent. For Ce-doped SBN, only one linear region was observed due to the fact that the formation temperature increased (Fig. 7). For comparison between Ce-doped and undoped SBN, the value of n for undoped SBN was evaluated based on one linear region overall. The evaluated n for S50, 1CeS50, and 2CeS50 are 2.85, 2.73, and 2.62, respectively. The value of n decreases with increased Ce doping. Based on the evaluated values
n, A, and Q, we could further develop a kinetic equation
to predict the isothermal reaction behavior. However, the reaction has to some extent taken place before reaching the isothermal temperature even if the fastest heating rate
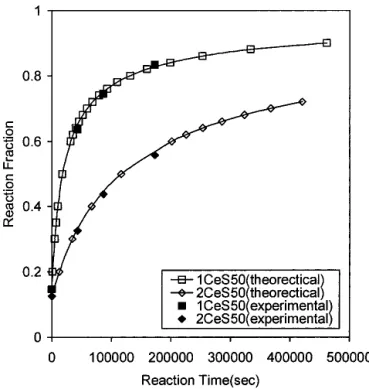
(20 °C /min) were used, and therefore this reacted frac-tion (␣1) needs to be determined. For the isothermal tem-perature at 1000 °C , these values for␣1 at t ⳱ 0 are 0.147 and 0.125 for 1CeS50 and 2CeS50, respectively. By integrating Eq. (1) and rearranging, we obtain
t = 关共1 − ␣2兲 1−n− 共1 − ␣ 1兲 1−n兴exp
冉
Q RT冊
A共n − 1兲 , (4)where Q, A, and n are evaluated from the nonisothermal reaction kinetics shown in Table I, and␣2is the fraction of reaction at time t. Figure 8 shows the comparison of the theoretical reaction fraction evaluated from Eq. (4), and the experimental reaction fractions of 1CeS50 and 2CeS50 isothermally heated at 1000 °C for different re-action times using a heating rate of 20 °C/min to reach the desired temperature. As observed, those values are in excellent agreement, which further justifies the validity of this model.
V. CONCLUSIONS
(1) The amount of Sr0.5Ba0.5CexNb2O6+␦ that is formed decreases as the heating rate and Ce doping in-crease.
(2) The order of reaction, n, decreases with the in-crease of the Ce doping.
(3) The activation energy increases with the increase in Ce doping, which could be attributed to the lattice distortion and change of the interdiffusivity of Sr and Ba by the Ce doping.
(4) The model proposed in this investigation is jus-tified to be valid in predicting the nonisothermal and isothermal reaction behaviors of undoped and Ce-doped SBN.
ACKNOWLEDGMENT
The authors appreciate the financial support of the National Science Council of Taiwan under Contract No. NSC 89-2216-E-006-031.
REFERENCES
1. P.B. Jamieson, S.C. Abrahams, and J.L. Bernstein, J. Chem. Phys. 48,5048 (1968).
2. E.L. Venturini, E.G. Spencer, P.V. Lenzo, and A.A. Ballman, J. Appl. Phys. 39, 343 (1968).
3. A.M. Glass, J. Appl. Phys. 40, 4699 (1969).
4. P.V. Lenzo, E.G. Spencer, and A.A. Ballman, Appl. Phys. Lett. 11,23 (1967).
5. C.R. Giuliano, Phys. Today 34, 27 (1981). 6. J. Feinberg, Phys. Today 41, 46 (1988).
7. M.D. Ewbank, R.R. Neugaonkar, W.K. Cory, and J. Feinberg, J. Appl. Phys. 62, 374 (1987).
8. T. Parish, BYTE 15, 283 (1990). FIG. 8. The comparison of the theoretical reaction fraction evaluated
from Eq. (4) and the experimental reaction fraction of 1CeS50 and 2CeS50 holding at 1000 °C for various times using a heating rate of 20 °C/min.
9. N.V. Bogodaev, V.V. Eliseev, L.I. Ivleva, A.S. Korshunov, S.S. Orlov, N.M. Polozkov, and A.A. Zozulya, J. Opt. Soc. Am. B 9,1493 (1992).
10. F. Kahmann, R. Pankrath, and R.A. Rupp, Opt. Commun. 107, 6 (1994).
11. K. Buse, R. Pankrath, and E. Kratzig, Opt. Lett. 19, 260 (1994). 12. K. Megumi, H. Kozuka, M. Kobayashi, and Y. Furuhata, Appl.
Phys. Lett. 30, 631 (1977).
13. K. Nagata, Y. Yamamoto, H. Igarashi, and K. Okazaki, Ferroelec-trics 38, 853 (1981).
14. S.I. Lee and W.K. Choo, Ferroelectrics 87, 209 (1988). 15. N.S. VanDamme, A.E. Sutherland, L. Jones, K. Bridger, and
S.R. Winzer, J. Am. Ceram. Soc. 74, 1785 (1991).
16. Wen-Jiung Lee and Tsang-Tse Fang, J. Am. Ceram. Soc. 81, 1019 (1998).
17. T-T. Fang, N-T. Wu, and F-S. Shiau, J. Mater. Sci. Lett. 13, 1746 (1994).
18. W-J. Lee and T-T. Fang, J. Am. Ceram. Soc. 81, 193 (1998). 19. B.D. Cullity, Elements of X-ray Diffraction, 2nd ed.
(Addison-Wesley Publishing Company, Inc, Reading, MA, 1978), pp. 415, 417.
20. B. Carrol and E.P. Manche, Thermochim. Acta 3, 449 (1972). 21. N.C. Giles, J.L. Wolford, G.J. Edwards, and R. Uhrin, J. Appl.
Phys. 77, 976 (1995).
22. J-T. Shiue and T-T. Fang, J. Eur. Ceram. Soc. 22, 1705 (2002). 23. J-T. Shiue and T-T. Fang, manuscript accepted by J. Am. Ceram.