行政院國家科學委員會專題研究計畫 期中進度報告
C 型肝炎病毒-脂質顆粒的蛋白質體與感染性特定分析(1/3)
計畫類別: 個別型計畫 計畫編號: NSC94-2320-B-006-068- 執行期間: 94 年 08 月 01 日至 95 年 07 月 31 日 執行單位: 國立成功大學醫學檢驗生物技術學系 計畫主持人: 楊孔嘉 共同主持人: 張定宗 計畫參與人員: 孫宏羽 陳雅婷 謝志遠 蔡怡儂 報告類型: 精簡報告 處理方式: 本計畫可公開查詢中 華 民 國 95 年 5 月 29 日
行政院國家科學委員會補助專題研究計畫
▓ 期 中 進度報告計畫名稱:
C 型肝炎病毒-脂質顆粒的蛋白質體與感染性特定分析(1/3)
計畫類別:▓個別型計畫
計畫編號:NSC
94
-
2320
-
B
-
006
-
068
-
執行期間:94 年 8 月 1 日至 95 年 7 月 31 日
計畫主持人:
楊孔嘉
共同主持人:張定宗
計畫參與人員: 孫宏羽 陳雅婷 謝志遠 蔡怡儂
成果報告類型(依經費核定清單規定繳交):▓精簡報告
本成果報告包括以下應繳交之附件:
□赴國外出差或研習心得報告一份
□赴大陸地區出差或研習心得報告一份
□出席國際學術會議心得報告及發表之論文各一份
□國際合作研究計畫國外研究報告書一份
處理方式:除產學合作研究計畫、提升產業技術及人才培育研究計畫、
列管計畫及下列情形者外,得立即公開查詢
□涉及專利或其他智慧財產權,□一年□二年後可公開查詢
執行單位:
國立成功大學醫學檢驗生物技術學系
中
華
民
國
95
年
5
月
25
日
中文摘要: C 型肝炎病毒已被證實會與血漿中的低密度脂蛋白形成複合物,然而有關此 種由C 型肝炎病毒及低密度脂蛋白所形成的複合物的特性仍然還是未知。因此本篇研 究即是去探討與C 型肝炎及 B 型肝炎感染相關的極低密度脂蛋白/低密度脂蛋白 (VLDL/LDL)之特性。本實驗收集了三組病人,包括 C 型肝炎病患,B 型肝炎病患以 及正常對照組,每組的病人數均為20 人。藉由氯化鈉調整病人血漿的密度後,利用超 高速梯度離心方式將極低密度脂蛋白/低密度脂蛋白顆粒(密度<1.063 g/cm3)分離出來。 我們利用生化分析以及即時定量系統(real-time PCR),將極低密度脂蛋白/低密度脂蛋 白顆粒中所含的脂質,蛋白質以及B 型肝炎 DNA 或是 C 型肝炎 RNA 進行定量;此外,
更進一步利用二維電泳系統及影像分析軟體(Image Master Software)將極低密度脂蛋白/ 低密度脂蛋白顆粒中所含有的蛋白質組成做更細部的分析,並藉由與正常對照組進行比 較,找出有表現差異的蛋白質點;這些蛋白質點經過回收後,再利用基質輔助雷射脫附 游離法飛行時間質譜技術(MALDI-TOF)進行蛋白質身分鑑定。結果發現三組病人的血 漿中所含有的三酸甘油脂,低密度脂蛋白以及蛋白質總量在統計上並沒有顯著差異;來 自C 型肝炎病患的極低密度脂蛋白/低密度脂蛋白顆粒中所含有的病毒量比例明顯的高 於來自B 型患者的極低密度脂蛋白/低密度脂蛋白顆粒中所含有的病毒量比例(15.87 ± 4.9% vs. 0.03 ± 0.03 % of origin plasma, p < 0.001 )。此外,極低密度脂蛋白/低密度脂蛋 白顆粒中的C 型肝炎病毒 RNA 可以受到脂蛋白顆粒中的脂質成份的保護。蛋白質體學 的結果經過分析後,找到13 個表現量有差的異蛋白質點,這些蛋白質點經由蛋白質身
分鑑定後進一步被歸類成與B 型肝炎相關: apolipoprotein CIII (兩種 isoforms)及 apolipoprotein AI (兩種 isoforms);與 C 型肝炎病毒相關: Vitamin D binding protein precursor (DBP), Prenylcysteine lyase, apolipoprotein LI and apolipoprotein M;以及 B/C 型 肝炎病毒相關: apolipoprotein AI (六種 isoforms)等三種模式。從本篇的研究中,我們將 來自C 型肝炎病患及 B 型肝炎病患極低密度脂蛋白/低密度脂蛋白顆粒進行分析,並找 出這些極低密度脂蛋白/低密度脂蛋白顆粒的生物及蛋白質特性。從結果中推測在 C 型 肝炎病患血液中大部分病毒可能會藉由與極低密度脂蛋白/低密度脂蛋白顆粒結合的方 式在血液中運行;此外,感染肝炎病毒也可能會改變極低密度脂蛋白/低密度脂蛋白顆 粒的蛋白質組成。
英文摘要: Circulating hepatitis C virus (HCV) has been demonstrated to form complexes with low-density components in plasma, the nature of which was unknown. In this study, we characterized the properties of very low-density/low-density lipoprotein (VLDL/LDL) particles associated with hepatitis B virus (HBV) and HCV infections. Twenty donors were recruited in each of the 3 groups, including HBV-positive, HCV-positive and control. The VLDL/LDL particles (<1.063 g/cm3) were isolated from plasma samples of blood donors by NaCl density gradient ultracentrifugation. We determined the lipid and protein components in the VLDL/LDL fraction by biochemical analysis as well as the quantities of HBV-DNA and HCV-RNA by real-time PCR assay. Furthermore, the proteins in the VLDL/LDL fraction were separated by 2-dimensional gel electrophoresis and the differential protein profiles were
analyzed by Image Master Software. As compared to those in the control group, the
differential protein spots in HBV-positive and HCV-positive VLDL/LDLs were determined, recovered and subjected to protein identification with peptide mass fingerprinting by matrix assisted laser desorption/ionization-time of flight-mass spectrometry (MALDI-TOF). The levels of triglyceride, LDL and total protein of plasma samples were comparable between the 3 groups. The VLDL/LDL fraction from the HCV-positive group contained higher
proportions of viral genome than those from the HBV-positive group (15.87 ± 4.9 % vs. 0.03 ± 0.03 % of origin plasma, p < 0.001 ). In additional, the HCV RNA genome in this isolated fraction was protected by detergent-sensitive lipid compartment. The proteomic study displayed thirteen protein spots with significantly differential expression levels as classified into HBV-associated, HCV-associated and HBV/HCV-associated patterns. Identified proteins with MALDI-TOF were: apolipoprotein CIII (two isoforms) and apolipoprotein AI (two isoforms) in the HBV-associated pattern; apolipoprotein E, Vitamin D binding protein precursor (DBP), Prenylcysteine lyase, apolipoprotein LI and apolipoprotein M in the HCV-associated pattern; and apolipoprotein AI (six isoforms) in the HBV/HCV pattern. In conclusion, these findings define the biological and proteomic nature of the VLDL/LDL from patients with HBV and HCV infections. The results suggest that a substantial amount of circulating HCV genome is associated with the VLDL/LDL particles and infections with the hepatitis viruses could alter the protein profile in VLDL/LDL.
關鍵字: C 型肝炎病毒 低密度脂蛋白 質譜 蛋白質身分鑑定
前言: Chronic hepatitis C virus (HCV) and hepatitis B virus (HBV) infections, affecting respectively 170 and 350 millions people worldwide, represents the two major causes of life-threatening liver disease, such as cirrhosis and hepatoma1,2. HBV infection in population has been controlled by vaccine since 2 decades ago, leading to a decline of HBV prevalence rate and HBV-related hepatoma in young generation3,4. However, the mechanisms of HCV entry and then leading to a persistent viral infection in host cells were poorly understood because the lack of an efficient experimental HCV cultivated system5,6. The drawbacks of HCV studies led HCV infection progressively became the major causative liver disease.
Putative HCV particles from serum showed a significant heterogeneity with respect to buoyant density and sedimentation7,8. This variety might be due to the binding of viral particles to antibodies, low density lipoprotein (LDL), very low density lipoprotein (VLDL), or high density lipoprotein (HDL), or to the existence of defective particles or to a combination of these8-12. Moreover, titration of infectivity in chimpanzees revealed a relationship between the density of particles and infectivity; the highest infectivity of plasma was associated with the majority of HCV RNA being found in the low-density fraction (density of <1.06 g/ml), while HCV RNA found in higher-density fractions seemed to be
poorly infectious11,13.
Human lipoprotein was formed in the hepatocyte when triglyceride (TG) was transported into ER lumen where TG interacted with the microsomal TG transfer protein (MTP) and the apolipoprotein B (Apo B) was synthesized by ribosome on the ER membrane, simultaneously14. The protein disulfide isomerase (PDI)15and MTP fabricated the Apo B and TG to the lipoprotein vesicle, respectively. The newly synthesis lipoprotein was denominated as VLDL (density < 1.0063 g/ml) because of rich of TG and was exported to hepatocyte be exocytosis. The TG of VLDL would be consumed progressively in the process of transportation by blood stream and became LDL (density between 1.025 and 1.055 g/ml). The peripheral cells took up the LDL by the interaction of Apo B and LDL receptor located on the cell membrane16,17.
There were several observations, which pointed out the potential importance of lipid metabolism and HCV infection. Circulating serum HCV particles showed heterogeneous density, which reflected in part the binding of a fraction of the virions to VLDL and LDL7. A further important hallmark of chronic HCV, and not HBV, infection was its association to steatosis in at least 50 % of infected subjects. Moreover, the LDL receptor had been proposed as one of the potential viral receptors18. It had been reported that HCV core protein was present on the surface of lipid droplets and might alter lipid metabolism in vitro interacting with cellular proteins involved in lipid accumulation and storage in liver cells19. It was not clear about the mechanism of HCV infection and the persistent infection caused by HCV. The accumulated data suggested that lipoproteins might mimic as ligands binding to host surface receptor for HCV entry by endocytosis18,20,21. It had been documented that purified lipo-viro-particle (LVP) isolation from LDL contained apolipoprotein B, HCV RNA, and core protein; and appeared as large spherical particles with a diameter of more than 100 nm22. However, it is not known whether HCV simply binds to circulating lipoproteins or whether an interaction occurs during lipoprotein synthesis by infected hepatocytes to form a hybrid virus-like particle.
Circulating HCV has been demonstrated to form complexes with LDL, the nature of which were unknown. To critically examine the properties of LDL associated with virus infection, we characterized the human LDL particles from healthy donors and those infected with HBV and HCV with biochemical and proteomic approaches.
研究方法:
Plasma and serum samples
Study materials were obtained from the hepatitis clinics at the department of Internal Medicine, NCKUH and the Chinese Blood Services Foundation, Tainan, ROC. Samples were divided into three types by serological markers of hepatitis virus; a HBsAg-positive and
anti-HCV-negative (HBV-infected samples), an anti- HCV-positive and HBsAg-negative (HCV-infected samples), and a HBsAg-negative and anti-HCV-negative (normal control). Twenty donors were recruited in each of the 3 groups. Moreover, the samples with viral infection were further confirmed by detection of HCV RNA or HBV DNA by PCR. The plasma samples were stored frozen at -80 ℃.
Preparation of low-density fractions
The separation of human low-density lipoprotein was performed as described in detail previously23. Blood samples from infected patients or from blood donors were separated by sequential ultracentrifugation to obtain low-density fractions whose densities corresponded to those of VLDL and LDL. Before ultracentrifugation, the Na2EDTA and NaN3 solution
should be added such that the final concentration was 0.04% and 0.05%, respectively. EDTA was required to chelate contaminating heavy metal ions which catalyze lipid peroxidation by molecular oxygen. Plasma adjusted to a density of 1.063 g/mL with 25 % NaCl was layered in the bottom of a centrifuge tube (Beckman). Low-density fraction containing VLDL and LDL was collected after centrifugation at 90,000 rpm for 5 h at 4℃ in a Beckman TL100 ultracentrifuge equipped with a TLA 100.3 rotor (Beckman Instruments) (fig. 1A).
For two-dimensional electrophoresis, the low-density fraction containing VLDL/LDL was subjected delipidation and desalination. Delipidation was preformed by incubation of low-density fraction in an 85% ether-15% butanol solution (MERCK) for 30 min at room temperature with gentle rocking. Organic phases containing triglyceride and cholesterol were separated by centrifugation, and the aqueous phase was recovered. Desalination of low-density fraction was accomplished by microcon tube (Millipore) with 1X PBS solution. The protein concentration of samples was determined by protein assay kit (Bio-Rad). Proteins in low-density fraction were precipitated 11% TCA solution. Protein pellet was washed sequentially with 1ml acetone containing 20 mM DTT. The protein pellet was air dried and dissolved in IEF rehydration buffer for 2-DE analysis.
Electrophoretic separation of plasma lipoproteins in agarose gel
Electrophoretic separation of plasma lipoproteins in agarose gel was performed as described24. Briefly, 1 % agarose gel was made up with agarose powder and barbital buffer (pH 8.0) containing 50 mM sodium barbital (Sigma) and 10 mM barbitone (pH 8.6, Sigma). Low-density lipoprotein (10 g) was mixed with the same volume of 2x sample dye (100 mM Tris-HCl, 200 mM DTT, 4% SDS, 0.2 % bromophenol, and 20 % glycerol). Electrophoresis was performed at 110 voltages for 65 minutes. Then, the agarose gel was stained in coomassie blue solution containing 45 % methanol (MERCK), 10 % acetic acid (Sigma), and 0.1 % coomassie blue R-250 (Sigma) for 30 minutes. The stained agarose gel was washed with RO water and distained in the 45 % distain solution (45 % methanol and 10 % acetic acid) for 30 minutes. Next, the agarose gel was placed in 30 % distain solution (30 % methanol and 10 % acetic acid) for 4-6 hours to complete wash out the surplus coomassie
blue. The gel could be saved with RO water in 4 ℃. Biochemical analysis
The levels of LDL, triglyceride (TG) and cholesterol (Chol) were determined by Union Clinical Laboratory in Taipei, Taiwan, ROC.
Viral titer quantification
Total RNA was extracted from 50l of serum, 50 l of low-density fraction with a RNA isolation kit (Gentra); the RNA was eluted in 10lof DEPC water and stored at -80°C. HCV RNA was preheated with buffer containing 5 mM dNTP (Amersham), 5x RT buffer (Promega), 1% BSA (Sigma), ribonuclease inhibitor (TaKaRa), 20 m primers ( 8R: 5’ ACTCC ACCAT AGATC ACTCC 3’, 8L: 5’AACAC TACTC GGCTA GCAGT 3’) at 70℃ for 10 minutes and then kept on ice for 5 minutes. The reverse transcription was performed at 42 °C for 60 min by using M-MLV reverse transcriptase (Promega). Then, the mixture was placed at 95℃ for 10 minutes to inactivate the reverse transcriptase and kept on ice for 10 minutes to stop the reaction. HCV RNA quantitation was performed by real-time PCR of the 5’HCV noncoding region.Real-time PCR were carried out with 2 l of cDNA and primers
(NC1: 5’ CCCTGTGAGGAACTACTGTCTTCACGC 3’, KY81S: 5’
GGTGTACTCACCGGTTCCG 3’) by using LightCycler FastStart Reaction Mix hybridization Probes (HCV FL: 5’ GCAGCCTCCAGGACCCCCC 3’, HCV LC: 5’CCCGGGAGAGCCATAGTGGTCTG 3’) and a LightCycler apparatus (Roche). Total DNA of blood samples was extracted by using Blood & Tissue Genomic DNA Extraction Minipre system (Viogene). Real-time PCR were carried out with 2 l of HBV DNA and
primers (HBV F: 5’ GACCACCAAATGCCCCTAT 3’ and HBV R: 5’
CGAGATTGAGATCTTCTGCGAC 3’) by using LightCycler FastStart Reaction Mix hybridization Probes (HBV FL: 5’GASGCAGGTCCCCTAGAAGAAGAA X 3’and HBV LC: 5’TCCCTCGCCTCGCAGACGMAGRTCTC P 3’).
RNase sensitivity assay
The low-density fractions containing HCV RNA were subjected TX-100 (MERCK) and NP-40 (Sigma) treatment at 37℃ and 4℃ for 1 hour, respectively. Then, samples were incubated with 2 l of 20X-dilution RNase A at 37℃ for 0 minute, 5 minutes, 15 minutes, and 30 minutes. The control group was treated with RNase A (Gentra), but without detergent treatment. The titer of HCV RNA was quantified by real-time PCR.
Two dimension electrophoresis (2-DE)
The 2-DE was carried out according the protocol of Nation Cheng-Kung University Proteomics Research Core Laboratory. Briefly, the first dimensional separation of proteins was preformed using IEF (iso-electric focusing, Amersham) with 18 cm immobilized pH 3-10 gradient strip (IPG) strips. Samples containing 300 mg protein were dissolved in 350 ml rehydration buffer (7 M urea, 2 M thiourea, 2% w/v CHAPS, 20mM DTT, and 0.5% w/v IPG buffer). The samples were rehydrated at 30 voltages for 16 hours. The protein then focused at
34 kVh that linearly increased from 500 to 1000 voltages during 2 hours, followed by 4 additional hours at 8000 voltages. After IEF, the strips were equilibrated for 15 min in SDS equilibration buffer (6 M Urea, 0.2 % SDS, 50 mM Tris, pH 8.8, and 30 % Glycerol) containing 65 mM DTT and 135 mM iodoacetamide (Sigma), respectively. The second dimensional separation of proteins was accomplished by transferring the strips onto
SDS-PAGE gels (1.0 mm thick gradient 8–16% T) running at 10℃, at maximum 300 V for about 5 h.
Silver staining
Silver staining was performed according the protocol of Nation Cheng-Kung University Proteomics Research Core Laboratory. The gels were fixed in fixing solution (40% ethanol and 10% acetic acid) overnight, and sensitized the gels by incubation in sensitizing solution (30% ethanol, 6.8% sodium acetate and 0.312% sodium thiosulfate) for 30 min. The gels were washed three times in water for 5 min each and stained in staining solution (0.25% silver nitrate and 0.02% formaldehyde) for 30 min. Development was performed for 10 min in developing solution (2.5% w/v sodium carbonate and 0.01% w/v formaldehyde). The reaction was stopped by 5% acetic acid solution and the stained gels were washed three times in water for 5 min.
Gel imaging and analysis
After silver staining, gel was digitalized with scanner operated by the software LabScanV3.00 (Amersham Biosciences). The images were analyzed by the software ImageMaster 2D (V 2002.1, Amersham Biosciences). To accelerate the calculation rate of software, the image of gels was divided into three parts according to the molecular weight (75- 37 kDa, 37-25 kDa, and 25-10 kDa). The protein spots of three areas were initially detected, matched and then edited by software ImageMaster 2D. The volume of protein spots were processed by background subtraction and total spot volume normalization. The integrated spot intensity is denominated as spot volume percentage (%Vol). For each patient, the percentage of volume of the protein spots was compared between virus-infected and normal samples. Nonparametric independent t-test was performed separately on NBNC, HCV-infected, and HBV-infected groups, and protein spots satisfying P < 0.05 were selected. After the statistical analysis, MALDI-TOF mass spectrometric analysis was performed for all of the selected protein spots.
Trypstic in-gel digestion
The trypstic in-gel digestion was performed as described in detail previously25. Protein spots were excised manually from the gel and transferred into siliconized Eppendorf tubes (0.5 mL). The gel pieces were washed twice with 50% acetonitrile and 50% acetonitrile /25 mM ammonium bicarbonate. The gel pieces were shrunk and alkylated by incubation with 25 mM ammonium bicarbonate containing 10 mM DTT and 55 mM iodoacetamide for 45 min
at 56 ℃. In-gel digestion was performed by incubation of shrunk gel pieces with 0.1 mg/mL of modified trypsin (Promega, Madison, WI, USA) overnight at 37 .℃ The supernatant was recovered and the peptides further extracted from the gel piece by incubation in 50% acetonitrile /5% formic acid. Samples were dissolved in 20 L of 5% acetonitrile /0.1% formic acid for further MS analysis.
LC/MS
The protein spots with significant changes in expression level were identified by RP-nano-HPLC-ESI-MS/MS. The tryptic digested protein peptide were fractionated using a C18 microcapillary column (75 mm i.d. x 15 cm) at a flow rate of 200 nL/min with a nano-HPLC system (LC Packings, Netherlands) coupled to an ion trap mass spectrometer (LCQ DECA XP Plus, ThermoFinnigan, San Jose, CA) equipped with an ESI source. Buffer A (5% acetonitrile /0.1% formic acid) and buffer B (80% acetonitrile /0.1% formic acid) was used as elution solutions. Chromatographic elution was performed using a 40 min solvent gradient from 0 to 60% of buffer B. The peptides eluted from the microcapillary column were electrosprayed into the ESI-MS/MS with the application of a distal 1.3 kV spraying voltage. Each cycle of one full scan mass spectrum (m/z 150-2000) was followed by three data dependent MS/MS spectra.
Statistical analysis
All the results of biochemical tests of plasma, low-density lipoprotein, and protein
intensity were analyzed with the nonparametric independent t-test. The frequency of protein spots was examined by Pearson Chi-Square.
結果:
Isolation of VLDL/LDL from blood samples
In order to isolation of human lipoprotein, the density of human blood samples was adjusted by the 25% NaCl solution according to the formula described in material and method. Blood samples were ultracentrifuged at 90,000 rpm, 4 ℃ for 5 hours and subsequently fractionated from top to bottom according to various density. Aqueous fractions by each of 300 l were collected from top to bottom and yielded eight fractions. The fractions were applied to agarose electrophoresis to confirm the distributions of lipoproteins. The result indicated that the low-density lipoprotein (VLDL/LDL) and high-density lipoprotein (HDL) were concentrated in the 1stfraction and the 4th fraction, respectively (fig. 1A). To further confirm the results of lipoprotein electrophoresis, the original blood samples and the first three fractions from 3 HCV-infected patients and 2 normal controls were tested by TG, LDL, and HDL quantification (fig. 1B). The results showed that the TG and LDL were at higher concentrations in the first fraction (2.06 + 0.25 folds and 3.72 ± 0.47 folds, p < 0. 01) as compared to those in origin samples. On contrary, the HDL concentration was lower in the first fraction than in the pre-centrifuged samples. The results were also in
agreement the result of lipoprotein electrophoresis. The data indicated that low-density lipoprotein, with minimum of HDL contamination, could be collected in 1st fraction by the NaCl-adjusted gradient ultracentrifugation.
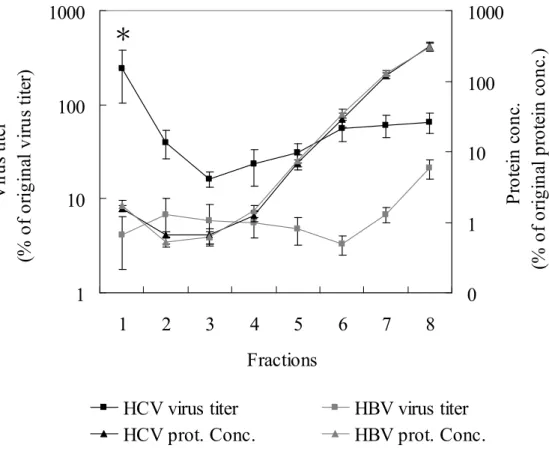
Furthermore, the distribution of viral genome and protein concentration of VLDL/LDL from viruses-infected patients was determined by real-time PCR and protein assay kit. The protein concentration of each fraction was identical between HCV and HBV-infected samples. Interesting, the highest viral titer of HCV-infected patients was appeared in the1st fraction corresponding VLDL/LDL fraction, but in the eighth fraction of HBV-infected patients (fig. 2).
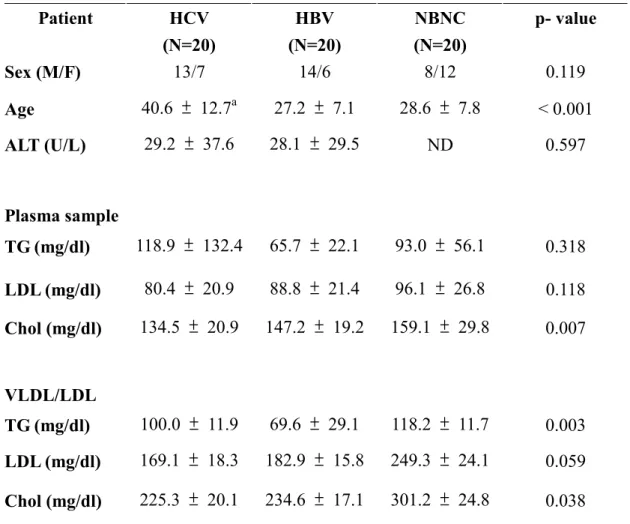
Characterization of VLDL/LDL isolated from patients with HCV or HBV infection Low-density fractions from sixty donors were collected and subjected quantification of TG, LDL, and cholesterol. The levels of TG (100.0 ± 11.9 , 69.60 ± 29.1 and 118.2 ±11.7 mg/dl in HCV, HBV and normal control, respectively) and cholesterol (225.3 ± 20.1, 234.60 ± 17.1 and 301.2 ± 24.8 mg/dl in HCV, HBV and normal control, respectively) of VLDL/LDL from patients with HCV or HBV infection were lower than those from normal control (table 1). Combined with other observations26-28, the results indicated that infection of HCV or HBV altered the lipid metabolism.
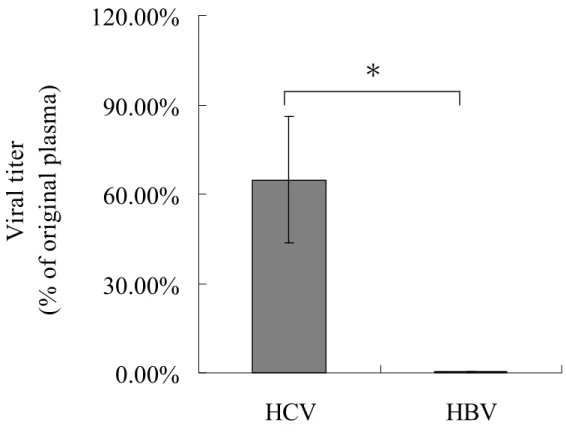
Moreover, the viral genome in low-density fraction and original blood samples were extracted and quantified by real-time PCR (fig. 3). The proportion of viral titer in low-density fraction from patients with HCV-induced hepatitis was significant higher than that from patients with HBV-induced hepatitis (64.80 ± 21.30 % vs. 0.30 ± 0.30 %, p < 0.001). The data also confirmed the result of the distribution of viral titer and protein concentration. The titer of HBV RNA and G6PDH RNA from blood samples was determined by real-time PCR to validate whether VLDL/LDL involves in RNA packaging. The results showed that neither HBV RNA nor G6PDH RNA could be detected in patients with HBV, HCV infection and normal control (data not shown). The data suggested detection of high concentration of HCV RNA in VLDL/LDL might be specific for HCV RNA.
The function of lipid compartment of VLDL/LDL containing HCV RNA was further investigated by RNase-sensitivity assay. The low-density fractions were removed by two kinds of detergents, triton X-100 (TX-100) and NP-40, which could disrupt the bipolar lipid membrane, and followed by RNase A treatment for a variety of interval (fig. 4). HCV RNA was extracted and quantified by real-time PCR. The viral titers in samples that treated with TX-100 (1.30 * 105 ± 8.56 * 104copies/ml) or NP-40 (3.94 * 105 ± 8.56 * 104copies/ml) were comparable to that in control sample without detergent pre-treatment (6.07 * 105 ± 4.38 * 105 copies/ml, p = 0.29 and 0.34, respectively). However, the detergent-treated samples displayed a decreasing of HCV-RNA titer by RNase A treatment in a time-dependent manner, with more than 2-order decline when treated of RNase A for 30 min. On contrary, the control samples showed no significant HCV-RNA change by RNase A treatment in the
parallel experiment. The result suggested the lipid compartment of VLDL/LDL might play an important role in protection and stabilization of HCV RNA.
Proteomic analysis of VLDL/LDL
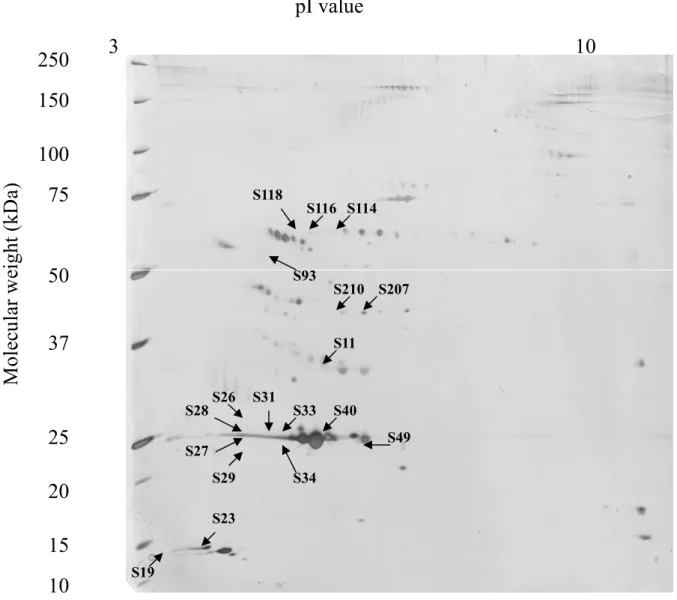
The two-dimensional gel in Fig. 5 shows a typical separation of total proteins from VLDL/LDL in NBNC-, HCV-, and HBV-infected patients into 200-250 spots. The protein spots with significantly differential expression levels were subjected with protein identification and were classified into HCV-associated, HBV-associated and hepatitis-associated patterns. The identified proteins were listed in Tables 2, and the positions of identified proteins on the two-dimensional map were annotated in Fig. 5.
In HCV-associated patterns, the expression of apolipoprotein E showed a tendency to increase in VLDL/LDL from patients with HCV infection (relative amount 14.55 ± 3.06 % vs. 10.76 ± 2.3 3 % in normal sample, p < 0.05). The suppression of prenylcysteine lyase (spot 114, 116 and 118) as well as apolipoprotein LI (Apo LI, spot 207 and 210) were observed in HCV-infected patients. Spot 114, 116 and 118 were significantly reduced in VLDL/LDL from patients with HCV infection (relative amount 3.03 ± 0.23 % vs. 5.26 ± 0.53 % in normal sample; 2.87 ± 0.20 % vs. 4.69 ± 0.46 in normal sample; 1.38 ± 0.11 % vs. 2.23 ± 0.25 in normal sample, respectively; p < 0.01). Similarly, spot 207 and spot 210 were decreased in patients with HCV infection (relative amount 2.92 ± 0.55 % vs. 4.34 ± 0.52 % in normal sample; 1.12 ± 0.18 % vs. 1.92 ± 0.26% in normal sample, respectively; p < 0.05). Moreover, the expression levels of Vitamin D binding protein precursor (DBP) was not changed between 3 groups, but could be detected in 65% of HCV-infected patients (compared with 20% of HBV infected patients and 25% of normal control). The spot 40 with decreasing expression level in HCV-infected samples (relative amount 7.45 ± 0.73 % vs. 9.59 ± 0.57 % in normal sample, p < 0.01) was identified asapolipoprotein M .
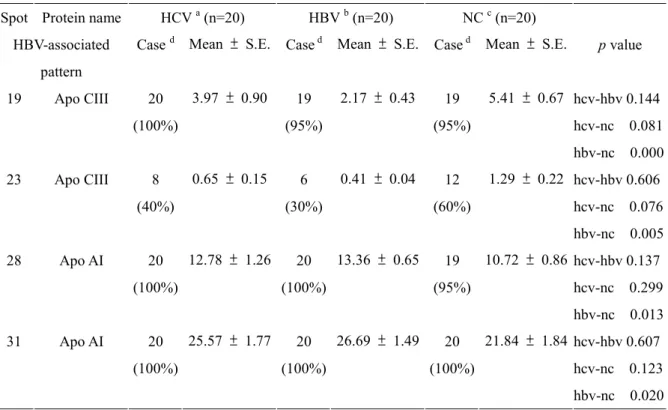
Differential expression of lipoprotein CIII (Apo CIII, spot 19 and 23) and apolipoprotein AI (Apo AI, spot 28, 31 and 33) were found in HBV-associated patterns. Spot 19 and spot 23 were significantly reduced in VLDL/LDL from patients with HBV infection (relative amount 2.17 ± 0.43 % vs. 5.41 ± 0.67 % in normal sample; 0.41 ± 0.04 % vs. 1.29 ± 0.22 % in normal sample, respectively; p < 0.001). Comparatively, two isoforms of apo AI, spot 28 and spot 31, were increased (relative amount 13.36 ± 0.65 % vs. 10.72 ± 0.86 % in normal sample; relative amount 26.69 ± 1.49 % vs. 21.84 ± 1.84 % in normal sample, respectively; p < 0.05) in samples with HBV infection.
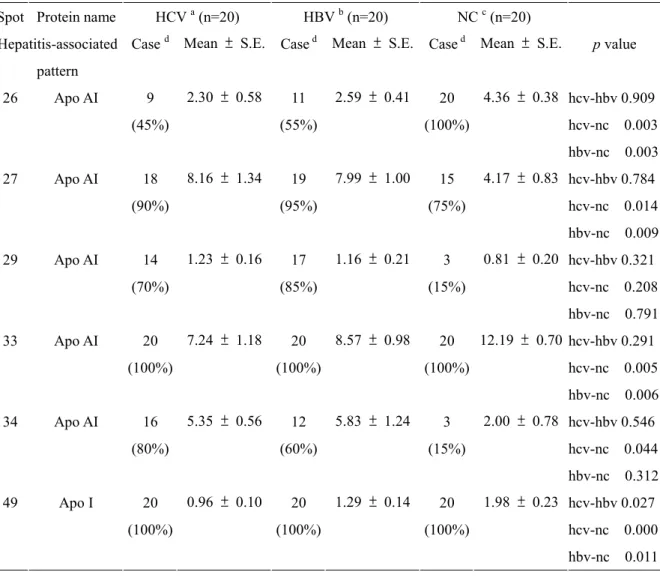
Changes in the expression of several isoforms of apo AI (spot 26, 27, 29, 33, 34, and 49) were appeared in hepatitis-associated patterns. The occurrence and expression level of spot 26 was decreased in patients with virus infection (relative amount 2.30 ± 0.58 % of 45 % HCV-infected samples and 2.59 ± 0.41 % of 55 % HBV-infected samples compared with 4.36 ± 0.38 % of 100 % normal control, p < 0.01). Additionally, serum samples from patients with HBV and HCV-infection showed a 2-fold increase on spot 27 when compared
to controls (relative amount 8.16 ± 1.34 % in HCV-infected samples and 7.99 ± 1.00 % in HBV-infected samples vs. 4.17 ± 0.83 % in control individuals, p<0.05). The occurrence of spot 29 and spot 34 was significantly reduced in samples with virus infection (70 % in HCV-infected sample and 85 % in HBV-infected samples vs. 15 % in normal control, and 80 % in HCV-infected sample and 60 % HBV-infected samples vs. 15 % in normal control, respectively; p < 0.01). Moreover, all VLDL/LDL samples from patients with viral-infection showed a significant decrease on spot 33 and spot 49 when compared to controls (relative amount 7.24 ± 1.18 % in HCV-infected samples and 8.57 ± 0.98 % in HBV-infected samples vs. 12.19 ± 0.70 % in control individuals, and 0.96 ± 0.10 % in HCV-infected samples and 1.29 ± 0.14 % in HBV-infected samples vs. 1.98 ± 0.23 % in control
individuals, respectively; p < 0.01). All together, the results suggest that infections with the hepatitis viruses could affect the lipid metabolism of infected cells and might alter the protein composition of VLDL/LDL.
討論: HCV RNA is detected over a large range of densities in gradient fractions of infected human plasma, with variations from serum sample to serum sample7,29,30. The presence of low-density fractions containing HCV RNA and the possibility of immunoprecipitation of HCV RNA with anti-ApoB antibodies suggests an association of viral components with lipoproteins7,12. To clarify this association, the density-gradient centrifugation is performed to prepare fractions containing VLDL, LDL, and HDL from HCV infected human blood sample. The fractions containing lipoproteins are recovered and confirmed by lipoprotein
electrophoresis and biochemical analysis. The data show that TG, LDL, and cholesterol are concentrated in the 1stfraction, whereas HDL is appeared in the 4thfraction. The result indicates that the lipoprotein could be isolated from human blood sample by NaCl-adjusted gradient ultracentrifugation.
Human lipoprotein is produced in the hepatocyte when TG is transported into ER lumen where TG interacts with the microsomal TG transfer protein (MTP) and the apolipoprotein B (Apo B) is synthesized by ribosome on the ER membrane, simultaneously. The protein disulfide isomerase (PDI) and MTP fabricate the Apo B and TG to the lipoprotein vesicle. The newly synthesized lipoprotein is subsequently denominated as VLDL (density < 1.0063 g/ml), which contains large amount of TG and is exported from hepatocyte by exocytosis. The TG of VLDL could be consumed progressively in the process of transportation by blood stream and become LDL (density between 1.025 to 1.055 g/ml). The peripheral cells intakes the LDL by the interaction of Apo B and LDL receptor located on the cell membrane16,17.
The data of biochemical analysis of plasma and fraction containing VLDL/LDL reveal the levels of TG and cholesterol of patients with viral infection are decreased and the results indicate that HBV or HCV infection might alter the lipid metabolism of infected patients. It has been reported that in patients with chronic HCV serum cholesterol is significantly lower than in appropriately matched controls31. Moreover, multiple cellular genes involved in lipid
metabolism are differentially regulated during viral spread in acutely infected chimpanzees32,33, and that ATP citrate lyase, which is required for cholesterol and fatty acid biosynthesis, is induced during the initial rise of high-level HCV replication during acute infection in chimpanzees. There is considerable evidence suggesting that the cholesterol and fatty-acid-biosynthesis pathways may play a role in HCV replication and infection. Steatosis, i.e., the formation of hepatocellular lipid droplets, is a well documented histological characteristic of HCV infection in humans, chimpanzees, and mouse models of HCV core-protein expression34-36. The results of in vitro study also demonstrate that triglyceride levels, as well as MTP mRNA and activity levels were reduced in HCV replicon-expressing cells27. Moreover, the data of cDNA microarray analysis of HBV transgenic mice specifically identify enzymes involved in fatty acid and NADPH-electron transport pathways that are altered by the presence of HBV37. These data strongly suggest that HCV or HBV may directly affect one or more steps in cholesterol and/or fatty acid biosynthesis.
HCV and HBV infections are the major causality of chronic hepatitis and HCC. To test any distinct association between low-density lipoprotein and HCV infection, three groups of samples from HCV-infected patients, HBV-infected patients, and samples without HCV/HBV infection are collected. The data show that higher proportion of HCV RNA could be detected in low-density fractions isolated from HCV-infected samples, while HBV DNA is rarely found in low-density fractions isolated HBV-infected samples. This result supports the previous observation that HCV might infect peripheral cell through the LDL receptor by interacting with apolipoprotein B appeared in VLDL and LDL18,20. The results of RNase sensitivity assay show that HCV RNA is susceptible to RNase A when the lipid component is removed by the detergent pre-treatment. On contrary, HCV-RNA in the absence of detergent pre-treatment is resistance to RNase digestion. The results indicate that the lipid components of VLDL/LDL prevent HCV RNA from digestion and prolong the half-life of HCV RNA. Moreover, HCV viral-lipid particle might be much protected than free virion in circulation. All together, our data suggest that HCV RNA detected low-density fraction is acted as viral-lipid particles instead of HCV virion.
Accumulating data suggested that lipoproteins might mimic ligands as binding to host surface receptor for HCV entry by endocytosis18,20,21. However, the uptake of purified lipo-viro-particle (LVP) is also observed by using LDL receptor-negative fibroblasts (FH) derived from a patient with familial hypercholesterolemia22. These reports indicted that LDL receptor pathway is not the only pathway for entry of viral-lipid particles. Our data imply that HCV RNA could be packed into viral-lipid particle with lipid. Certain host proteins might participate in the viral-lipid particle formation, which might be mediated with the infection of other cells in the process of VLDL/LDL transportation in bloodstream.
It has been demonstrated that the host protein, TSG101, which functions in vacuolar protein sorting, is required for HIV-1 budding38. Therefore, HCV viral-lipid particles
assemble in the ER lumen of hepatocyte, where cellular proteins are hypothesized to play a role in the HCV viral-lipid particle formation. To investigate the component in HCV viral-lipid particle, the low-density fractions are explored by 2D separating technique couple with image analysis. The proteomic study displayed thirteen protein spots with significantly differential expression levels as classified into HBV-associated, HCV-associated and HBV/HCV-associated patterns. Identified proteins with MALDI-TOF were: apolipoprotein CIII (two isoforms) and apolipoprotein AI (two isoforms) in the HBV-associated pattern, apolipoprotein E and apolipoprotein M/HSPC336/G3a in the HCV-associated pattern, and apolipoprotein AI (seven isoforms) in the HBV/HCV pattern.
Human apolipoprotein E (apoE) is a component of several lipoprotein classes that exists in 3 major isoforms (apoE2, -E3, and -E4) encoded by 3 alleles (apoE-2, -3, and -4). The three isoforms of apo E was differed at two residues, E2 (Cyspot 1012, Cyspot 1058), E3 (Cyspot 1012, Arg158), and E4 (Arg112, Arg158). It had been demonstrated that apo E isoforms were involved in some diseases. Carriage of an apoE-4 allele and presence of HSV1 in brain together conferred astrong risk forAlzheimer’sdisease,whereasneitherfactoraloneisa
risk39,40. ApoE-4 was also a risk factor for herpes labialis and apoE-2 allele was a risk
factor for herpes simplex encephalitis41. A previous study of APOE gene polymorphisms in HCV infection suggests decreased severity of liver disease in patients with the E4 allele42. Moreover, it has been documented the APOE-2 and APOE-4 alleles were both associated with a reduced likelihood of chronic infection43.
A recently discovered apolipoprotein, Apo M, is identified in HCV-infected samples. Apo M associates with triglyceride-rich lipoproteins (TGRLP) through N-terminal sequencing of proteins44. Wolfrum et al. (2005) demonstrate that mice deficient in Apo M accumulated cholesterol in large HDL particles while the conversion of HDL to pre-beta-HDL is impaired, leading to a markedly reduce cholesterol efflux from macrophages to Apo M-deficient HDL compared to normal HDL in vitro45. Apo M is structurally related to the lipocalin family and has two acidic areas of potential importance46, but the function of the protein in relation to lipoproteins remains to be investigated.
Two isoforms of Apo CIII and Apo AI are identified in patient with HBV infection. Apo CIII, previously identified in VLDL and HDL, plays important parts in the triglyceride metabolism. Moreover, apo C-III gene is down regulated by thyroid hormones, insulin, and cytokines as interleukin-147. Apo AI represents the major protein component of high-density lipoprotein (HDL) and act as a cofactor for lecitin: cholesterol acyl transferrase (LCAT) to produce esterified cholesterol48. Norton et al. demonstrate that the mRNA levels of Apo AI and Apo CIII are reduced in cells with HBV replication28. The results indicate the HBV replication might suppress expression of Apo AI and Apo CIII and alter the lipid metabolism of HBV-infected cells. In our study, expression of Apo CIII is decreased in HBV-infected samples, but expression of two isoforms of Apo AI, spot 28 and spot 31, are increased. The
results of Apo AI are against those in HBV-replicating cells. The Apo AI assessed in our study is evaluated the individual expression levels of each Apo AI isoforms, instead expression of total Apo AI. This may be reason of contrary results of Apo AI.
We identify 8 isoforms of Apo AI with different expression levels or occurrence in patients with HBV or HCV infection. A specific isoforms of Apo AI has been found in serum sample from HBV-induced hepatocellular carcinoma49. The specific isoforms of Apo AI is identical with spot 26 in our study. However, our results show that spot 26 with decreasing expression appears not only in HBV-infected samples, but also in HCV-infected samples. Moreover, Apo AI combined with 2 macroglobulin,2 globulin (or haptoglobin),
globulin,glutamyltranspeptidase, and total bilirubin might be have high positive value for diagnosis of fibrosis induced by HCV infection50. All together, the observations suggest that the specific isoforms of Apo AI, spot 26, might be the biomarker for early stage detection of HBV or HCV infection.
Our findings define the biological and proteomic nature of the VLDL/LDL from patients with HBV and HCV infections. We provide direct evidence that lipid compartment of VLDL/LDL might protect HCV RNA from RNase digestion and prolong the half-life of HCV RNA. In the present investigation, we hypothesize that HCV RNA might be packed into LDL particles with triglycerides during LDL formation. Furthermore, analysis of VLDL/LDL from HCV-infected, HBV-infected patients and normal control by proteomic approaches reveals the possibility of proteins with different expression as useful biomarkers for early detection of virus infection. In conclusion, the results suggest that a substantial amount of circulating HCV genome is associated with the VLDL/LDL particles and infections with the hepatitis viruses could alter the protein profile in VLDL/LDL.
Figure legend
Figure 1: Isolation of VLDL and LDL.
(A) The density of plasma was adjusted by NaCl and subjected ultra-centrifugation at 4℃ for 5 hours. Lipoproteins (HDL, LDL, and VLDL) were separated according to mobility. The LDL and VLDL could be detected mostly in fraction 1, whereas HDL appeared in fraction 3 and fraction 4. Ori, original blood sample; F1-F8, fraction 1 to fraction 8; LDL std., LDL standard.
(B) The first three fractions were tested by TG, LDL, and HDL quantification. Data was shown as fold of original blood sample. Asterisk, p < 0.01 compared with the other fractions. TG, triglyceride. LDL, low density lipoprotein. HDL, high density lipoprotein
Figure 2. The viral titer and protein concentration of each fractions.
The fractions from 5 HCV-infected or 5 HBV-infected patients were subjected quantification of viral titer and protein concentration. The fractions from samples infected
with HCV or HBV protein shared the same protein distribution. However, the viruses were concentrated in first fraction of HCV-infected samples, but eighth fraction of HBV-infected samples. Asterisk, p < 0.01
Figure 3. The ratio of HBV and HCV viral titers in low-density fraction and origin blood sample.
Viral titer in the original blood samples and the low-density fractions were quantified by real-time PCR. Data were shown as percentage of original viral titer by mean + SD, including patients with chronic HCV-infection (n = 20), and chronic HBV-infection (n = 20). Asterisk, p < 0.01
Figure 4. RNase sensitivity assay.
The low-density fractions containing HCV viral-lipid particles were treated with 1% triton X-100 and 1% NP-40 at 37℃ and 4℃ for 1 hour, respectively. Then, samples were treated with RNase at 37℃ for 0 min, 5 min, 15 min, and 30 min. The data were shown as HCV RNA copies per milliliter. Each plot represents four independent samples. The detection limit of real-time PCR was 800 copies/ml of HCV RNA.
Figure 5. Resolution of human serum proteins by 2-DE.
Low-density lipoproteins (300g) from the serum sample were resolved using pH 3–10 IPG strip in the first dimension and an 8-16 % gel in the second dimension. Gels were stained with silver and imaged using a software LabScanV3.00.
References
1. Cohen, J. The scientific challenge of hepatitis C. Science 285, 26-30 (1999). 2. WHO. Hepatitis B Fact Sheet. WHO Web site No. 204 (Revised October 2000).
(2000).
3. Michel, M. L. & Mancini-Bourgine, M. Therapeutic vaccination against chronic hepatitis B virus infection. J Clin Virol 34 Suppl 1, S108-14 (2005).
4. Lavanchy, D. Worldwide epidemiology of HBV infection, disease burden, and vaccine prevention. J Clin Virol 34 Suppl 1, S1-3 (2005).
5. Shimizu, Y. K., Iwamoto, A., Hijikata, M., Purcell, R. H. & Yoshikura, H. Evidence for in vitro replication of hepatitis C virus genome in a human T-cell line. Proc Natl Acad Sci U S A 89, 5477-81 (1992).
6. Sung, V. M. et al. Establishment of B-cell lymphoma cell lines persistently infected with hepatitis C virus in vivo and in vitro: the apoptotic effects of virus infection. J Virol 77, 2134-46 (2003).
7. Thomssen, R., Bonk, S. & Thiele, A. Density heterogeneities of hepatitis C virus in human sera due to the binding of beta-lipoproteins and immunoglobulins. Med Microbiol Immunol (Berl) 182, 329-34 (1993).
8. Thomssen, R. et al. Association of hepatitis C virus in human sera with beta-lipoprotein. Med Microbiol Immunol (Berl) 181, 293-300 (1992).
9. Monazahian, M. et al. Binding of human lipoproteins (low, very low, high density lipoproteins) to recombinant envelope proteins of hepatitis C virus. Med Microbiol Immunol (Berl) 188, 177-84 (2000).
10. Agnello, V. The aetiology of mixed cryoglobulinaemia associated with hepatitis C virus infection. Scand J Immunol 42, 179-84 (1995).
11. Hijikata, M. et al. Equilibrium centrifugation studies of hepatitis C virus: evidence for circulating immune complexes. J Virol 67, 1953-8 (1993).
12. Prince, A. M., Huima-Byron, T., Parker, T. S. & Levine, D. M. Visualization of hepatitis C virions and putative defective interfering particles isolated from low-density lipoproteins. J Viral Hepat 3, 11-7 (1996).
13. Bradley, D. et al. Hepatitis C virus: buoyant density of the factor VIII-derived isolate in sucrose. J Med Virol 34, 206-8 (1991).
14. Wetterau, J. R. et al. Absence of microsomal triglyceride transfer protein in individuals with abetalipoproteinemia. Science 258, 999-1001 (1992).
15. Wang, L., Fast, D. G. & Attie, A. D. The enzymatic and non-enzymatic roles of protein-disulfide isomerase in apolipoprotein B secretion. J Biol Chem 272, 27644-51 (1997).
16. Shelness, G. S., Ingram, M. F., Huang, X. F. & DeLozier, J. A. Apolipoprotein B in the rough endoplasmic reticulum: translation, translocation and the initiation of
lipoprotein assembly. J Nutr 129, 456S-462S (1999).
17. Rustaeus, S. et al. Assembly of very low density lipoprotein: a two-step process of apolipoprotein B core lipidation. J Nutr 129, 463S-466S (1999).
18. Monazahian, M. et al. Low density lipoprotein receptor as a candidate receptor for hepatitis C virus. J Med Virol 57, 223-9 (1999).
19. Sabile, A. et al. Hepatitis C virus core protein binds to apolipoprotein AII and its secretion is modulated by fibrates. Hepatology 30, 1064-76 (1999).
20. Agnello, V., Abel, G., Elfahal, M., Knight, G. B. & Zhang, Q. X. Hepatitis C virus and other flaviviridae viruses enter cells via low density lipoprotein receptor. Proc Natl Acad Sci U S A 96, 12766-71 (1999).
21. Wunschmann, S., Medh, J. D., Klinzmann, D., Schmidt, W. N. & Stapleton, J. T. Characterization of hepatitis C virus (HCV) and HCV E2 interactions with CD81 and the low-density lipoprotein receptor. J Virol 74, 10055-62 (2000).
22. Andre, P. et al. Characterization of low- and very-low-density hepatitis C virus RNA-containing particles. J Virol 76, 6919-28 (2002).
23. Schumaker, V. N. & Puppione, D. L. Sequential flotation ultracentrifugation. Methods Enzymol 128, 155-70 (1986).
24. Noble, R. P. Electrophoretic separation of plasma lipoproteins in agarose gel. J Lipid Res 9, 693-700 (1968).
25. Tyan, Y. C., Wu, H. Y., Su, W. C., Chen, P. W. & Liao, P. C. Proteomic analysis of human pleural effusion. Proteomics 5, 1062-74 (2005).
26. Jarmay, K., Karacsony, G., Nagy, A. & Schaff, Z. Changes in lipid metabolism in chronic hepatitis C. World J Gastroenterol 11, 6422-8 (2005).
27. Domitrovich, A. M., Felmlee, D. J. & Siddiqui, A. Hepatitis C virus nonstructural proteins inhibit apolipoprotein B100 secretion. J Biol Chem 280, 39802-8 (2005). 28. Norton, P. A., Gong, Q., Mehta, A. S., Lu, X. & Block, T. M. Hepatitis B
virus-mediated changes of apolipoprotein mRNA abundance in cultured hepatoma cells. J Virol 77, 5503-6 (2003).
29. Carrick, R. J., Schlauder, G. G., Peterson, D. A. & Mushahwar, I. K. Examination of the buoyant density of hepatitis C virus by the polymerase chain reaction. J Virol Methods 39, 279-89 (1992).
30. Miyamoto, H., Okamoto, H., Sato, K., Tanaka, T. & Mishiro, S. Extraordinarily low density of hepatitis C virus estimated by sucrose density gradient centrifugation and the polymerase chain reaction. J Gen Virol 73 ( Pt 3), 715-8 (1992).
31. Serfaty, L. et al. Hepatitis C virus induced hypobetalipoproteinemia: a possible mechanism for steatosis in chronic hepatitis C. J Hepatol 34, 428-34 (2001). 32. Su, A. I. et al. Genomic analysis of the host response to hepatitis C virus infection.
33. Bigger, C. B. et al. Intrahepatic gene expression during chronic hepatitis C virus infection in chimpanzees. J Virol 78, 13779-92 (2004).
34. Moriya, K. et al. The core protein of hepatitis C virus induces hepatocellular carcinoma in transgenic mice. Nat Med 4, 1065-7 (1998).
35. Moriya, K. et al. Hepatitis C virus core protein induces hepatic steatosis in transgenic mice. J Gen Virol 78 ( Pt 7), 1527-31 (1997).
36. Perlemuter, G. et al. Hepatitis C virus core protein inhibits microsomal triglyceride transfer protein activity and very low density lipoprotein secretion: a model of viral-related steatosis. Faseb J 16, 185-94 (2002).
37. Hajjou, M. et al. cDNA microarray analysis of HBV transgenic mouse liver identifies genes in lipid biosynthetic and growth control pathways affected by HBV. J Med Virol 77, 57-65 (2005).
38. Garrus, J. E. et al. Tsg101 and the vacuolar protein sorting pathway are essential for HIV-1 budding. Cell 107, 55-65 (2001).
39. Itzhaki, R. F. et al. Herpes simplex virus type 1 in brain and risk of Alzheimer's disease. Lancet 349, 241-4 (1997).
40. Itzhaki, R. F. & Lin, W. R. Herpes simplex virus type I in brain and the type 4 allele of the apolipoprotein E gene are a combined risk factor for Alzheimer's disease. Biochem Soc Trans 26, 273-7 (1998).
41. Lin, W. R., Wozniak, M. A., Esiri, M. M., Klenerman, P. & Itzhaki, R. F. Herpes simplex encephalitis: involvement of apolipoprotein E genotype. J Neurol Neurosurg Psychiatry 70, 117-9 (2001).
42. Wozniak, M. A. et al. Apolipoprotein E-epsilon 4 protects against severe liver disease caused by hepatitis C virus. Hepatology 36, 456-63 (2002).
43. Price, D. A. et al. The apolipoprotein {epsilon}3 allele is associated with persistent hepatitis C virus infection. Gut (2005).
44. Xu, N. & Dahlback, B. A novel human apolipoprotein (apoM). J Biol Chem 274, 31286-90 (1999).
45. Wolfrum, C., Poy, M. N. & Stoffel, M. Apolipoprotein M is required for prebeta-HDL formation and cholesterol efflux to HDL and protects against atherosclerosis. Nat Med 11, 418-22 (2005).
46. Duan, J., Dahlback, B. & Villoutreix, B. O. Proposed lipocalin fold for apolipoprotein M based on bioinformatics and site-directed mutagenesis. FEBS Lett 499, 127-32 (2001).
47. Raspe, E. et al. Transcriptional regulation of apolipoprotein C-III gene expression by the orphan nuclear receptor RORalpha. J Biol Chem 276, 2865-71 (2001).
48. Brewer, H. B., Jr. et al. The amino acid sequence of human APOA-I, an apolipoprotein isolated from high density lipoproteins. Biochem Biophys Res
Commun 80, 623-30 (1978).
49. Steel, L. F. et al. A strategy for the comparative analysis of serum proteomes for the discovery of biomarkers for hepatocellular carcinoma. Proteomics 3, 601-9 (2003). 50. Imbert-Bismut, F. et al. Biochemical markers of liver fibrosis in patients with
Table 1. Biochemical parameters of patients included into this study. Patient HCV (N=20) HBV (N=20) NBNC (N=20) p- value Sex (M/F) 13/7 14/6 8/12 0.119 Age 40.6 ± 12.7a 27.2 ± 7.1 28.6 ± 7.8 < 0.001 ALT (U/L) 29.2 ± 37.6 28.1 ± 29.5 ND 0.597 Plasma sample TG (mg/dl) 118.9 ± 132.4 65.7 ± 22.1 93.0 ± 56.1 0.318 LDL (mg/dl) 80.4 ± 20.9 88.8 ± 21.4 96.1 ± 26.8 0.118 Chol (mg/dl) 134.5 ± 20.9 147.2 ± 19.2 159.1 ± 29.8 0.007 VLDL/LDL TG (mg/dl) 100.0 ± 11.9 69.6 ± 29.1 118.2 ± 11.7 0.003 LDL (mg/dl) 169.1 ± 18.3 182.9 ± 15.8 249.3 ± 24.1 0.059 Chol (mg/dl) 225.3 ± 20.1 234.6 ± 17.1 301.2 ± 24.8 0.038 aMean + S.D.
ALT alanine aminotransferase, TG triglycerides, LDL low density lipoprotein, Chol -cholesterol, ND –not determined
Table 2. The proteins for which expression levels differed among HCV-infected and HBV-infected samples
Spot Protein name HCVa(n=20) HBVb(n=20) NCc(n=20) HCV-associated
pattern
Cased Mean ± S.E. Cased Mean ± S.E. Cased Mean ± S.E. p value
11 Apo E 12 (60%) 14.55 ± 3.06 16 (80%) 7.15 ± 1.98 12 (60%) 10.76 ± 2.33 hcv-hbv 0.042 hcv-nc 0.347 hbv-nc 0.241 40 Apo M 20 (100%) 7.45 ± 0.73 19 (95%) 8.96 ± 0.63 19 (95%) 9.59 ± 0.57 hcv-hbv 0. 028 hcv-nc 0.004 hbv-nc 0.439 93 DBP 13 (65%) 0.76 ± 0.21 4 (20%) 0.63 ± 0.17 5 (25%) 0.81 ± 0.21 hcv-hbv 0.734 hcv-nc 0.46 hbv-nc 0.462 114 Prenylcysteine lyase 20 (100%) 3.03 ± 0.23 20 (100%) 4.28 ± 0.28 20 (100%) 5.26 ± 0.53 hcv-hbv 0.003 hcv-nc 0.001 hbv-nc 0.144 116 Prenylcysteine lyase 20 (100%) 2.87 ± 0.20 20 (100%) 4.12 ± 0.26 20 (100%) 4.69 ± 0.46 hcv-hbv 0.001 hcv-nc 0.003 hbv-nc 0.543 118 Prenylcysteine lyase 20 (100%) 1.38 ± 0.11 19 (95%) 1.93 ± 0.15 19 (95%) 2.23 ± 0.25 hcv-hbv 0.005 hcv-nc 0.011 hbv-nc 0.583 207 Apo LI 20 (100%) 2.92 ± 0.55 20 (100%) 3.09 ± 0.49 19 (95%) 4.34 ± 0.52 hcv-hbv 0.552 hcv-nc 0.013 hbv-nc 0.064 210 Apo LI 19 (95%) 1.12 ± 0.18 19 (95%) 1.23 ± 0.20 18 (90%) 1.92 ± 0.26 hcv-hbv 0.651 hcv-nc 0.015 hbv-nc 0.048
Table 2. Continued
Spot Protein name HCVa(n=20) HBVb(n=20) NCc(n=20)
HBV-associated pattern
Cased Mean ± S.E. Cased Mean ± S.E. Cased Mean ± S.E. p value
19 Apo CIII 20 (100%) 3.97 ± 0.90 19 (95%) 2.17 ± 0.43 19 (95%) 5.41 ± 0.67 hcv-hbv 0.144 hcv-nc 0.081 hbv-nc 0.000 23 Apo CIII 8 (40%) 0.65 ± 0.15 6 (30%) 0.41 ± 0.04 12 (60%) 1.29 ± 0.22 hcv-hbv 0.606 hcv-nc 0.076 hbv-nc 0.005 28 Apo AI 20 (100%) 12.78 ± 1.26 20 (100%) 13.36 ± 0.65 19 (95%) 10.72 ± 0.86 hcv-hbv 0.137 hcv-nc 0.299 hbv-nc 0.013 31 Apo AI 20 (100%) 25.57 ± 1.77 20 (100%) 26.69 ± 1.49 20 (100%) 21.84 ± 1.84 hcv-hbv 0.607 hcv-nc 0.123 hbv-nc 0.020
Table 2. Continued
Spot Protein name HCVa(n=20) HBVb(n=20) NCc(n=20)
Hepatitis-associated pattern
Cased Mean ± S.E. Cased Mean ± S.E. Cased Mean ± S.E. p value
26 Apo AI 9 (45%) 2.30 ± 0.58 11 (55%) 2.59 ± 0.41 20 (100%) 4.36 ± 0.38 hcv-hbv 0.909 hcv-nc 0.003 hbv-nc 0.003 27 Apo AI 18 (90%) 8.16 ± 1.34 19 (95%) 7.99 ± 1.00 15 (75%) 4.17 ± 0.83 hcv-hbv 0.784 hcv-nc 0.014 hbv-nc 0.009 29 Apo AI 14 (70%) 1.23 ± 0.16 17 (85%) 1.16 ± 0.21 3 (15%) 0.81 ± 0.20 hcv-hbv 0.321 hcv-nc 0.208 hbv-nc 0.791 33 Apo AI 20 (100%) 7.24 ± 1.18 20 (100%) 8.57 ± 0.98 20 (100%) 12.19 ± 0.70 hcv-hbv 0.291 hcv-nc 0.005 hbv-nc 0.006 34 Apo AI 16 (80%) 5.35 ± 0.56 12 (60%) 5.83 ± 1.24 3 (15%) 2.00 ± 0.78 hcv-hbv 0.546 hcv-nc 0.044 hbv-nc 0.312 49 Apo I 20 (100%) 0.96 ± 0.10 20 (100%) 1.29 ± 0.14 20 (100%) 1.98 ± 0.23 hcv-hbv 0.027 hcv-nc 0.000 hbv-nc 0.011
aAnti- HCV-positive and HBsAg-negative cases bHBsAg-positive and anti- HCV-negative cases cHBsAg-negative and anti-HCV-negative dNumber of cases
Figure 1 0 0.5 1 1.5 2 2.5 3 3.5 4 4.5 F1 F2 F3
C
on
ce
nt
ra
ti
on
(f
ol
ds
of
or
ig
in
al
bl
oo
d
sa
m
pl
e)
.
TG LDL HDL LDL HDL Ori F1 F2 F3 F4 F5 F6 F7 F8 VLDL A Albumin LDL std. B* *
* *
Figure 2 1 10 100 1000 1 2 3 4 5 6 7 8 Fractions V ir us tit er (% of or ig in al vi ru s tit er ) . 0 1 10 100 1000 P ro te in co nc . (% of or ig in al pr ot ei n co nc .) .
HCV virus titer HBV virus titer
HCV prot. Conc. HBV prot. Conc.
Figure 3
0.00%
30.00%
60.00%
90.00%
120.00%
HCV
HBV
V
ir
al
ti
te
r
(%
of
or
ig
in
al
pl
as
m
a)
.
*
Figure 4
1.00E+02
1.00E+03
1.00E+04
1.00E+05
1.00E+06
1.00E+07
0 min
5 min
15 min
30 min
H
C
V
R
N
A
(C
op
ie
s/
m
l)
TX-100
NP-40
No-treat
Detection limit
Figure 5