國立臺灣大學理學院化學研究所 碩士論文
Department of Chemistry College of Science
National Taiwan University Master Thesis
以紫外光吸收光譜法測量小型克里奇中間體的反應動力學 Kinetic Studies of Small Criegee Intermediates
by UV Absorption Spectroscopy
趙彣 Wen Chao
指導教授:林志民 博士 Advisor: Jim Jr-Min Lin, Ph.D.
中華民國 106 年 6 月
June 2017
摘要
臭氧化反應是消耗大氣中不飽和碳氫化合物的主要反應之一。克里奇中間體 (羰基氧化物) 會 在臭氧化反應中生成,進一步可能產生氫氧自由基或與大氣中其它分子反應。我們團隊利用克
里奇中間體在紫外光波段的強烈吸收,對最簡單的克里奇中間體CH2OO 和二甲基取代克里奇
中間體 (CH3)2COO 做動力學探討;包含(CH3)2COO 的單分子分解反應和兩者對水蒸氣、C2H4
和(CH3)2C=C(CH3)2的雙分子反應。我們控制反應管中的溼度並發現CH2OO 的衰減速率對[H2O]
呈平方關係,指出與水二聚體之反應為主要發生的過程(k(H2O)2 = (7.4±0.6)x1012 cm3s1),但 (CH3)2COO 與水蒸氣的反應慢到無法測量(kH2O < 1.5x1016 cm3s1)。另一方面,由於氫原子的
穿隧效應,(CH3)2COO 在一般的大氣條件下會進行分子內氫原子轉移而分解。我們測量並分析
可能的副反應的反應物濃度效應並決定(CH3)2COO 在 298K 的熱分解速率為 kth,H(298K) = (361±49) s1。此穿隧效應也藉由對(CD3)2COO 做相同的測量與分析而確認(kth,D(298K) < 100 s1)。我們也探討了克里奇中間體與烯類分子[C2H4、(CH3)2C=C(CH3)2]之間的反應行為。CH2OO 和C2H4 的反應速率係數被測量為(6.8±0.7)x1016 cm3s1,且在50 760 Torr 之間沒有壓力效 應。另外(CH3)2COO 的衰減速率對 C2H4的濃度呈現一奇特的現象,當C2H4的濃度大於1x10¹⁶
cm3時,(CH3)2COO 的衰減速率會上升至一定值。我們目前還無法解釋這個現象。
關鍵詞: 氣態反應動力學、臭氧化反應、紫外光吸收光譜、克里奇中間體 (羰基氧化物)、反 應性的結構效應、單分子分解反應。
Abstract
Ozonolysis reaction is one of the main removal channels of unsaturated hydrocarbons in the
atmosphere. Carbonyl oxide, also known as Criegee intermediate, is produced in ozonolysis reaction and thought to play a role in OH radical formation and react with atmospheric gases. Our group have probed CH2OO and (CH3)2COO by utilizing their strong UV absorption. The unimolecular
decomposition of (CH3)2COO and their bimolecular reactions with water vapor, C2H4 and
(CH3)2C=C(CH3)2 have been studied. We controlled the humidity in the reactor and found that the observed decay rate of CH2OO showed a quadratic dependence on [H2O], and thus assigned water dimer reaction to be the main pathway in the CH2OO decay, k(H2O)2 = (7.4±0.6)x1012 cm3s1, while (CH3)2COO reaction with water vapor was too slow to measure (kH2O < 1.5x1016 cm3s1). On the other hand, (CH3)2COO will isomerize and decompose under ambient conditions via fast tunneling of hydrogen atom. We measured and analyzed the concentration dependences for the reactants of
possible side reactions to extract the thermal decomposition rate coefficients of (CH3)2COO to be (361±49) s1 at 298 K. The tunneling mechanism was confirmed by the small decomposition rate of (CD3)2COO, kth(298K)< 100 s1. For the reactions of Criegee intermediates with alkenes, the rate coefficient of CH2OO + C2H4 has been measured to be (6.8±0.7)x1016 cm3s1 with negligible pressure dependence (50 760 Torr). Furthermore, a strange kinetic behavior was observed in the decay rate of (CH3)2COO when adding C2H4; the (CH3)2COO decay rate increases to a saturation level for [C2H4] ≥ 1x1016 cm3. We have no good explanation for this observation yet.
Keywords: gas phase reaction kinetics, ozonolysis reaction, UV absorption spectroscopy, Criegee
intermediate (carbonyl oxide), structure effect in reactivity, unimolecular decomposition.Contents
摘要 ... i
Abstract ... ii
Chapter 1 Introduction ... 1
Chapter 2 Experimental Section ... 8
2.1 Optical Setup ... 9
2.2 Baseline Stability ... 13
2.3 Water Vapor in the Reactor ... 15
2.4 Precursor in the Reactor ... 17
2.5 Synthesis of 2,2-diiodopropane ... 18
2.6 Photolysis system of CH
2I
2and (CH
3)
2CI
2... 21
Chapter 3 Reaction with Water Vapor ... 24
Chapter 4 Unimolecular Decomposition ... 38
Chapter 5 Reaction with Small Alkenes ... 51
Chapter 6 Future Outlooks ... 57
Summary ... 59
Reference ... 61
Figure Captions
Fig. 1 Reaction mechanism of tatramethyl ethylene (TME) ozonolysis in liquid phase. ... 1
Fig. 2 Reaction scheme of TME ozonolysis in the gas phase. ... 2
Fig. 3 Resonance structures of Criegee intermediate. ... 5
Fig. 4 Schematic of our multipass system for 6 paths. . ... 9
Fig. 5 Schematic optical setup. ... 11
Fig. 6 Results of scanning the horizontal or vertical positions of the balanced photodiode detector. . 12
Fig. 7 Typical example showing the absorption background subtraction. ... 13
Fig. 8 Typical baseline check showing the stability before and after improvement. ... 15
Fig. 9 Mass spectra of synthesized 2,2-diiodopropane and deuterated 2,2-diiodopropane. ... 20
Fig. 10 Three dimensional plot for 2D fitting of observed decay rate of (CH3)2COO. ... 21
Fig. 11 Typical transient spectra of CH2I2 and (CH3)2CI2 photolysis systems. ... 22
Fig. 12 Absolute cross section of important species in diiodoalkane/O2 photolysis system. ... 23
Fig. 13 Representative time profile of CH2OO band under different humidity level at 298 K. ... 26
Fig. 14 Pseudofirstorder plot of CH2OO reaction with water vapor at 298K. ... 27
Fig. 15 Pseudofirstorder plot on [H2O] at different temperature. ... 28
Fig. 16 Arrhenius plots of CH2OO reactions with water monomer and water dimer. . ... 30
Fig. 17 Proposed reaction mechanism of CH2OO reaction with water dimer. ... 31
Fig. 18 Potential energy surface of CH2OO reaction with water monomer and water dimer. ... 32
Fig. 19 Observed decay rate of (CH3)2COO under different water concentration. . ... 35
Fig. 20 Typical temporal profiles of (CH3)2COO at 4 temperatures from 283 K to 323 K. ... 41
Fig. 21Comparison of two different kinetic models on (CH3)2COO decay trace at 298 K. ... 44
Fig. 22 Observed decay rate of (CH3)2COO dependence on [(CH3)2COO]0. . ... 45
Fig. 23 Arrhenius plot of (CH3)2COO and (CD3)2COO thermal decomposition rate. ... 46
Fig. 24 Potential energy surface of (CH3)2COO decomposition pathways. ... 47
Fig. 25 Comparison of experimental decomposition rate and calibrated theoretical prediction rate. 48 Fig. 26 Typical time profile of [(CH3)2COO] reaction with [C2H4]. ... 53 Fig. 27 Pseudofirstorder plot of Criegee intermediates reaction with alkenes. ... 54 Fig. 28 Pressure dependence of CH2OO reactions with C2H4 and TME. ... 55
Chapter 1 Introduction
Oxidizing capacity is often used as an indicator of how fast the atmosphere oxidizes chemical species.1,2 Oxidation of unsaturated hydrocarbons has gained considerable attention because it is believed to be one of the hydroxyl radical sources.3 Hydroxyl radical is a strong oxidizing agent in the atmosphere and is mainly formed by a sequential of photochemical reactions involving ozone, sunlight and water vapor.
O3 + h
→ O(1D) + O2O(1D) + H2O → OH + OH
In 2006, Harrison et al4 observed that the concentration of OH radical in U.K. is significantly larger than that predicted by atmospheric modeling, which considered mainly the photochemistry of ozone.In winter time, the UV flux of sunlight drops by a factor of 10 but [OH] decreases only by a factor of 2. This field study indicated that there is a non-photochemical OH radical source in the troposphere. The ozonolysis reaction is one of the main removal pathways of unsaturated hydrocarbon (species with a C=C double bond)and is a possible candidate of non-photochemical OH radical source.
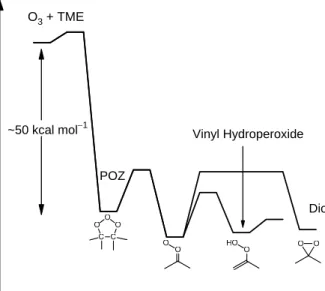
Fig. 1 Reaction mechanism of tatramethyl ethylene (TME) ozonolysis in liquid phase. Primary ozonide (POZ) will decompose into a carbonyl and a carbonyl oxide. These fragments may recombine to form secondary ozonide (SOZ).
The ozonolysis reaction is a synthesis method involving C=C double bond cleavage and formation of two carbonyls in organic chemistry.5 This reaction involves formation of
two five-membered rings (see Fig. 1). The first ring, known as primary ozonide (POZ), is the adduct of ozone and the C=C double bond. This is a very exothermic reaction (Fig.
2);6 the primary ozonide will quickly transform into a the second five-membered ring, called the secondary ozonide (SOZ), which will react with reducing agents to form carbonyls.5 Rudolf Criegee studied the formation of SOZ in different carbonyl solvents and proposed that primary ozonide breaks into a carbonyl and a carbonyl oxide in ozonolysis reaction to explain the formation of SOZ. 7,8 The carbonyl oxide, which is the Criegee intermediate, recombines with the carbonyl due to the cage effect of the solvent.
Fig. 2 Reaction scheme of TME ozonolysis in the gas phase, showing the subsequent decomposition channels of dimethyl Criegee intermediate (acetone oxide). The relative energy is adapted from Ref. 6.
However, the ozonolysis reaction is different in the gas phase. Because there is no solvent to block fragments of POZ, the carbonyl and Criegee intermediate will fly away from each other after fragmentation.Theoretical calculations predicted that Criegee
intermediates with large internal energy can overcome the decomposition barrier and produce OH radical. 6,9 A range of yields for OH radical in various ozonolysis reactions
Dioxirane
Energy
O3 + TME
POZ
Vinyl Hydroperoxide
~50 kcal mol1
are measured by scavenging methods and reported to be 0.17 for ethylene (C2H4), 0.68 for cyclohexene and 0.9 for tetramethylethylene (TME) and under atmospheric
pressure.10,11
In 2001, Kroll et al.12,13 measured the OH yield of ozonolysis of small alkenes with laser induced fluorescence (LIF). Time-dependent measurements13 showed that prompt (within a few milliseconds ) OH yield of TME ozonolysis under 100 Torr is significantly lower than the reported OH yield, but gradually increases to the reported value after a few seconds.Their results suggested that not only the energetic Criegee intermediate but also stabilized Criegee intermediate play a role in the OH formation in the ozonolysis
reaction.
In addition, Criegee intermediate is thought to be an oxidizing agent as strong as OH radical.In 2012, Mauldin et al.14 observed that the concentration of sulfuric acid in a boreal forest in Finland is larger than the modeled value, indicating the existence of an unknown oxidizing agent of sulfur dioxide.
SO2 + OH + O2 → SO3 + HO2
SO3 + (H2O)2 → H2SO4 + H2O
SO2 is mainly oxidized by OH radical in the troposphere; therefore, this field
measurement suggested that this unknown oxidizing agent has a comparable oxidizing ability to OH radical. A further laboratory study showed that this unknown oxidizing agent is only produced when both ozone and plants, the main source of unsaturated hydrocarbons, are present. Criegee intermediate or its derivative is a possible candidate for this unknown oxidizing agent.
Although the Criegee intermediate was proposed in 1949 7, direct observation of the simplest Criegee intermediate (CH2OO) was not achieved until 2008. Taatjes et al.15 used vacuum UV photo-ionization mass spectroscopy (VUV-PIMS) to measure the mass spectra, photoionization efficiency spectra and time behavior of chlorine atom initiated dimethyl sulfoxide oxidation. By comparing the photoionization spectrum with
high-level ab initio calculations, they distinguished CH2OO from its possible isomers.
Unfortunately, the DMSO oxidation system is messy and the yield of CH2OO was too low for further study.
Research of Criegee intermediates exploded when a new synthesis method was reported in 2012. Welz et al.16 successfully prepared a large amount of CH2OO using CH2I2/O2
photolysis. This method involves the reaction between iodomethyl radical and oxygen molecule. For example, CH2I2 + h
→ CH2I + I, CH2I + O2 → CH2OO + I or ICH2OO.This photolysis method has a few advantages. First, this method is quite clean with only two possible byproducts, iodine atom and ICH2OO. Second, the yield of CH2OO is high, from about 0.8 at 20 Torr to 0.3 at 760 Torr. 17 Third, CH2OO doesn’t react with O2; lots of O2 can be used to convert CH2I into CH2OO in a short time (microsecond time scale).
Finally, C2 and C3 Criegee intermediates can be prepared by the same method with corresponding precursors.
This new photolysis method provides a high concentration of Criegee intermediates for directly kinetic and spectroscopic studies. Regarding spectroscopic studies, small Criegee intermediates have been detected by a few methods, including vacuum UV
photoionization mass spectrometry (VUV-PIMS) 16,18,19,UV absorption 20-23 and
depletion 24-28 spectroscopy, infrared (IR) absorption29-32 and action 33-37 spectroscopy and microwave (MW) rotational spectroscopy. 38-41 For kinetic studies, unimolecular
reactions19,34-37,42 and bimolecular reactions with SO2 17-19,43, NO2 17-19, water vapor 44-49, carbonyl50, organic and inorganic acid 51,52, alkenes53,54 and self-reactionof small Criegee intermediates17,19,43,55 have been investigated.
One important experiment should be emphasized. Taatjes et al 18 measured C2 Criegee intermediate by VUV-PIMS and found that two conformers of the Criegee intermediates exist in the photolysis system of CH3CI2/O2. These two conformers of Criegee
intermediates, syn-CH3CHOO and anti-CH3CHOO, differ in the orientation of the C-O-O group and have slightly different ionization energies. Theoretical calculations56 showed
syn-CH
3CHOO is ~3.6 kcal mol1 more stable than anti-CH3CHOO. The interconversion barrier of these two conformers is ~38 kcal mol1, indicating that syn- and anti-CH3CHOO act as distinct species in ambient conditions.
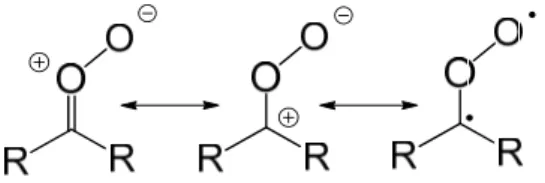
Both experimental and theoretical have indicated that Criegee intermediates have more zwitterionic character rather than biradical character. This means the CO bond of the C-O-O group has significant double bond character; their shorter bond length and larger bond strength have been characterized by MW 38-41 and IR29-32 spectroscopy. A possible resonance structure of Criegee intermediate is shown in Fig. 3.
Fig. 3 Resonance structures of Criegee intermediate.
The reactivity of syn and anti CH3CHOO were investigated separately based on the slightly different ionization energy, 9.33 eV for anti-CH3CHOO and 9.4 eV for
syn-CH
3CHOO.18 Both conformers react rapidly with SO2 with a rate coefficient on 1011 cm3 s1.18 This near-collision-limit rate coefficient is 2 orders of magnitude larger thanpreviously reported values,57 indicating that the Criegee intermediate has the potential to oxidize SO2 in the troposphere.
On the other hand, syn and anti-CH3CHOO show a totally different reactivity toward water vapor. 18,47 Anti-CH3CHOO will react with H2O with a rate coefficient on 1014 cm3 s1,but reaction of syn-CH3CHOO with water vapor is too slow to measure. According to this structure dependent reactivity, Criegee intermediates are separated into two groups:
anti-conformers with a hydrogen atom on the same side of the terminal oxygen and syn-conformers with an alkyl group on the same side of the terminal oxygen rather than
H atom. Symmetric C1 and C3 Criegee intermediates, CH2OO and (CH3)2COO, have received more attention than C2 Criegee intermediates because (i) only one Criegee intermediate will be prepared through this photolysis method, (ii) they have the simplest structures in each group. CH2OO and (CH3)2COO are the representative anti- andsyn-type Criegee intermediates, respectively.
Despite extensive studies of small Criegee intermediates, their atmospheric implication is still unclear. One of the difficulties is that concentrations of Criegee intermediates in the troposphere are unknown. Knowing the effective concentration of Criegee intermediates is necessary for quantifying the impact of Criegee intermediates. Assuming the
steady-state approximation for Criegee intermediates, [CI]ss is estimated by the formation and removal rate.
CI O alkene CI ≅ 0, CI O alkene
≅ O alkene SO H O ⋯
Here, kozo
denotes the rate coefficient for the reaction between O
3 and alkenes,
CI is the yield of stabilized Criegee intermediate in the ozonolysis reaction, and kdecaymeans the
removal rate of CI in the atmosphere. To determine the formation part, kozo and
CI have been measured in the ozonolysis system under ambient conditions.58,59 To determine the decay part, reactions with SO2, NO2, inorganic and organic acid, and water vapor have been investigated. Recently, a few modeling works, 60,61 based on the current knowledge of CH2OO, predicted that the concentration of Criegee intermediate to be on the order of 104 cm3 in the atmosphere. This extremely low concentration would require anextremely sensitive method to detect Criegee intermediate in the atmosphere. Notably, not only CH2OO but also other Criegee intermediates exist in the atmosphere according to the distribution of unsaturated hydrocarbons. Due to the lack of studies on large Criegee intermediates, the influence of Criegee intermediates on the atmosphere is still an open question.
Our group has measured several reactions of small Criegee intermediates by utilizing their strong UV absorption. In this thesis, I focus on reactions involving two
representative Criegee intermediates, CH2OO and (CH3)2COO. The experimental details are described in Chapter 2. We found that the structures of Criegee intermediates affect their reactivity in the reaction with water vapor and the thermal decomposition reaction.
CH2OO reacts with water vapor, primarily with water dimer, but the (CH3)2COO reaction with water is too slow to measure. In contrast, (CH3)2COO isomerizes via fast tunneling in the intramolecular hydrogen transfer reaction, while CH2OO will
decompose slowly due to the lack of -hydrogen. Chapter 3 illustrates the reaction with water vapor and chapter 4 shows the unimolecular decomposition. We also investigated the reactions with C2H4 and (CH3)2C=C(CH3)2. The reaction rate coefficient of CH2OO with C2H4 are determined, while we observed a strange kinetic behavior in the reaction of (CH3)2COO with alkenes. The preliminary results of reactions of Criegee
intermediates with alkenes are shown in Chapter 5.
Chapter 2 Experimental Section
All the experiments were performed on a flow reactor with high intensity broadband Xe lamp for spectra and kinetic measurements. A multipass system was built up to enhance the signal to noise ratio; the effective absorption length was roughly 4 meter. Reactor temperature was controlled by soaking it in a home-made water tank. Two sides of reactor located out of the water tank for probe light to pass through; a copper cover was made to reduced temperature gradient at reactor window. A small stream of dry clean N2 always purged on the inner side of window for avoiding undesired contamination. For
experiment below 15°C, another N2 stream is purged on outside of window to prevent water condensation. For kinetic study, stability of baseline was a crucial issue of data quality. We found vibration and wind were the main factors to influence the stability.
All the gas flows were controlled by well calibrated mass flow controller. We used 1/4”
Teflon tube to connect chemical container of diiodo-precursor and liquid phase
co-reactant to flow reactor. A copper container was made for introducing water vapor into flow reactor. The number density of water vapor was measured by high accuracy
hygrometer. The concentration of diiodo-precursor was checked by UV absorption in another flow cell (precursor cell). 2,2-diiodo propane was synthesized for investigating the thermal decomposition rate of (CH3)2COO. To remove the effect of impurity in precursor, observed decay rate was measured under different precursor concentration. All the experiment detail above will be discussed in this chapter.
2.1
To en (R = prism imag The p exam
Fig. 4 FWHM reflec
Inner size, IR la deter stabi focus was m
Optical S
nhance the a 1 m, Thorla m (Thorlabs ge at radius i prism will r mple for 6 pa
4 Schematic of M of ~0.8 mm ctive light path
r diameter o the maximu aser driven X rmined by th ility point lig s the light in measured b
Setup
absorption s abs, CM750 s, PS609). A
into the sam reflect imag
asses design
f our multipas m and passed t h (2,4,6) are sh
of flow reac um number Xe lamp (En
he focus siz ght source.
nto this mul by a CCD ca
signal, a mu 0-500-F01 o According to me size imag e back with n.
ss system for 6 through the ga hown.
ctor is 18 mm r of path wa
nergetiq, EQ ze of IR lase
An achrom ltipass syste amera (Pixe
ultipass syst or Edmund o the imagin ge but symm h position re
6 paths. Probe ap between the
m; this limi as also limite
Q-99) as lig er, proving i matic lens (f =
em, with ho elfly VGA).
tem was bui 13549) and ng principle metry positio
lative to the
e light was init e two prisms.
its the size o ed by the si ght source; t it as a high
= 100 mm, T orizontal wid
The maxim
ilt up with a d a 5 mm SiO
, spherical m on relative to e prism axis
tially focused The incident l
of prism. Be ze of probe the luminou intensity, go Thorlabs, A dth ~0.8 mm mum numbe
a spherical m O2 right ang mirror will o the mirror s. Fig. 4 show
d into a spot w light path(1,3,
esides the p e light. We u
us area is ood spatial ACA254-100
m (Fig. 4) w er of pass in
mirror gle
focus r axis.
ws an
with ,5) and
rism use an
0-UV) which n our
system was 8, determined by the probe light and prism size. The probe light will go forth and back in the multi-pass system 6 times for measuring the reaction with water vapor or 8 times for measuring the thermal decomposition rate of dimethyl Criegee intermediate.
Since the light intensity will drop ~4 times (36 → 10 mV) from 6 to 8 passes, we suggest 6 passes for future study; in addition, the stability of baseline is slightly improved with shorter path length.
At the exit of multi-pass system, another prism reflected the probe light 90 degree; the probe light will be focused into a iCCD spectrometer (Andor, SR303i & DH320T-18F03) by a parabolic mirror (f = 50 mm) or a balanced photodiode detector (Thorlabs,
PDB450A) with 360 nm band-pass filter (Edmund, 65129) by a SiO2 lens (f = 25 mm).
iCCD spectrometer measured the spectra of photolysis system of diiodo-alkane before balance photodiode did the kinetic measurements. The gain of balanced photodiode was set to 106, which corresponding to ~0.5MHz bandwidth. The schematic optical setup is shown in Fig. 5.
Fig. 5 Band- PO: P
The b 150m The b inten detec mm t digita signa
5 Schematic op -pass filter at 3 Power meter; N
balanced lig mm) and int
balanced lig nsity to the p ctor with tra to improve t al oscillosco altonoise
ptical setup. P 340 nm; BD: B NDF: Neutral
ght was focu troduced int
ght passed t probe light.
anslational s the baseline ope (LeCro e ratio.
PM: Parabolic Balanced phot density filter;
used from t to the balanc through a va The light sp stage (Fig. 6 e stability. S oy, HDO403
mirror; iCCD todiode detect
; LP257: Long
the same Xe ced photodi ariable neut pot size wa 6). We usua Signal from 34), average
D: image-inten tor; HR248: H g-pass filter at
e lamp by an iode by ano tral density as determine ally focused balanced ph ed from 60 t
nsified CCD c Highly reflectiv
t 257 nm. Ada
nother achro ther SiO2 le filter for ba ed by scanni the spot siz hotodiode w to 120 times
camera; BP340 ve mirror at 24 apter from Re
omatic lens ens (f = 150 alancing the ning the bala ze into 0.3 - was recorded
s to enhanc
0:
48 nm;
f. 44.
s (f = 0mm).
e anced
- 0.5 d by a
e the
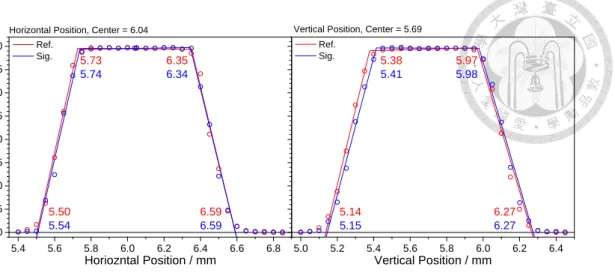
Fig. 6 Results of scanning the horizontal or vertical positions of the balanced photodiode detector. Ref and Sig denote the reference beam (doesn’t pass through the reactor) and the signal beam (go through the reactor) respectively. The active area of the detector is 0.8 mm diameter, thus the light spot size is roughly the width of steep part, about 0.3 mm.
Excimer laser photolysis beam (Coherent, CompExPro 205, KrF 248 nm) was collimated by a cylindrical lens (f =1m) and coupled into the reactor by reflection from two
ultra-steep 257nm long-pass filters. Photolysis beam was terminated by a power meter.
The intensity of photolysis beam was adjusted by rotating an attenuator at the exit of excimer laser. Typical laser energy in our experiment was ~ 220 mJ cm2.
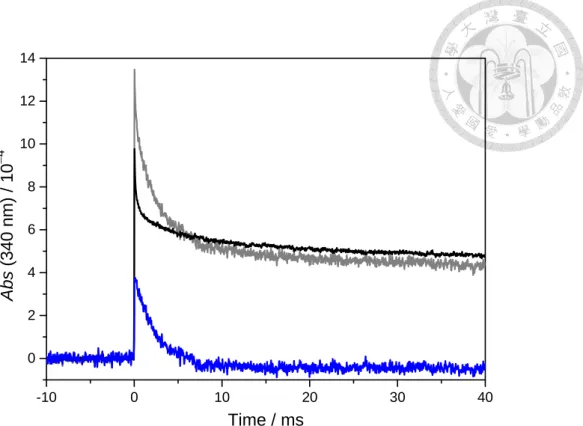
A small time-dependent absorbance changed after photolysis laser beam. This change was independent of humidity, precursor concentration, reflector pressure, etc., but proportional to the photolysis laser power; 2.5 mJ cm2 laser energy cause a maximum absorbance change is ~103. This change was attributed to the used optics and can be removed by doing background subtraction. Fig. 7 showed an example of absorbance profile with and without 2,2-diiodopropane. The real time profile was obtained after the background subtraction in blue. We always did background measurement before and after the signal measurement. Stability of this system was checked by subtraction each background trace to their average.
5.4 5.6 5.8 6.0 6.2 6.4 6.6 6.8
0 5 10 15 20 25 30 35 40
5.0 5.2 5.4 5.6 5.8 6.0 6.2 6.4
6.59 6.59 6.35 6.34 5.73
5.74 Ref.
Sig.
Intensity / mV
Horiozntal Position / mm 5.50
5.54
Horizontal Position, Center = 6.04
6.27 6.27 5.97 5.98 5.38
5.41
5.14 5.15
Vertical Position, Center = 5.69 Ref.
Sig.
Vertical Position / mm
Fig. 7 Typical example showing the absorption background subtraction. Typical background (black line), signal (gray line) time profiles and their difference profile (blue line) are shown. For this (CH3)2COO trace, the photolysis energy is ~ 2.5 mJ cm2, corresponding to the peak value ~103 for the background trace.
Experimental condition are listed below, PN2 = 40 Torr, PO2 = 10 Torr, total flow = 700 sccm.
2.2 Baseline Stability
Baseline stability is very important in kinetics measurement, because the fitting quality is strongly influenced by the shape of the baseline. This is a crucial problem for us because we usually did measurement under low concentration conditions to prevent some
undesired reaction that happens in the photolysis system and also the lifetime of Criegee intermediate is longer such that slow reactions can be studied.
Several sources cause the instability. One factor of baseline jumping is vibration of ground, optical mount and optical table, etc. Construction, walking or instrument operations have been found to contribute to the baseline jumping. Vibration from
-10 0 10 20 30 40
0 2 4 6 8 10 12 14
Abs (340 nm) / 104
Time / ms
instrument, e.g. mechanical pump, is regular with high frequency and its amplitude is usually small; this noise would not affect the fitting too much. Vibrations from
construction and walking are unpredictable. These noises don’t have a specific frequency but with high amplitude; they suddenly appears to destroy the signal and then disappears.
The bending of optical table is slow with medium amplitude and influences the data.
These noises of vibration can be reduced by putting heavy stuffs near optical table and on the optical table. Tight screws of optical mount and air cushion of optical table are also important for improving baseline stability. Although vibration is impossible to entirely eliminated, the amplitude can be greatly reduced. For measuring very small signal or experiment required high stability, doing experiment in the evening is the easiest and most efficiency way to avoid vibration.
The total flow in reactor is also a key factor of baseline jumping. High flow rate tends to cause turbulence in the reactor; alignment of probe light will change due to
inhomogeneity of gas. This noise usually has frequency ranges from 210 Hz with extremely large amplitude. Interestingly, this noise exists only if the total flow rate is larger than a critical flow rate; this can be explained by the positive feedback mechanism of turbulence formation. For our instrument, the critical flow rate is higher than 4000 sccm (4000 sccm is acceptable). This threshold becomes higher when we put a glass rod (D = 2mm) in the reactor. Critical flow rate right now is higher than 6000 sccm (6000 sccm is acceptable). For high pressure experiment set (Ptotal>500 Torr), we will keep 6000 sccm as the highest flow rate to prevent formation of turbulence; the refresh time is longer, thus repetition rate of photolysis laser is slower.
The wind in the laboratory can really make the stability worse. It has frequency ranges from 1-100 Hz with medium amplitude. This noise appeared with a constant time interval
during a day in summer. Finally, we realized that the temperature of wind from air conditioner is colder than the room temperature and blew down to the optical table in summer. This effect can be proved by fanning directly to the optical table on purpose. In the end, we covered almost all the light path with plastic glass plate (thickness = 4 mm) to block the wind.
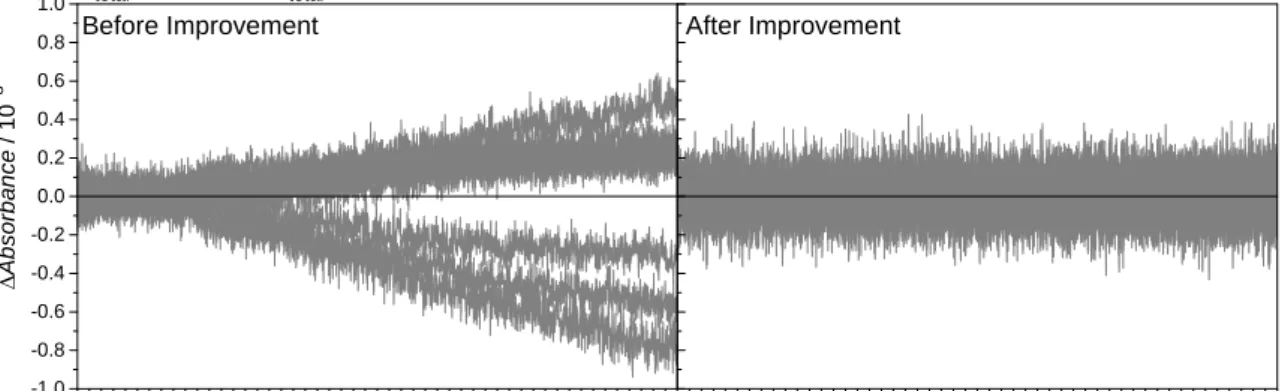
Fig. 8 Typical baseline check showing the stability before and after improvement. Both graphs have 9 repeated traces. We subtracted the average of each background set to show the stability. Baseline stability is improved by adding the plastic glass cover, glass rod and heavy metal on the optical table.
The improvement of baseline jumping is shown in Fig. 8. Notably, there is a small vibration with period ca. 50 s; this vibration comes from intensity oscillation of Xenon lamp and the imperfect balanced AC signal of detector.
2.3 Water Vapor in the Reactor
Temperature in the reactor was controlled by immersed the reactor into a plastic glass water tank, which connects to a temperature-controlled water circulator (Yih Der BL730, stability ±0.1 K). Three resistance temperature devices were putted in glass well near the center and two ends of the reactor. The gas temperature in the reactor was calibrated
-10 -5 0 5 10 15 20 25 30 35 40
-1.0 -0.8 -0.6 -0.4 -0.2 0.0 0.2 0.4 0.6 0.8 1.0
After Improvement
Absorbance / 103
Time / ms Before Improvement
-5 0 5 10 15 20 25 30 35 40
Ptotal = 500 Torr, Ftotal = 8000 sccm
Time / ms
against the RTD readings with a Rotronic temperature and humidity sensor (Rotronic, HC2S; 0.10.2 K temperature accuracy; 0.8% relative humidity accuracy at 298 K, 1.3%
at 273 K and 313 K, 1.8% at 333 K). This calibration was done before the experiment and Rotronic sensor was removed during the experiment.
A ~120cm long copper tube is immersed in the same water tank for temperature equilibrium of gas. Before the entrance of reactor, a Rotronic sensor was putted in a cooper can for monitoring the humidity level of gas and then the measured gas mixes with precursor flow. This dilution effect was calibrated by comparing the reading of another Rotronic sensor in the reactor with the one in the copper can. All humidity sensors were calibrated by saturated salt solution;the whole calibrating device was immersed in a temperature-controlled water tank (JunYang, Y-K-BH-B, stability ±0.1 K).
Except a downstream water tank for controlling reaction temperature, an upstream water tank is used for keeping the temperature of water copper container stable; thus, the water vapor can be blown out safely. Deionized water (18MΩ) is putted in the copper container.
Dry N2 blew over the water surface to conduct water vapor in the reactor; a stir bar is putted in the copper container to make the water temperature homogeneous. The relative humidity (RH) is adjusted by mixing this wet flow with another dry N2 flow.
We cared the temperature of water vapor because saturation vapor of water strongly depends on temperature; it roughly changes 7%/°C at 298 K. The main uncertainty in water concentration, denoted εH2O, is estimated with the formula below.
Where εmix is the error of mixing with precursor flow, εRetronic is the error of humidity sensor and εT is the error of temperature. εmix is usually small compared with the other
error. The inhomogeneous of temperature in the reactor, which derived from the 3 RTD in the glass well, is typically 0.1 °C. The error of [(H2O)2], εH2O2, most attributed to the error of [H2O] and the reported error of equilibrium constant of water dimerization; it ranges from 2.9% at 325 K to 3.3% at 285 K. 62 Therefore, εH2O2 is estimated by the following equation. εKeq denotes the error of water dimerization equilibrium constant.
2
2.4 Precursor in the Reactor
All gas flow was controlled by calibrated mass flow controller, MFC, (Brooks, 5850E or 5800E). For calibration, MFC was connected to a stainless cylinder, its volume was measured by the weight difference with and without filling water. A pressure gauge (Inficon, CDG025D) was connected to this system. The true volume of the setup was derived from the pressure decrease of stainless cylinder due to the extra volume of tube and gauge. The temporal profile of MFC reading and pressure are measured by a DAQ device (MC, USB-1608GX), which was controlled by LabVIEW. The real flow can be calculated by ideal gas law and calibrated the baseline of MFC. Typical error of a well calibrated MFC is smaller than absolute 0.4%. If the baseline value is not well measured, we assumed that this error is smaller than absolute 1%, which is claimed by the company.
Baseline of MFC is important because it may differ to absolute 2%, which is a factor of 2 large than the manual value.
The container of precursor was covered by black cloth, otherwise diiodoalkane well quickly decompose under daylight lamp. The color of diiodoalkane will turn into red
from slight yellow under daylight lamp for 8 hour. A small dry N2 flow blew precursor out of container and the container was slightly heated for precursor stability in the reactor.
The concentration of diiodoalkane was measured by another set of UV spectroscopy. A 296 nm LED (UVTOP295TO39HS) was used as light source because diiodoalkanes have strong UV absorption there. LED is controlled by IC LM317 which drives LED in constant voltage mode. The stability of LED (±0.2% after 3 hour) was pretty good. The UV light passed through a flow cell (L = 75.34 cm) and was focused into a small spectrometer (Ocean Optics, UPS2000+ or Mata2000Pre).
Because diioalkane was a sticky species, the concentration of precursor will be stable until it contained on all rube wall before mixing with other flow. It required roughly 1 hour for equilibrium of diiodoalkane with tube wall. We usually flew precursor at least 1 hour before experiment. Oxygen flow was blow into the MFC of precursor; this clean O2
flow can clean the gas line before taking background trace. In typical kinetics measurement, we can changes the concentration of precursor in the reactor from 0.1 mTorr to 10 mTorr.
2.5 Synthesis of 2,2-diiodopropane
The synthesis route of (CH3)2CI2 involves carbonyl, hydrazine and iodine. 63 In detail, acetone (TEDIA, 99.98%) was added slowly to hydrazinemonohydrate (Wako, 97%) with a syringes while stirring vigorously. A boiling water bath was used for controlling the reaction temperature. The reaction time was at least 1 hour under reflux. Acetone hydrazone was extracted with dichloromethane (ACROS, 99.9%).
Saturated solution of iodine in ethyl ether (ALPS, 99.5%) was added at room temperature into a mixture consisting of acetone hydrazone, ether and triethylamine (Alfa Aesar, 99%) under dark condition. The reaction can be monitored by the existence of nitrogen gas and present of iodine color. The amount of I2 is usually 2 times the equivalent. After the completion, the solution is diluted 20 times by adding ethyl ether. Then 5% Na2S2O3(aq) and 3M HCl(aq) are subsequently added to quench iodine and triethylamine. (CH3)2CI2 is obtained by further washing the organic-phase solution with saturated NaCl(aq), drying and removal of solvent.
The structure and purity of (CH3)2CI2 were checked with H-NMR spectroscopy (3.00 ppm (6H, s, Me) in CDCl3). Minor amounts of acetone and 2-iodopropene were also found on the NMR spectrum. The purity of (CH3)2CI2 was estimated to be better than 85%. During the usage of (CH3)2CI2, its purity became higher with time, possibly because the impurities have lower boiling points and was easily blew out.
The synthesis route of (CD3)2CI2 was the same as (CH3)2CI2 while using deuterated acetone, CD3COCD3, as the reactant. (CD3)2CI2 has no H atom and will not exist on the H-NMR spectrum. We checked (CD3)2CI2 by comparing the mass spectrum with
(CH3)2CI2; both mass spectra were took by Residual Gas Analyzer (SRS, RGA300) (see Fig. 9).
Fig. 9 Mass spectra of synthesized 2,2-diiodopropane and deuterated 2,2-diiodopropane. Possible fragment ions of I+, HI+ and DI+, etc. are observed. The medium intensity signal at m/z = 172 is probably C3D4HI+, which may come from the impurity of d6-acetone. Although there was some impurity in the precursor sample of (CD3)2CI2, we still observed a slow thermal decomposition rate of (CD3)2COO.
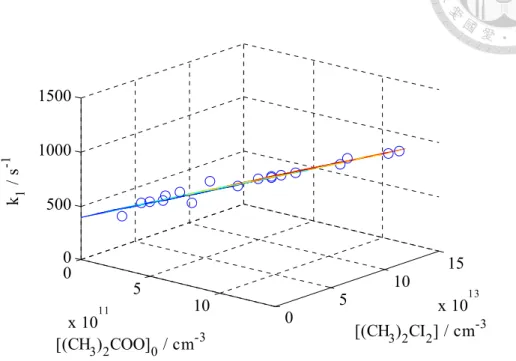
Since the purity of synthesized precursor was not very high, the effect of impurity was checked by measuring the decay rate under different precursor concentration. The initial concentration of Criegee intermediate can be kept the same while changing the photolysis laser power for compensation.
For bimolecular reaction measurement, there was no effect from the impurity. The most possible impurity was I2; there was no report that I2 or I atom will react with SO2 and H2O.
For unimolecular reaction measurement, the observed decay rate has weak dependence on [precursor]. It is interesting that we observed a negative dependence on [precursor] for (CH3)2CI2 but a positive dependence for (CD3)2CI2 while keep the same initial Criegee concentration. This dependence was attributed to that the impurity was different in two precursors. Thus, some impurity was reactive to Criegee intermediate while the other was reactive to other radicals. To obtain the first order rate, we did 2-D linear regression on
110 120 130 140 150 160 170 180 190 0
50 100 150 200
DI+
C3H5I+ C3D5I+
C3H6I+
HI+
Intensity
m/z (CH3)2CI2
(CD3)2CI2 I+
initial Criegee concentration and precursor concentration to remove the effect of impurity.
Fig. 10 shows one example of this 2-D fitting.
Fig. 10 Three dimensional plot for 2D fitting to extract the first order decay rate at the zero concentration limit. In this graph, k1 equals to the observed decay rate. Adapted from Ref. 42.
2.6 Photolysis system of CH
2I
2and (CH
3)
2CI
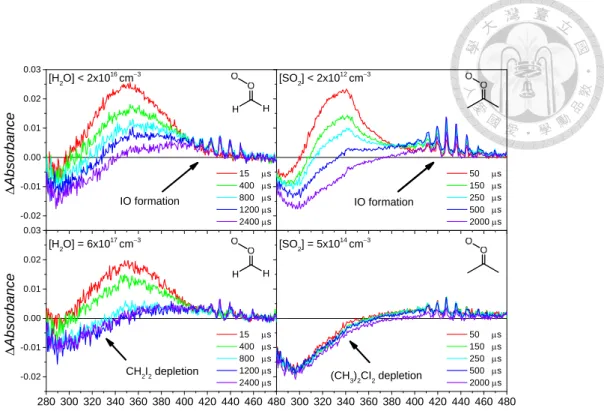
2Transient spectra of O2/diiodoalkan system were measured by iCCD at different laser delay time before we did kinetic measurement by balanced photodiode; thus, we can determine the detection window of Criegee intermediate that has minimum influence by other species. Fig. 11 shows typical transient spectra of CH2I2 and (CH3)2CI2 photolysis system.
0 5
x 1011 10 0 5 10 15
x 1013 0
500 1000 1500
[(CH3)2CI2] / cm-3 [(CH3)2COO]0 / cm-3
k 1 / s-1
Fig. 11 Typical transient spectra of CH2I2 and (CH3)2CI2 photolysis systems. Adding water vapor or SO2 to the systems scavenges CH2OO or (CH3)2COO, respectively, resulting decay of the absorbance signals (280-400 nm). An obvious IO signal was observed at long reaction time. When SO2 was present, Criegee intermediate is removed very fast, showing the depletion the signal of precursor signal is constant at various reaction times. Replotting the figure from Ref 44 and 48.
It is clear that the spectra of CH2OO and (CH3)2COO was not affected by adding water vapor and SO2 in the system. We found that there are three species contributed to the resulted spectra, including depletion of precursor, Criegee intermediate itself and byproduct IO. Depletion of diiodoalkane was a time-independent signal. On the other hand, IO grows up with the reaction time. Contribution of IO cannot be ignored above 360 nm. We determined to detect Criegee intermediate at 340 nm because the
time-dependent IO signal was negligible (
IO = 1.3 x10¹⁹ at 340 nm) and the depletion signal of diiodopropane was easy to treat.-0.02 -0.01 0.00 0.01 0.02 0.03
280 300 320 340 360 380 400 420 440 460 480 -0.02
-0.01 0.00 0.01 0.02 0.03
300 320 340 360 380 400 420 440 460 480 IO formation
15 s 400 s 800 s 1200 s 2400 s
Absorbance
[H2O] < 2x1016 cm3
IO formation
[SO2] < 2x1012 cm3
50 s 150 s 250 s 500 s 2000 s
CH2I2 depletion [H2O] = 6x1017 cm3
15 s 400 s 800 s 1200 s 2400 s
Absorbance
Wavelength / nm
(CH3)2CI2 depletion [SO2] = 5x1014 cm3
50 s 150 s 250 s 500 s 2000 s
Wavelength / nm
Fig. 12 Absolute cross section of important species in diiodoalkane/O2 photolysis system. The detection widow near 340nm is marked by two black dashed lines. The contribution of IO was negligible in this detection window. Absolute cross section of diiodoalkane should be positive; we plot it in negative sign for comparison with the transient spectra.22,24,64
Since the spectrum of IO and diiodoalkane was available64, we can remove the
contribution of IO and depletion of precursor to get the UV absorption spectrum of small Criegee intermediates. The absolute spectra of common molecule in diiodoalkane system are shown in Fig. 12.
The absolute cross section of small Criegee intermediate was measured by UV depletion method in our group. One of the advantages of UV absorption measurement is that absolute cross section is usually available; thus, the concentration of CH2OO or (CH3)2COO can be determined by Beer-Lambert law. For our instrument, because the window was protected by purge flow, the effective light length was calibrated by comparing the absorption of precursor in the reflector to the absorption in the precursor cell.
280 300 320 340 360 380 400 420 440 460 480 -0.5
0.0 0.5 1.0 1.5
2.0 CH2I2
(CH3)2CI2
Absolute Cross Secti on / 10
17cm
2Wavelength / nm
CH2OO (CH3)2COO IO
0.5IO
Chapter 3 Reaction with Water Vapor
Water vapor is the third abundant species in Earth’s atmosphere and plays important role in atmospheric chemistry. One famous example, involving water vapor, is the sequential photochemistry of ozone to produce OH radical. In addition, a few studies also showed the oxidizing ability of some radical, such as O3, HO2, and OH, increases when water is present.65,66 The impact of a slow reaction with water vapor is still huge because of the vast amount of water vapor in the atmosphere.
Before the new preparation method of Criegee intermediates was reported 16, studies of Criegee intermediate reaction with water were mostly based on monitoring the product ratio in an ozonolysis system at various humidity levels;67-75 thus, the ratio of relative reaction rate coefficient, e.g. reaction coefficient with water to that with SO2 or unimolecular decomposition, was determined.
In ethylene ozonolysis system, Atkinson et al.67 reviewed several ozonolysis studies and deduced a ratio of k(CH2OO+H2O)/k(CH2OO+SO2) = 5.7x10⁵. Suto et al.73, who monitored the light scattering by particle, and Becker et al.72, who measured the
formation of H2O2, determined the relative reaction coefficients ratio with water and SO2
to be 2.3x10⁴ and 8.3x10⁴, respectively. Recently, Berndt et al.75, repeated the same measurement but detected H2SO4 with mass spectroscopy; they found that the yield of H2SO4 decreased when water was present and the extra loss rate, kloss, showed a quadratic dependence on [H2O].
, ≅ H O
A few group studied the reaction of CH2OO with water vapor either by direct or indirect measurement with the new photolysis method to prepare CH OO. Welz et al.16 directly
measured the decay of CH2OO by VUV-PIMS in the photolysis system of CH2I2/O2/H2O.
They failed to observe the reaction with water vapor and gave an upper limit of
k
H2O<4x1015 cm3 s1. Stone et al. 76and Ouyang et al.77 prepared CH2OO with the photolysis method and monitored the formation of product.Stone et al.76 used laser-induced fluorescence technique to monitor CH2O, which is thought to be the main product of most CH2OO reaction. They did experiments at 200 Torr and had [H2O] up to1.7x1017 cm3 (5 Torr at 298 K). Experimental results showed that formation rate of CH2O remained the same when water was present; they gave an upper limit of kH2O< 9x1017 cm3 s1.
Ouyang et al.77 investigated this reaction with an approach similar to ozonolysis study.
CH2OO was prepared by the photolysis method; they monitored the formation of NO3
when both NO2 and H2O were present. They varied [H2O] up to 22 Torr and deduced a rate coefficient of CH2OO with H2O, kH2O = 2.5x1017 cm3 s1, by taking kCH2OO+NO2 = 7x1012 cm3 s1.
C2 Criegee intermediates were also investigated in the diiodoalkan photolysis system
18,47 or the ozonolysis system.74 Berndt et al.74 studied the effect of water vapor on H2SO4
formation in the 2-butene ozonolyssis system, which produces CH3CHOO. Water vapor decreased the yield of H2SO4. Unfortunately, they could not give a solid conclusion because of the complexity of CH3CHOO, including syn- and anti-conformers. A five parameters analysis gave an effective rate ratio for reaction of CH3CHOO with water to SO2 =1.4x10⁴, but the authors believed this data was over interpreted.
On the other hand, Taatjes et al 18 directly measured the decay of CH3CHOO by
VUV-PIMS, which can separate the contribution of two conformers due to the difference in ionization energy. This study showed that syn-CH3CHOO doesn’t react with water
vapor with kH2O< 2x1016 cm3 s1; in contrast, anti-CH3CHOO reacts rapidly with water vapor with kH2O = 1x1014 cm3 s1.
An interesting discrepancy was shown; most studies on the ozonolysis system72-75 agreed that CH2OO reacts with water while researches using the photolysis method 16,76,77 failed to measure this reaction. Our group directly measured the time profile of CH2OO with UV absorption spectroscopyunder a wide range of pressure (100-760 Torr) and temperature (283-358 K). 44-46
Fig. 13 Representative time profile of CH2OO band under different humidity level at 298 K. Single exponential decay function is fitted to these traces and plotted in gray line. For this experiment set, Ptotal = 250 Torr, PO2 = 10 Torr, PCH2I2 = 6.7 mTorr and photolysis laser energy = 9.7 mJ cm2. Replotting from Ref.
44.
Fig. 13 shows typical decay traces of CH2OO at different humidity level within 335-345 nm. 44 The decay rate of CH2OO is faster at high humidity level. Within our detection window, not only the absorption of CH2OO but also the absorption of CH2I2 was observed.
-500 0 500 1000 1500 2000 2500 3000
-0.002 0.000 0.002 0.004 0.006 0.008 0.010 0.012
0.014 RH < 3%
RH = 21%
RH = 42%
RH = 63%
RH = 83%
Abs . (340 nm)
Delay Time / s
The negative baseline at long time (>3ms) was attributed to the depletion of CH2I2. Because the photolysis of CH2I2 is in picosecond time scale and the refreshed time of gas is about 1 second. We treated the kinetic behavior CH2I2 depletion as a step function; thus, a constant term was introduced with the single exponential decay function, A0e-kobs + B0. The highest [CH2OO] in our experiment was about 3x1012 cm3, which was far lower than [H2O] (>1x1016 cm3). The observed decay rate without water vapor is caused by reaction with byproducts (mostly react with iodine atom). The observed decay rate without water vapor, denoted as k0, was subtracted from each set of experiment in the
pseudofirstorder plot.
Fig. 14 Pseudofirstorder plot of CH2OO reaction with water vapor at 298K. Left panel shows results against water monomer concentration and right panel shows results against water dimer concentration.
There is no pressure dependence in the pressure range of 100-500 Torr. A linear function is fitted to the whole data for right panel. Replotting the graph from Ref. 44.
Fig. 14 shows the dependence of the pseudofirstorder decay rate on [H2O] under different pressure at 298K. The observed decay rate has a quadratic dependency on [H2O], indicating that two water molecules participate in this reaction. We also plotted the observed decay rate against water dimer concentration in the right panel; the effective
0 1 2 3 4 5 6 7 8
0 1000 2000 3000 4000 5000 6000 7000 8000
0 2 4 6 8 10 12
1.4x1032 ([H2O]/cm3)2 Exp #1 500 Torr
Exp #2 500 Torr Exp #3 250 Torr Exp #4 250 Torr Exp #5 100 Torr Exp #6 100 Torr Exp #7 250 Torr Exp #8 250 Torr Exp #9 250 Torr Exp #10 250 Torr 1.4x1032 [H2O]2
(kobs - k0) / s1
[H2O] / 1017 cm3
6.5x10¹² ([(H2O)2]/cm3) Exp #1 500 Torr
Exp #2 500 Torr Exp #3 250 Torr Exp #4 250 Torr Exp #5 100 Torr Exp #6 100 Torr Exp #7 250 Torr Exp #8 250 Torr Exp #9 250 Torr Exp #10 250 Torr
[(H2O)2] / 1014 cm3
reaction rate coefficient with water dimer was determined to be k(H2O)2 = 6.5x1012 cm3 s1 at 298K.
The quadratic dependence explained why Welz et al.16 could not observe this reaction.
Although mass spectroscopy has high sensitivity, it is hard to build a high pressure reactor and couple it to high vacuum (<104 Torr). The small total pressure of their experiments (~4 Torr) limited [H2O] in the reactor. The highest [H2O] in the VUV-PIMS
measurement16 was [H2O] = 3x1016 cm3, resulting in a low water dimer concentration, [(H2O)2] = 2x1012 cm3, and a small effective decay rate, keff =13 s1, which is far below their detection limit.
To understand the reaction mechanism and implication of atmosphere (the average temperature on Earth is about 15°C), we studied the decay rate of CH2OO at different temperature.45,46 The pseudofirstorder plot in the temperature tange 283-353K is shown in Fig. 15.
Fig. 15 Pseudofirstorder plot on [H2O] at different temperature. Left panel shows the quadratic behavior becomes less pronounced at temperature. Right panel shows a second order polynomial fit for the data at 358 K. Adapted from Ref 45 and 46.
0 2 4 6 8 10 12 14
-1 0 1 2 3 4 5 6 7
0 1 2 3 4 5 6 7 8 9 10 11
0 200 400 600 800 1000 1200 1400 1600
358 K (kobs-k0) / (103 s
1)
[H2O] / 1017 cm3 283 K
298 K
311 K 324 K
349 K
Polynomial Fit Linear part Quadratic part
(kobs-k0) / s1
[H2O] / 1017cm3 Exp. #2a
Exp. #2b Exp. #2c