Polarization tuning the Stokes photoluminescence spectra of erbium doped
KNbO
3ceramics
Sheng-Yuan Chua)and Cheng-Hung Wen
Department of Electrical Engineering, National Cheng Kung University, Tainan, Taiwan 701, Republic of China
Sing-Long Tyan and Yuu-Ging Lin
Department of Physics, National Cheng Kung University, Tainan, Taiwan 701, Republic of China
Yung-Der Juang
Department of Natural Science Education, National Tainan Teachers College, Tainan, Taiwan 701, Republic of China
Cheng-Kuo Wen
Institute of Microelectronics, National Cheng Kung University, Tainan, Taiwan 701, Republic of China (Received 1 December 2003; accepted 28 May 2004)
The poling effect in Stokes photoluminescence (PL) spectroscopy of erbium doped potassium niobate共KNbO3兲 ceramics has been investigated by studying the relations between PL spectra with
the poling electric field, poling time, and annealing conditions, respectively. All the Stark splitting components of 4S3/2→4I13/2transition were evident after the poling process. The experiments also
showed that the polarization enhances the fine structure and modifies the intensity ratio of the
4S
3/2→4I15/2,4F9/2→4I15/2, and4S3/2→4I15/2transitions at different poling electric fields and poling
times for the samples doped with 5% of erbium. Comparing the poling spectra with annealing spectra, we can see that both polarization and annealing can modify the intensity of PL. However, the mechanisms of the two effects are different. The frequency shift⌬ of the peaks depended on the wavelength after poling demonstrates that the Stark splitting was produced by the dipole moment of erbium ions interacting with the internal local electric field due to polarization. © 2004
American Institute of Physics.[DOI: 10.1063/1.1774261]
I. INTRODUCTION
Erbium doped materials have attracted interest in recent years for its unique optoelectronic properties and potentiality, such as laser material, 1.5m infrared amplifiers of great use in optic communications, and infrared to visible upconvertors.1–4As erbium was incorporated as an impurity into a dielectric host, erbium usually takes the trivalent charge state. The ground state of the erbium ion with elec-tronic configuration关Xe兴4f11is shielded from the outer ma-trix by two closed 5s and 5p shells.5The 4f electrons interact by spin-spin and spin-orbit interaction. As doped in a solid, the 16-fold degeneracy of the atomic state is partially lifted by crystal fields of ligand atoms and doublet levels. As a result, rather sharp optical 4f transitions can be achieved from erbium doped materials. Moreover, due to its unique electronic properties, erbium is an interesting probe for a large variety of physical effects.6
Potassium niobate(KNbO3, denoted by KN) is a
ferro-electric material having high electro-optic and nonlinear op-tical coefficients. This material attracts great interest for its multiple applications, such as optical waveguides, frequency doublers, and holographic storage systems.7–9However, few research groups investigated the polarization effect in the optical properties of erbium doped KNbO3 polycrystalline.
Therefore, in this study, an attempt is made to systematize the poling and annealing effect in the luminescence proper-ties of the erbium doped KNbO3ceramics.
II. EXPERIMENTS
Erbium doped KNbO3 ceramics were prepared by
ce-ramic solid-state reaction synthesized method.10 Raw mate-rials used to grow samples were 99.99% pure K2CO3,
Nb2O5, and Er2O5powders. These powders with correct
pro-portional amounts of materials were ball milled for 12 h, baked at 120° C, and calcinated at 760° C for 4 h to form Er3+:KNbO3 powders. The concentration range of erbium CEr was 5 mol% and the sintering temperature Ts was
1020° C. The crystal structure of the samples was examined by x-ray diffraction(XRD) (Cu target with working voltage 30 kV, a current of 20 mA, and 4 ° / min scan speed from 10° to 70° 2 in 0.002° increments) and scanning electron mi-croscopy (SEM). For poling treatment, silver slurry was pasted on the sample’s surface and the sample was baked at 120° C for 10 min. The samples with thickness of 1 mm were polarized in silicon oil at 150° C for 10– 60 min under 0.5⬃1.5 kV dc voltage. The room temperature micro-Raman and photoluminescence spectroscopy were measured by excitation source at 514.5 nm argon ion laser and signal were recorded by a Triax 550 monochromator equipped with an air-cooled charge-coupled device.
a)Author to whom correspondence should be addressed; FAX: ⫹886-6-2345482; Electronic mail: [email protected]
JOURNAL OF APPLIED PHYSICS VOLUME 96, NUMBER 5 1 SEPTEMBER 2004
0021-8979/2004/96(5)/2552/4/$22.00 2552 © 2004 American Institute of Physics
III. RESULTS AND DISCUSSIONS
All ceramic samples obtained were white with no sign of deficiency, which would be manifested by a blue color.11The XRD patterns for Er3+doped KNbO
3ceramics with different
poling fields did not show difference obviously. Major peaks were consistent with JCPDS No. 32-0822. these results showed that first, all samples belong to the orthorhombic structure; second, poling treatment did not modify the sam-ple’s structure; third, there were no erbium clusters 共Er2O3兲
in these samples. If there were some erbium clusters in these samples, the XRD patterns should show the strongest diffrac-tion peak of Er2O3 at about 29.05° (JCPDS No. 77-0464).
The SEM images of these samples showed the grain sizes of the samples were about 1 – 2m. For the samples doped with 5% of erbium, the rectangular crystal growth habit was found. This phenomenon is similar to the Sm and Sn doped KNbO3system.
12
In Fig. 1, the room temperature micro-Raman spectra with different poling times of erbium doped KNbO3
ceram-ics were compared with the spectra of unpolarized sample. In order to understand the effect of silicon oil residue on the Raman spectra, the unpolarized sample was also soaked in silicon oil just like the polarized samples, then using the ultrasonic cleaner to clean the silicon oil. The spectra of unpolarized samples just like conventional erbium doped KNbO3 ceramics having two broad and strong phonon
en-ergy, appearing at 319 and 600 cm−1 should belong to
A1共TO兲 mode. However, the spectra exhibited continuous
changes while the poling time increased. There were some phonon peaks appearing gradually at about 353, 377, 391, 407, 421, 529, 667, and 720 cm−1, as the samples were
po-larized and the intensity of the peaks increased as the poling time was increased. These Raman spectra peaks had not been discovered in the KNbO3 crystalline before.
13–15
We
sup-posed these anomalous peaks were caused by the following two reasons:(1) the vibrational Stark effect, which the crys-tal’s vibrational modes changed by polarization or (2) the
2H
11/2→4I15/2 hypersensitive transition 共⌬J=2兲 of the Er3+
ions instead of Raman shift. In order to recognize these anomalous peaks, the micro-Raman spectrum was generated with 632.8 nm He-Ne laser that could not excite the Er3+
ions into 2H11/2level; however, the spectra also reveal these
anomalous peaks, indicating that these peaks should be due to phonon modes. Furthermore, according to the spectra as a function of sample temperature, these anomalous peaks de-creased drastically at low temperature, indicating that these peaks should be due to phonon modes.
The room temperature photoluminescence(PL) spectra excited at 514.5 nm in the range 520– 870 nm was measured with different poling fields, respectively. The spectra exhib-ited three distinct emission bands. Green emission was ob-served between 520 and 570 nm corresponding to the 共2H
11/2,4S3/2兲→4I15/2transition, red emission was observed
between 640 and 670 nm corresponding to the
4F
9/2→4I15/2transition, and the near infrared emission was
observed about at 840– 870 nm corresponding to the
4S
3/2→4I13/2transition.
The luminescence spectra in the range 520– 570 nm with four different polarized times were shown in Fig. 2. The poling electric fields were fixed at 10 kV/ cm. From this fig-ure, we could see that the polarization led to the change in peak intensity as well as in spectral shape. For example, the polarized samples have the peak in wavelength at about FIG. 1. The room temperature micro-Raman spectra with different poling
time of erbium doped KNbO3ceramics.
FIG. 2. The room temperature PL spectra in the range 520– 570 nm mea-sured with different poling times.
J. Appl. Phys., Vol. 96, No. 5, 1 September 2004 Chuet al. 2553
555 nm but it is absent for the unpolarized sample. All these peaks of the luminescence spectra in the range 540– 570 nm originated in the transition from the two components of the
4S
3/2level to the eight Stark components of the4I15/2ground
state. These peaks, for the most part, showed a slight blue-shift after polarization(as shown in the inset of Fig. 2). This behavior was different from the porous silicon systems.16,17 Nevertheless, it should be noticed that in our study the elec-tric field is not externally applied but internal in the sample. In the past, similar research was few, in Refs. 18–20, the splitting of R line in the fluorescence spectrum of lithium heptagermanate Li2Ge7O15 doped with Cr3+ induced by the
ferroelectric phase transition was found at low temperature. From these observations, it was evident that the polarization produced the electric field at the Er3+ site, acted on the elec-tric dipole moment of the erbium ions, and caused the energy level splitting. Therefore, the PL spectra showed these split-ting peaks of the fine structure of the Er3+ ions, energy lev-els. This phenomenon should be a part of Stark effect; there-fore, as the poling time increased, the internal electric field increased and spilt the peaks gradually.
From the viewpoint of classical physics, in an external electric field E, the frequency shift of the optical transitions can be roughly approximated as
⌬v = d · E, 共1兲
where d is the dipole moment of state; however, in this paper E should be considered as the internal local electric field due to polarization. In a piezoelectric material the total macro-scopic polarization can be written as Ptotal= PPZ+ PSP, where PPZ is the piezoelectric polarization and PSPis the material
built-in spontaneous polarization. In this research, the sample was unstrained so the local field at Er3+ site in the sample completely came from the surrounding spontaneous polariza-tion. The frequency shift ⌬ of the peaks depended on the wavelength of the spectra (as shown in the inset of Fig. 2). The peaks for the most part exhibited a slight blueshift, but some peaks were not exactly shifted. It was probably because the angle between the dipole moment of erbium ion 4f en-ergy levels and internal electric field was different. The elec-tric field induced at the Er3+site directed along the polar axis of the ferroelectric crystal. If the angle is an acute angle, as the angle increases, the energy level split decreases; so the frequency shift consequently decreases, referred to as in Eq. (1). As the dipole moments were perpendicular to the inter-nal electric field, the frequency shift fell away. Therefore, the ⌬ varied with the dipole moment components along the ferroelectric axis of the crystal, as electrons transferred from the Er3+ upper excited state to the lower state.
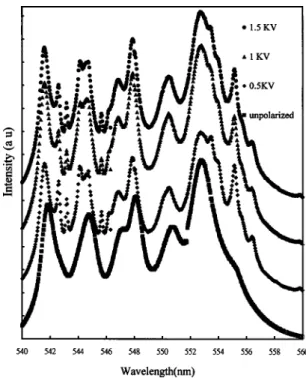
The luminescence spectra in the range 540– 560 nm with four different polarized intensities were shown in Fig. 3. The poling times were fixed at 10 min. From this figure, we could also see that the polarization leads to a change in peak inten-sity as well as in spectral shape. The peaks also showed blueshift gradually with an increase in the intensity as the poling field increased. The frequency shift was saturated as
the poling field went up to 10 kV/ cm. It is evident that the orientation of dipole moment of the host is orderly as the poling field gets up to 10 kV/ cm.
Comparing poling spectra with the annealing spectra, we found that both polarization and annealing can modify the intensity of PL. However, the mechanisms of two effects upon the samples were different. The ligand field of erbium ions could be investigated using the Judd-Ofelt theory.21,22 According to this theory the transition probabilities are dominated by the reduced matrix elements of unit tensor operators 具U共t兲典2共t=2,4,6兲 for the corresponding transition
and three intensity parameters ⍀t 共t=2,4,6兲. The wave-length 526 and 542 nm transition intensity depends on the ⍀2 and⍀6, respectively.
23
It was known that increasing the symmetry between the rare earth ions and ligand field would decrease the⍀2parameter, as the covalence between the rare
earth ions and the hosts decreased, the⍀6would increase. 24
Table I showed the annealing temperature and poling condi-tions dependence of the PL relative intensity ratio of 541 and 526 nm peaks. After annealing, the relative intensity ratio of 541 and 526 nm peaks decreased gradually which meant a decrease of the symmetry of ligand field and an increase of covalence. However, the ratios vary irregularly after poling and represent that polarization cannot change regularly the FIG. 3. The room temperature luminescence spectra in the range of 540– 558 nm with four different polarized fields.
TABLE I. The PL relative intensity ratio of 541 and 526 nm peaks at dif-ferent treatment conditions.
Annealing temperature Un-annealed 400 500 600 700 共°C兲
I541/ I526 4.88 4.41 4.37 4.23 3.53
Poling time Unpolarized 10 30 60 共min兲
I541/ I526 4.88 4.89 3.75 4.03
Poling field Unpolarized 5 10 15 共kV/cm兲
I541/ I526 4.88 4.69 3.89 4.87
2554 J. Appl. Phys., Vol. 96, No. 5, 1 September 2004 Chuet al.
symmetry of erbium ion’s surrounding ligand field and the covalence with the host. We also compare the intensity ratio of three emission transitions (green/red and red/near infra-red); it showed that polarization enhanced the intensity ratio of red/infrared but mitigated the intensity ratio of green /red. The reduced matrix elements of unit tensor operators 具4S
3/2储U共4兲储4I15/2典2 and 具4S3/2储U共4兲储4I13/2典2 were zero, while
具4F
9/2储U共4兲储4I15/2典2was large. Thus, it was concluded that the
polarization increased the⍀4 intensity parameter; therefore,
the intensity ratio of red/near infrared increased but miti-gated the intensity ratio of green /red after the poling pro-cess.
IV. CONCLUSIONS
In this paper, we have investigated and reported the Stokes photoluminescence spectra with different poling con-ditions and different annealing temperature in the erbium doped potassium niobate ceramics. Poling effect study showed that polarization changed the peak intensity as well as spectral shape. All the Stark splitting components of
4S
3/2→4I15/2 transition were evident after poling process.
Furthermore, the frequency shift ⌬ of the peaks depended on the wavelength of the spectra after poling treatment dem-onstrated that the Stark splitting was produced by the dipole moment of erbium ions interacting with the internal local electric field due to polarization.
ACKNOWLEDGMENT
This research was supported by the National Science Council of Republic of China, under Grant No. NSC-93– 2216–E-006–033.
1
C. B. de Araujo et al., J. Non-Cryst. Solids 247, 209(1999). 2
B. R. Reddy and P. Venkateswarlu, Appl. Phys. Lett. 64, 1327(1994). 3
B. R. Reddy and S. K. Nash-Stevenson, J. Appl. Phys. 76, 3896(1994).
4
Z. Pan et al., J. Appl. Phys. 77, 4688(1995).
5
S. Hüfner, Optical Spectra of Transparent Rare-earth Compounds
(Aca-demic, New York, 1978). 6
A. Polman, Physica B 300, 78(2001).
7
P. Gunter, Phys. Rep. 93, 199(1982).
8
M. K. Chun, L. Goldberg, and J. F. Weller, Appl. Phys. Lett. 53, 1170
(1988). 9
L. Goldberg, L. Busse, and D. Mehusy, Appl. Phys. Lett. 60, 1037(1992). 10
U. Fluckiger, H. Arend, and H. R. Oswald, J. Am. Ceram. Soc. 56, 575
(1977). 11
S. Dezhong, Mater. Res. Bull. 21, 1375(1986). 12
P. D. Durugkar and A. G. Katpatal, J. Cryst. Growth 162, 161(1996). 13
D. G. Bozinis and J. P. Hurrell, Phys. Rev. B 13, 3109(1976).
14
A. M. Quittel et al., Phys. Rev. B 14, 5068(1976).
15
C. H. Wen, S. Y. Chu, S. L. Tyan, and Y. D. Juang, J. Cryst. Growth 262, 225(2004).
16
D. A. B. Miller and D. S. Chemla et al., Phys. Rev. B 32, 1043(1985). 17
S. P. McGinnis, B. Das, and M. Dobrowolska, Thin Solid Films 365, 2
(2000). 18
S. Tanabe et al., Opt. Mater.(Amsterdam, Neth.) 19, 343 (2002). 19
T. Miyakawa and D. L. Dexter, Phys. Rev. B 1, 2961(1970). 20
J. A. Capobianco et al., Phys. Chem. Chem. Phys. 2, 3203(2000).
21
B. R. Judd, Phys. Rev. 127, 750(1962).
22
J. S. Ofelt, J. Chem. Phys. 37, 511(1962).
23
M. J. Weber, Phys. Rev. 157, 262(1967). 24
C. K. Jørgensen and R. Reisfeld, J. Less-Common Met. 93, 107(1983). J. Appl. Phys., Vol. 96, No. 5, 1 September 2004 Chuet al. 2555