1
Dewetting in Polymer Blends Induced by Liquid-Liquid Phase Separation
Di-Yao Hsu (許迪堯), Che-Min Chou (周哲民), and Po-Da Hong (洪伯達)
*Department of Polymer Engineering, National Taiwan University of Science and Technology, Taipei, 10607, Taiwan
*
E-mail: [email protected]
Abstract
We study the structural evolution of phase separation in PEG/PEG-ran-PPG blend. The phase diagram is established with considering the crystallization in the blends by using light transmittance/DSC, and then could be distinguished into four regions: (i) one phase region; (ii) non-mean-field critical region;
(iii) mean-field critical region; (iv) phase separation coupled with crystallization region. To further discussion on the kinetics and morphological evolution, the process of phase separation is traced by time-resolved small angle light scattering (TRSALS) and phase contrast microscopy (PCM). The results show that the bicontinuous structure forms at the first and then the droplets induce by dewetting appeared after a period of phase separation. Finally, the bicontinuous structure is covered by droplets at the late stage. In this work, we try to clarify the structural variation with time evolution, and explain the double structures form in this system.
Key word: Polymer blends; phase separation; structure factor;
dewetting; time-resolved small angle light scattering
Introduction
Structural evolution of phase separation has been studied for several decades. One more special is that the transition of double structures in phase separation system, Hashimoto et al.
purposed percolation-to-cluster transition in off-critical polymer blend.1, 2 By this model, the whole bicontinuous structure will break and form droplets, and then the droplets coarsen to decrease surface energy. Another possibility is that the dewetting effect makes different structures at different layers, such as bulk and surface phase separation. In this study, we would like to focus attention on the formation and evolution of double structures.
Experimental Section
Material:
The crystallite/amorphous binary blend used in this study.
Poly(ethylene glycol) (PEG) (Mw = 20,000, Polysciences, Inc.).
Poly(ethylene glycol-ran-propylene glycol) (PEG-ran-PPG) (Mw = 12,000, Aldrich Chemical Co.). Before mixing the blends, the PEG-ran-PPG dissolved in deionized water and filtered through a 0.2μm Millipore Millex-LG filter for removing dust, and then evaporated the water. Finally, the PEG/PEG-ran-PPG blends were prepared by melt-mixing at 423K and then quenched to the arbitrary temperature for experiments.
Measurements:
Light Transmittance. This measurement coupled with DSC (Mettler-Toledo FP900 DSC Thermo-System). The cloud-points and melting temperatures of the blend with various concentrations were determined by this method.
Time-Resolved SALS Apparatus. The self-assemble TRSALS3 was used to study the phase separation process. The plane-polarized laser beam (He-Ne laser with wavelength of 632.8 nm) was used as the incident source. The sample cell was placed on a THMS 600 heating stage (Linkam Scientific Co.) and the scattered light intensity of the sample was directly imaged through a Fourier lens and an analyzer onto the CCD camera (Apogee Instruments Inc., Alta U2000). In this study, the scattering angular range is about θ = 1.7o - 22o,
corresponding to q = 0.29 – 3.79 μm-1 [q = (4π/λ) sin (θ/2), where q is the scattering vector, λ is the wavelength of incident light].
Phase Contrast Microscopy. The phase separation morphology was followed by PCM (Leica DMLP), equipped with a Linkam THMS 600 heating stage. And the images were captured by a CCD camera (Leica DFC490).
Results and Discussion
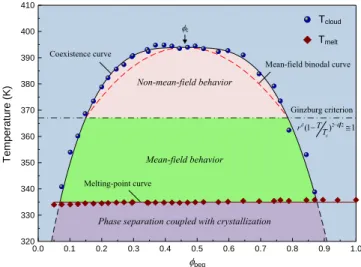
To obtain the coexistence curve, the light transmittance/DSC method is used to measure the cloud and melting points simultaneously. When the laser beam pass through the sample, the transmitted intensity and heat flow are measured by optical sensor and DSC as a function of temperature on cooling/heating process at a fix rate of 2K/min. After cooling to crystallization temperature, the samples are heating to high temperature to get the melting points from DSC. The phase diagram including critical point (ϕc = 0.46, Tc = 393.9K) and average melting temperature (Tm = 334.9K) is shown in Figure 1.
Acutally, the shape of coexistence curve is expressed by the critical exponent β, which agrees with Ising (β = 0.363) or Mean-field (β = 0.5) model. At the same time, the concentration differences could be ana zed bly y fitting to simpl scalinge 4
Δ , , T T T⁄ (1)
Where ε is reduced temperature, φcoex,1 and φcoex,2 are the volume fractions of PEG-poor and PEG-rich phase. Therefore, the result shows the slope by fitting different Δφ, and then gets the critical exponent (β = 0.30) that is close to Ising model. The coexistence curve is determined by cloud-point, and fitted by Eq. (1).
In fact, the phase diagram could be distinguished to different critical regions. Binder has pointed out that a way to separate them by Ginzburg criterion5, 6
1 ⁄ / 1 (2) Therefore, four regions are separated briefly: (i) one-phase region (out of coexistence curve); (ii) non-mean-field critical region (Eq. (2) << 1, and β = 0.3); (iii) mean-field critical region (Eq. (2) >> 1, and β = 0.5); (iv) phase separation couples with crystallization region (T < Tm).
The scattering profiles of different phase separation temperature and time are shown in Figure 2. It is clear seen that the scattering peak increases its intensity and shifts to low q, and corresponds the correlation structure grows with time elapses. Specially, another peak appears at lower q after a period time. However, the first peak represents the bicontinuous structure of phase separation forms and grows. But the appearance of second peak means a new structure forms, and grows with first structure simultaneously. In addition, the intensity of second peak grows faster than first peak, and then covers the first peak at late stage. Finally, it becomes hard to define the position of first peak. According to the double peaks, Hashimoto et al. explained this behavior because of
“percolation-to-cluster transition (PCT)” in off-critical polymer blend.1, 2 But it cannot explain our double peaks clearly, we shall discuss it later.
To get more deeply information of structure, the scaled
scattering st and defined by7-9
ructure factor F(x) can be considered
, , ⁄ , (3) With the reduced wavenumber x,
⁄ (4) Figure 3 shows the double logarithmic plot of F(x) vs. x for first peak (left) and second peak (right) at 363K and 373K. At early stage, it shows a slope (-6) at high x, and reduces first peak to a master curve in left part of Figure 3. It means this bicontinuous structure of phase separation is self-similar growing independent with time. However, the variation of slope changes from -6 to -4 when the second peak starts to appear at lower x. This transition points out some differences at local characteristic structure, such as the interface of two-phase changes from diffuse to sharp. In addition, the structure cannot satisfy self-similar growing and break the master curve no matter we reduce for first or second peak. To compare both structure factors in Figure 3, the height of first/second peak decreases/increases with time. Since the variation of height represents to the succession of amount, it means second structure starts to be main role in this system.
According to above discussion, we consider the system exist bicontinuous structure at beginning, and then crossover to another structure finally. While two structures grow simultaneously, the amounts of them still vary with time. It means second structure forms and supports from first structure, since the amount of first/second structure is lost/gained. Based on the Figure 2, we suggest the second structure diverges from first structure, and grows with time evolution. Thus, the Figure 3 helps us to compare the amounts variation briefly.
At late stage, the structure factor in a range of log x (0.2 – 0.4) shows F(x) increases and then decreases like a small peak, but this phenomenon does not appear before. Since the second structure contributes at late stage, the small peak should belong to second structure. Therefore, according to this small peak appears and the slope changes to -4, the second structure can be considered to a sphere-like structure with a shoulder that belongs form factor of sphere in Figure 3.
Further, we use PCM to focus on the substrate surface and study the morphology evolution of phase separation in Figure 4.
However, we find out two stages of phase separation. First, when the sample quenches to phase separation temperature, the bicontinuous structure forms and grows in Figure 4(a). Then, the bicontinuous structure transfers to droplets gradually in Figure 4(b). We believe this process is due to percolation-to-cluster transition. Nevertheless, three layers are detected by PCM at the same time. In the upper and lower layers, the transition of bicontinuous to droplets is clearly to show; but in the middle layer, it still maintains bicontinuous structure. Finally, the structure of middle layer will cover by droplet structure in the late stage. The same result is also shown in Figure 2. In addition, Figure 5 shows the droplets coarsen to reduce surface energy by Brownian motion.10, 11 Judging from the above, we can conclude that this phenomenon is due to phase separation coupled with dewetting effect, and the different layers are bulk and layer phase separation.12-15 Therefore, according to surface effect, two elements in our system have selectivity and dependence with substrate.
Since this system is crystallite/amorphous blend, the element of two-phase structure such as the droplet structure can be distinguished by crystallization. First, the sample is prepared by isothermal phase separation at 373K for a long time, and then quenched to 323K that is lower than melting temperature. The variation of crystallization process is shown in Figure 6. The matrix phase crystallizes directly, but the droplet phase crystallizes from surface to inner region gradually.
This process indicates that the droplet phase is PEG-poor that is hard to crystallization; and the matrix phase is PEG-rich that is direct to crystallization. Figure 7 also shows the evidence that the spherulite center almost locates at matrix phase or boundary of droplets. Moreover, some study16, 17 for PEG-block-PPG system shows micelle structure that PEG is hydrophilic side and PPG is hydrophobic side. Thus, we suggest the droplets form by dewetting effect, and phase separation induces dewetting effect.
It means two-phase concentration is the factor to control the dewetting behavior. At beginning, the concentration difference of two-phase does not enough to induce dewetting, so the bicontinuous structure keep growing; but after it enough to induce dewetting, the upper and lower layers follow percolation-to-cluster transition to form droplet structure.
Therefore, double structures form in this system.
Conclusion
In this paper, we propose the phase diagram of PEG/PEG-ran-PPG blends and the structural evolution by SALS and PCM, and then try to explain the form of double structures. First, the bicontinuous structure of phase separation forms at early stage. But after a period time, another droplet structure diverges from bicontinuous structure, and both structures exist simultaneously, we suggest this phenomenon is due to dewetting effect to make bulk and layer phase separation.
And the factor to control dewetting to show or not is two-phase concentration. And the scattering profiles and morphological evolution are shown in Figure 2 and 4.
To distinguish two-phase structure, we use crystallization to make sure the distribution of two elements. However, the result shows the droplet phase is PEG-poor and the matrix phase is PEG-rich. On the other hand, we also confirm the spherulite center forms from matrix phase or boundary of droplets, never from inner of droplet. The series of morphology are shown in Figure 6 and 7. In the next step, we would like to distinguish the amounts variation of two structures in phase separation process with time elapses.
320 330 340 350 360 370 380 390 400 410
0.0 0.1 0.2 0.3 0.4 0.5 0.6 0.7 0.8 0.9 1.0
Temperature (K)
peg
1 ) 1 (− 2−d2≅
c
d TT
r Tcloud
Tmelt
Ginzburg criterion Non-mean-field behavior
Mean-field behavior
Phase separation coupled with crystallization Coexistence curve
Melting-point curve
Mean-field binodal curve
c
Fig. 1 Phase diagram of PEG/PEG-ran-PPG blend.
The cloud and melting point are obtained from light transmittance/DSC. And the coexistence curve and binodal curve are building in Ising model and Mean-field theory. According to Ginzburg criterion, two critical behaviors could be separated to non-mean-field and mean-field behavior. When the temperature is lower than melting curve, phase separation process will couple with crystallization.
2
Fig. 2 Time evolution of scattering profile for φpeg = 0.55 at (a) 363K (b) 373K.
Fig. 3 Scaled structure factor for first peak (left) and second peak (right) for φpeg = 0.55 at (a) 363K and (b) 373K.
Fig. 4 Series of phase separation micrograph evolution near substrate surface for φpeg = 0.55 at 373K: (a) bicontinuous structure; (b) droplet form.
Fig. 5 Droplets coarsening process by Brownian motion for φpeg = 0.55 at 373K.
Fig. 6 Crystallization process at 323K after phase separation for φpeg = 0.55 at 373K.
3
Fig. 7 The center of spherulite that is shown by an arrow is locating at matrix phase.
References
[1] Takeno, H.; Hashimoto, T. J. Chem. Phys. 1997, 107, 1634.
[2] Takeno, H.; Nakamura, E.; Hashimoto, T. J. Chem. Phys.
1999, 110, 3612.
[3] Chou, C. M.; Hong, P. D. Macromolecules 2003, 36, 7331.
[4] Kita, R.; Dobashi, T.; Yamamoto, T.; Nakata, M.; Kamide, K. Phys. Rev. E 1997, 55, 3159.
[5] Binder, K. Phys. Rev. A 1984, 29, 341.
[6] Stepanek, P.; Lodge, T. P.; Kedrowski, C.; Bates, F. S. J.
Chem. Phys. 1991, 94, 8289.
[7] Binder, K.; Stauffer, D. Phys. Rev. Lett. 1974, 33, 1006.
[8] Furukawa, H. Physica A 1984, 123, 497.
[9] Hashimoto, T.; Itakura, M.; Hasegawa, H. J. Chem. Phys.
1986, 85, 6118.
[10] Binder, K.; Stauffer, D. Adv. Phys. 1976, 25, 343.
[11] Tanaka, H. Phys. Rev. Lett. 1994, 72, 1702.
[12] Wang, H.; Composto, R. J. J. Chem. Phys. 2000, 113, 10386.
[13] Genzer, J.; Kramer, E. J. Phys. Rev. Lett. 1997, 78, 4946.
[14] Guenoun, P.; Beysens, D.; Robert, M. Phys. Rev. Lett.
1990, 65, 2406.
[15] Brown, G.; Chakrabarti, A.; Marko, J. F. Phys. Rev. E 1994, 50, 1674.
[16] Mortensen, K.; Pedersen, J. S. Macromolecules 1993, 26, 805.
[17] Mortensen, K.; Brown, W.; Jargensen, E. Macromole- cules 1994, 27, 5654.