碩士論文
Graduate Institute of Chemical Engineering College of Engineering
National Taiwan University Master Thesis
奈米孔道的離子電流整流:孔道形狀, pH 與鹽類性質的 影響
Ionic Current Rectification of Nanochannels: Effects of Channel Geometry, pH, and Salt Conditions
林采葳 Tsai-Wei Lin
指導教授:徐治平 博士 Advisor: Jyh-Ping Hsu, Ph.D.
中華民國 108 年 6 月 June, 2019
I
誌謝
感謝恩師 徐治平教授從大學以來對我的指導與督促,無論是在研究上,或 是待人上都使我受益良多,也謝謝口試委員曾琇瑱教授、張有義教授、游琇伃教 授以及葉禮賢教授的指證與建議,使本論文能夠更臻完美。在 309 實驗室的這段 期間,多虧有志原學長親自帶領我進行研究工作,給予我很多研究以及生活上的 建議,讓我學到了很多很重要的研究態度與技能,志原學長無疑是我研究過程中 的貴人。感謝淑端學姊、聖昌、尚宏、俞閔、育佑、子暉學長給予我的指導與幫 助,使我的碩士生活充實且豐富。也非常感謝實驗室的學弟妹:偉誠、維寬、俊 廷、宗諺、佳蓉,謝謝你們在我忙碌的時候分擔事務,與我討論研究內容。最要 感謝的是我在 309 的好夥伴們:永哲和子喬,謝謝這兩年來的陪伴與幫助,謝謝 你們和我一起處理實驗室的事務、討論研究方向。真心地希望並祝福大家都能找 到自己所愛的地方,順利的生活。
感謝大學同學、雄友會同學、高中同學以及其他未具名的好友們,在我身邊 陪伴我、傾聽我的想法,給我很多支持與建議。最後,感謝最重要的爸媽和姐姐,
給予我最大的支持,尊重我所有的決定,讓我能夠專心地追求自己的夢想。
在此,僅將此論文獻給所有陪伴在我身邊的人們。
采葳
中文摘要
擁有高度應用潛力,奈米流體裝置近年來已受到須多研究團隊的重視。而為 了提供給實驗團隊重要的結果以促進奈米流體裝置的實際應用,我們利用數值模 擬研究這些奈米孔道中的離子傳輸行為。其中,離子電流整流行為為們主要研究 對象。在第一章節中,我們探討許多因素對錐狀奈米孔道的電流整流行為的影響,
囊括了孔道幾何與電解質濃度種類影響。在此研究中,我們討論的離子種類為:
KCl、NaCl 及 LiCl。我們發現,當電解質濃度較低,且開口角度很小的奈米孔道 中,LiCl 溶液有最佳的電流整流行為;然而,加大開口角度或是提高電解質濃度 時,則是 KCl 的電流整流行為最佳。此研究成果已發表於 Journal of Physical Chemistry C.
第二章節中,利用表面塗佈有 pH 可調節聚電解質的圓柱狀奈米孔道,我們提 出了同時施以外加電壓與外加酸鹼值 pH 梯度下,此奈米孔道的離子電流整流機 制。我們觀察到,當施加較強的 pH 梯度,此圓柱狀奈米孔道的整流方向會隨著外 加電壓大小而反轉;施加較弱的 pH 梯度,藉由提升聚電解質的接枝密度,可改變 奈米孔道的整流方向。我們所提出的機制討論與研究結果已發表於 Journal of Physical Chemistry C.
關鍵字:奈米流體;離子電流整流;電導度;可調節聚電解質;酸鹼值梯度
III
Abstract
Nanofludic devices have gained much attention for its applicability in many fields.
To advance nanodevices’ applications and provide significant results for experimental groups, we develop numerical models to simulate ion transport behaviors in naopores.
Ion current rectification (ICR) of nanopores is particularly focused in our studies. In the first part, the effects of nanopores’ geometry, bulk salt concentration, and types of salt on ICR of conical nanopores are discussed in detail. Three types of salt are considered:
KCl, NaCl, and LiCl. With sufficiently low salt concentration and small half cone angle, LiCl shows the best current rectifying behavior. The reverse of the trend is observed if we increases either the salt concentration or half cone angle. The above results was published in Journal of Physical Chemistry C.
In the second part, we provide a mechanism for ICR performance of a nanopore simultaneously applied with an electric potential and a pH gradient. A cylindrical nanopore functionalized with homogeneous (single) pH-tunable polyelectrolyte brushes is adopted in our study. We show that homogeneously modified nanopores can also exhibit ion current rectification behavior when applied an external pH gradient. The preferential direction of ionic current can be tuned by increasing level of applied electric potential if pH gradient is strong. For nanopores with weak pH gradient, an increase in grafting density of the polyelectrolyte chains can reverse preferential direction. The results and the discussion are published in Journal of Physical Chemistry C.
Keywords: Nanofludic devices; Ion current rectification; Nanopore conductance;
pH-tunable polyelectrlyte; pH gradient
Contents
誌謝 ... I
Abstract ... III Contents ... IV List of Figures ... V List of Tables ... X Chapter 1 Salt Dependent Ion Current Rectification in Conical Nanopores: Impact of Salt Concentration and Cone Angle ... 1 Chapter 2 Dual pH-Gradient and Voltage Modulation of Ion Transport and Current Rectification in Biomimetic Nanopores Functionalized with pH-Tunable Polyelectrolyte
39
Chapter 3 Conclusions ... 74
V
List of Figures
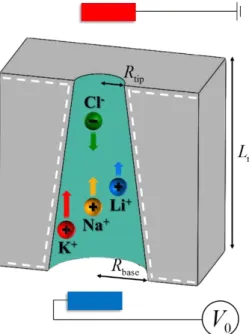
Figure 1-1. Schematic representation of the ion transport through a charged conical nanopore of tip radius Rtip, base radius Rbase, and length Ln connecting two large, identical reservoirs filled with an aqueous salt solutoin. V0 is the voltage bias applied across the nanopore with the electrode in the upper reservoir grounded. ... 22 Figure 1-2. Current-voltage curves for various salt solutions at various combinations of bulk salt concentration Cbulk and half cone angle at R tip 6 nm. (a)
bulk 3 mM
C and 0.5; (b) Cbulk 3 mM and ; (c) 1 Cbulk 3 mM and
; (d) 5 Cbulk 100 mM and . ... 23 1 Figure 1-3. Current rectification ratio, R , as a function of the magnitude of the f
applied voltage, V0 , for various salt solutions at various combinations of the bulk salt concentration Cbulk and the half cone angle at Rtip 6 nm. (a) Cbulk 3 mM and
0.5; (b) Cbulk 3 mM and ; (c) 1 Cbulk 3 mM and ; (d) 5
bulk 100 mM
C and . ... 24 1 Figure 1-4. Axial variations in the cross sectional averaged concentration difference
Cavg
at Cbulk 3 mM and Rtip 6 nm for various combinations of the half cone
angle and the applied voltage bias V . (a) 0 0.5 and V 0 0.5 V (b)
0.5 and V 0 1.5 V, (c) and 5 V 0 0.5 V, (d) and 5
0 1.5 V
V . ... 25 Figure 1-5. Axial variation of the cross sectional averaged electric potential at
0 1.5 V
V and Rtip 6 nmunder various conditions. (a) Cbulk 3 mM and ; 1
(b) Cbulk 100 mM and ; (c) 1 Cbulk 3 mM and . ... 26 5 Figure 1-6. Variation of the current rectification ratio Rf with the magnitude of the applied voltage V for various salts. (a): 0 Rtip 6 nm, Cbulk 10 mM, and 0.5;
(b): Rtip 15 nm, Cbulk 10 mM, and 0.5; (c): Rtip 30 nm, Cbulk 100 mM, and . ... 27 5 Figure 1-7. Variation of the ion selectivity S with the applied voltage bias V0 at
tip 6 nm
R for various combinations of the type of salt and the half cone angle θ at
bulk 3 mM
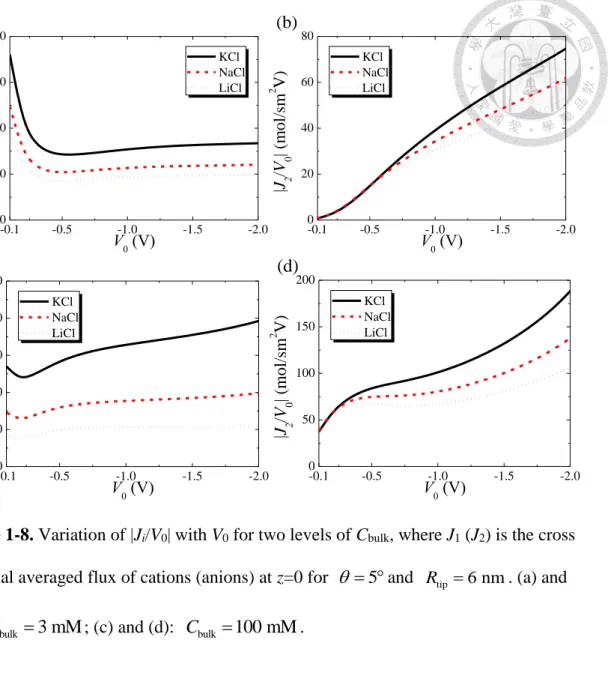
C , (a), and Cbulk 100 mM, (b). ... 28 Figure 1-8. Variation of |Ji/V0| with V0 for two levels of Cbulk, where J1 (J2) is the cross sectional averaged flux of cations (anions) at z=0 for and 5 Rtip 6 nm. (a) and (b): Cbulk 3 mM; (c) and (d): Cbulk 100 mM. ... 29 Figure 1-S1. Variation of the conductance G with the bulk salt concentration Cbulk. Solid curve: bulk solution conductance; broken curve: analytic result at a constant surface charge density;53 discrete symbols: present numerical result at Rtip=6 nm,
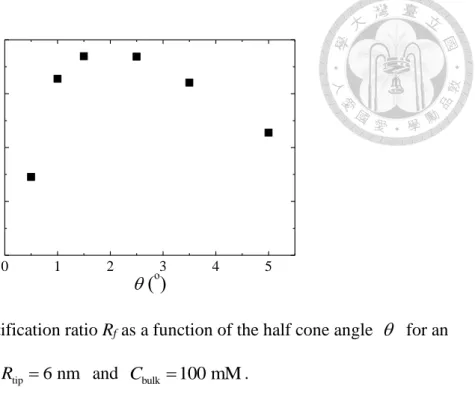
Rbase=93.49 nm, and s 0.5 e/nm2. ... 30 Figure 1-S2. Current rectification ratio Rf as a function of the half cone angle for an aqueous KCl solution at Rtip 6 nm and Cbulk 100 mM. ... 31 Figure 1-S3. Current rectification ratio, R , as a function of the magnitude of the f applied voltage, V0 , for various salt solutions at Rtip 6 nm and . (a) 1
bulk 300 mM
C ; (b) Cbulk 1000 mM. ... 32 Figure 1-S4. Axial variations in the cross sectional averaged concentration difference
Cavg
under various conditions, where Rtip 6 nm. (a) Cbulk3 mM, 0.5, and
VII
0 0.5 V
V (b) Cbulk 3 mM, 0.5, and V 0 1.5 V, (c) Cbulk3 mM, , 5 and V 0 0.5 V, (d) Cbulk 3 mM, , and 5 V 0 1.5 V. ... 33 Figure 1-S5. Axial variations in the cross sectional averaged concentration difference
, i avg
C under various conditions, where Rtip 6 nm. (a) Cbulk 3 mM, 0.5 and
0 0.5 V
V (b) Cbulk 3 mM, 0.5, and V 0 1.5 V, (c) Cbulk3 mM, , 5 and V 0 0.5 V, (d) Cbulk 3 mM, , and 5 V 0 1.5 V. Curves: cations;
discrete symbols: anions. ... 34 Figure 1-S6. Axial variations of the electric potential at V 0 +1.5 V under various conditions, where Rtip 6 nm (a) Cbulk 3 mM and ; (b) 1 Cbulk 100 mM and ; (c) 1 Cbulk 3 mM and . ... 35 5 Figure 1-S7. Current rectification ratio, R , as a function of the magnitude of the f applied voltage, V0 , for various salt solutions at Rtip 3 nm. (a) Cbulk 3 mM and
0.5; (b) Cbulk 100 mM and . ... 36 1 Figure 1-S8. Ionic current-voltage curves for various electrolyte solutions at various combination of salt concentration Cbulk and half cone angle , where Rtip 6 nm. (a)
bulk 3 mM
C and ; (b) 5 Cbulk 100 mM and . ... 37 5 Figure 1-S9. Variation of the selectivity S with the applied voltage bias V0 when
tip 6 nm
R for various combinations of the type of salt and the half cone angle θ at
bulk 3 mM
C , (a), and Cbulk 100 mM, (b). ... 38 Figure 2-S1. Current-voltage curves of a single polyethylene terephthalate (PET) conical nanopore with its surface functionalized with Lysine in 100 mM KCl solution for various pH values. The pore thickness is 12 μm with tip radius of 8 nm and base radius of 165 nm. The polyelectrolyte layer is assumed 1 nm thick with 0.2 nm.27,
Curves: present theoretical results with variables pKA 2.2, pKB , and 9
2
total 0.6 chains/nm
N ; discrete symbols: experimental data of Ali et al.42 ... 68 Figure 2-S2. Axial variation in the cross sectional averaged concentrations of cations (K+ and H+) and anions ( Cl and OH) with Ntotal 0.1 chains/nm2 at pHH/pHL=11/3, (a), and pHH/pHL=7/3, (b). Curves: Vapplied 0.2 V; discrete symbols: Vapplied 0.5 V.69 Figure 2-S3. Concentration profiles of K+, (a) and (b), and Cl, (c) and (d), for two values of the grafting density of PE chains Ntotal at pHH/pHL=11/3. ... 70 Figure 2-S4. Axial variation in the charge density of the PE layer for various m levels of Vapplied with Ntotal 0.5 chains/nm2at pHH/pHL=11/3, (a), and pHH/pHL=7/3, (b). ... 71 Figure 2-S5. Concentration profiles of H+ for two values of grafting density of PE chains Ntotal at pHH/pHL=7/3. ... 72 Figure 2-S6. Concentration profiles of K+, (a) and (b), and Cl, (c) and (d), for two values of the grafting density of PE chains Ntotal at pHH/pHL=7/3. ... 73 Figure 2-S1. Current-voltage curves of a single polyethylene terephthalate (PET)
conical nanopore with its surface functionalized with Lysine in 100 mM KCl solution for various pH values. The pore thickness is 12 μm with tip radius of 8 nm and base radius of 165 nm. The polyelectrolyte layer is assumed 1 nm thick with 0.2 nm.27,
57 Curves: present theoretical results with variables pKA 2.2, pKB , and 9
2
total 0.6 chains/nm
N ; discrete symbols: experimental data of Ali et al.42 ... 68 Figure 2-S2. Axial variation in the cross sectional averaged concentrations of cations (K+ and H+) and anions ( Cl and OH) with Ntotal 0.1 chains/nm2 at pHH/pHL=11/3, (a), and pHH/pHL=7/3, (b). Curves: Vapplied 0.2 V; discrete symbols: Vapplied 0.5 V.69
IX
Figure 2-S3. Concentration profiles of K+, (a) and (b), and Cl , (c) and (d), for two values of the grafting density of PE chains Ntotal at pHH/pHL=11/3. ... 70 Figure 2-S4. Axial variation in the charge density of the PE layer for various m levels of Vapplied with Ntotal 0.5 chains/nm2at pHH/pHL=11/3, (a), and pHH/pHL=7/3, (b). ... 71 Figure 2-S5. Concentration profiles of H+ for two values of grafting density of PE chains Ntotal at pHH/pHL=7/3. ... 72 Figure 2-S6. Concentration profiles of K+, (a) and (b), and Cl, (c) and (d), for two values of the grafting density of PE chains Ntotal at pHH/pHL=7/3. ... 73
List of Tables
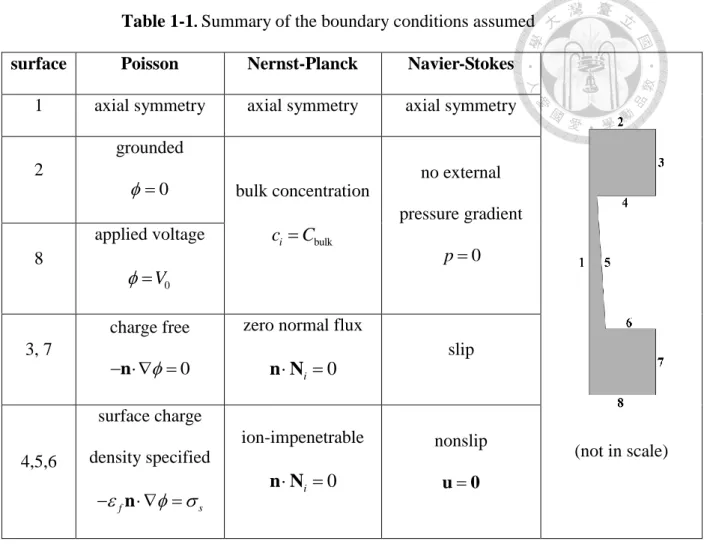
Table 1-1. Summary of the boundary conditions assumed ... 21 Table 2-1. Boundary conditions assumed for eqs 1-4. ... 61
Reproduced with permission from The Journal of Physical Chemistry C 121 (50), 28139-28147 Copyright 2017 American Chemical Society.
Chapter 1 Salt Dependent Ion Current Rectification in Conical
Nanopores: Impact of Salt Concentration and Cone Angle
1-1. Introduction
Recently, nanopore/nanochannel based devices have been applied widely in various areas of practical significance, including, for example, ion gate,1-3 energy conversion,4-9 DNA translocation,10-12 and biosensor.13-16 The underlying mechanisms of these
applications are electric double layer (EDL) overlapping17-19 and associated specific ionic transport behaviors. The former arises from that the linear size of a device (e.g., nanopore radius) can be on the order of EDL thickness, yielding profound and
interesting electrokinectic phenomena. These include, for instance, ion concentration polarization (ICP),18, 20-21 ion selectivity,22-23 and ionic current rectification (ICR).24-25 ICP refers to the asymmetric distribution of ions across a nanopore when an electric potential bias is applied. Ion selectivity stems from that a charged nanopore attracts counterions and repels coions simultaneously so that either cations or anions are easier to pass through than the other. ICR denotes the preference of the ionic current direction when a potential bias is applied. This specific behavior can be attributed to the
asymmetric nanopore geometry,26-27 asymmetric surface charge distribution,28-31 wettability difference,32-33 and external stimuli.34-35
The application of a potential bias across a charged nanopore/nanochannel yields an electroosmotic flow (EOF).36-37 Although this effect is often neglected in previous studies, for simplicity, it can play an important role in relevant electrokinectic
phenomena. For instance, Ai et al.38 showed that if the surface charge density is fixed, the influence of EOF on the ICR behavior of a conial nanopore is significant if its EDL is medium thick and the applied voltage bias sufficiently high. Their analysis was extended by Lin et al.39 to the case of a conical nanopore having a charge-regulated surface.
Several factors have been proposed for explaining the ICR behavior of a nanopore,
including, for example, surface charge density,38, 40 applied voltage bias,41 type of ions,42-44 salt gradient,45-46 and nanopore geometry.47-50 Adopting a model comprising Poisson-Nernst-Planck (PNP) equations (i.e., EOF is neglected), Kubeil et al.47 examined the influeces of the radius and the angle of a conical nanopore on its ICR behavior. Assuming a fixed surface charge density, they showed that these influeces can be important. Tseng at al.49 extended their study by considering a model comprising PNP and Navier-Stokes (PNP+NS) equations, where both the tip-end and the base-end radii are subject to change. It was concluded that the EOF effect can be significant.
Another factor which can be of practical significance is the presence of multivalent ions in the liquid phase. The influence of this factor on the ICR behavior of a
nanopore/nanochannel was studied both theoretically and experimentally. Pérez-Mitta et al.44 illustrated that both the ionic current and the rectification efficiency of K2SO4 are larger than those of KCl. For aqueous, alkali chloride salt solutions in an α-hemolysin modified nanopore, Bhattacharya et al.51 showed experimentally that the ICR ratio of various monovalent salts ranks as LiCl<NaCl<KCl<RsCl<CsCl. Gamble et al.43
examined experimentally the type of ion species on the ICR behavior of a conical PET nanopore. Through molecular dynamics simultion, they proposed that the effective surface charge of a PET nanopore depends upon the degree of binding of ions with the carboxyl groups on its wall. The result obtained was used to explain the dependence of the ICR behavior of a nanopore on the types of salt predicted by a PNP model. Hsu et al.42 showed that this dependence can also be attributed to the presence of EOF.
Considering a conical nanopore, Cao et al.7 concluded that the performance of reverse electrodialysis depends highly upon the composition of the electrolyte solution. For instance, the salinity power generated from caion-selective (anion-selective) nanopores increases (decreases) with the cation mobility. It was also shown that the ionic species
dependence of ICR could be tunned through applying a concentration gradient.46 Up to now, the influence of the nanopore geometry on its ionic current rectification behavior taking account of both type of salt and EOF has not been discussed
comprehensively. This is conducted in the present study by considering conical nanopores having a fixed charge density. The influence of the nanopore geometry is investigated by varying the cone angle and the tip-end radius. Three typical types of monovalent salt are examined: KCl, NaCl, and LiCl.
1-2. Theoretical model
As illustrated in Figure 1-1, we consider a conical nanopore of the tip radius Rtip, base radius Rbase, and axial length Ln connecting two identical, cylindrical reservoirs filled with an aqueous salt solution. The length and the radius of the reservoirs are sufficiently large so that the salt concentration at a point far away from the nanopore reaches essentially the bulk value. The ionic species is driven from one reservoir through the nanopore to the other by a potential bias V0 applied across the nanopore.
The two electrodes are positioned in the reservoirs located far away from the nanopore where the electrode in the upper reservoir is grounded. The cylindrical coordinates with the origin at the center of the nanopore tip are adopted. However, since the present problem is axial symmetric, only the (r, z) domain needs be considered, r and z being the radial and the axial coordinates, respectively.
The transport of ionic species in the system under consideration can be described by Poisson-Nernst-Planck equation
i 0
i i i i i i
c D c z D Fc
RT
N u , (1)
where the electric potential ϕ is governed by Poisson equation
2 2
1
f i i
i
F z c
(2)In these expressions, u=uer+vez is the fluid velocity with er and ez being the unit vectors in the r and z directions, respectively, and u and v the corresponding velocity
components. Ni, ci, Di, and zi are the flux, concentration, diffusivity, and valence of the ith ionic species, respectively (i is 1 for cations and 2 for anions). f , F, R, and T are the fluid permittivity, Faraday constant, gas constant, and the absolute temperature, respectively.
Since the Reynolds number is small in our system, the fluid velocity can be determined from the equation of continuity and the modified Navier-Stokes equations
u 0 (3)
2 2
1 i i i
p F z c
u 0 (4)
p and μ are the hydrodynamic pressure and the fluid viscosity, respectively. Considering
these equations implies that the effect of electroosmotic flow (EOF) is taken into accout.
To specify the boundary conditions associated with Eqs. (1)-(4), we assume the following. (i) The nanopore walls (surfaces 4, 5, and 6, see table below) are
ion-impenetrable (n N i 0), nonslip (u0 ), and have the charge density s
(fn s). Here, we assume that the deprotonation of the functional groups of the nanopore material is complete so that s is constant.52 (ii) The side boundaries of the two reservoirs (surfaces 3 and 7) have zero normal flux (n N i 0), are charge free ( n 0), and slip. (iii) The end surfaces 2 and 8 are sufficiently far from the nanopore, where surface 2 in the top reservoir is grounded ( ), and a voltage bias 0 (V0) is applied to surface 8 in the bottom reservoir. (iv) The ionic concentrations on
surfaces 2 and 8 reach essentially the bulk value (ci Cbulk). These are summarized in the table below.
Letting S be a surface normal to the nanopore axis, the ionic current I through the nanopore can evaluated by
2
1
i i
S i
I F z dS
N n (5)
1-3. Results and discussion
Equations (1)-(4) and the associated boundary conditions are solved numerically by COMSOL (version 4.3a, http://www.comsol.com) operated in a high-performance cluster. The applicability of the numerical scheme adopted is verified by Figure 1-S1. To examine the behavior of the system under consideration, a thorough numerical
simulation is conducted. For illustration, we assume the following: Ln=5000 nm, 0.5 e/nm2
s , F=96485 C/mol, R=8.314 J/mol K , =298 KT , =0.001 Pa s , 6.95 10 10 mF/
f , D1(K ) 1.96 10 m /s+ 9 2 , D1(Na ) 1.33 10 m /s+ 9 2 ,
+ 9 2
1(Li ) 1.03 10 m /s
D , and D2(Cl ) 2.03 10 m /s 9 2 . The influences of the half cone angle θ, the bulk salt concentration Cbulk, the applied voltage bias V0, the nanopore tip radius Rtip, and the type of salt (KCl, NaCl, LiCl) on the current rectification
behavior of the nanopore are examined in subsequent discussion. The degree of current rectification is measured by the rectification ratio Rf [ (I V) / ( )]I V .43 According to previous studies,16, 49 the degree of Rf shows a local maximum with varying cone angle, as depicted in Figure 1-S2. Since Rf has a maximum at a cone angle close to 1 (or 2 1 ~ 2 , is the half cone angle in our study), we assumed that
0.5 in the numerical simulation so that the optimum cone angle could be 5 included.
1-3-1 Current-voltage curves
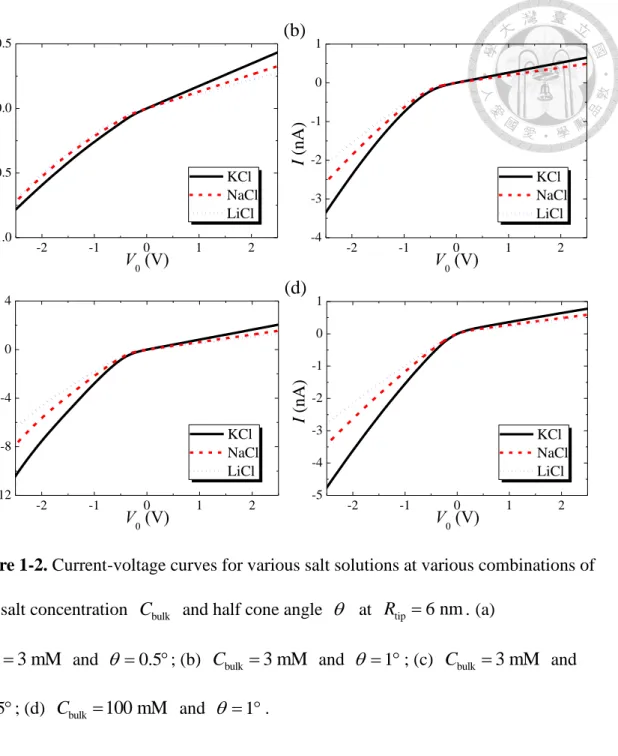
The results illustrated in Figure 1-2 reveal that I(V0<0) is larger than the
corresponding I(V0>0). This preference in the current direction is known as ion current rectification (ICR), which can be explained by the enrichment/depletion of the ions in a nanopore caused by the difference in ionic fluxes inside/outside it. Figure 1-2 also reveals that, regardless of the sign of V0, the magnitude of I for the types of salt considered ranks as I(KCl) I(NaCl) I(LiCl) , which can be attributed to the relative magnitudes in the cationic diffusivities. In addition, the magnitude of I increases with increasing Cbulk or θ. The former is expected because the higher the bulk salt
concentration the larger the amounts of cations and anions driven through the nanopore.
The latter is due to the fact that the surface area, and therefore, the effective cross sectional area of the nanopore increases with increasing cone angle.
1-3-2 Current rectification
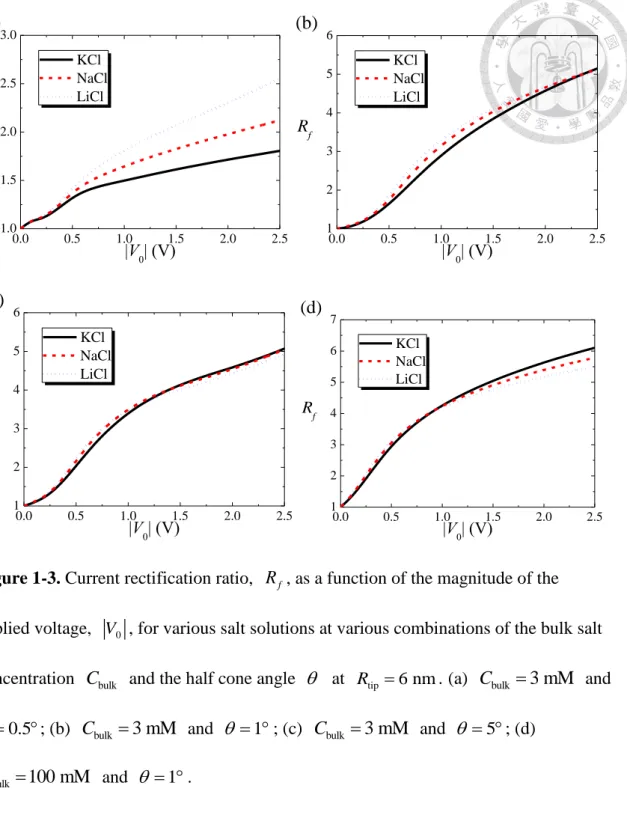
Figure 1-3(a) shows that at Cbulk 3 mM and 0.5, the value of R for f various types of salt ranks as Rf(LiCl)Rf(NaCl)Rf(KCl). However, if θ is raised to 1, this order is reversed when V0 is sufficiently high, as seen in Figure 1-3(b).
This makes the R -f V0 curves of the salts examined intersect at the same point.42-43 As seen in Figure 1-3(c), if θ is further raised to 5 , the value of V0 at which the
intersection of the R -f V0 curves occur becomes smaller; that is, the reverse in the order of R occurs at a lower applied voltage bias. A comparison between Figure f
1-3(b) and 3(d) reveals that if θ is fixed, raising the level of Cbulk also makes that intersection to occur at a lower level of V0 . As will be discussed later, these phenomena can be attributed to a decrease in the degree of double layer overlapping inside the nanopore as θ and/or Cbulk are raised. Note that, as shown in Figure 1-S3, the qualitative ICR behaviors at higher salt concentration (e.g. 300 mM and 1000 mM) are essentially the same as those at 100 mM.
The order of R for various types of salt observed in Figure 1-3 can be explained f by the variation in the distribution of ions in the nanopore with the applied voltage bias.
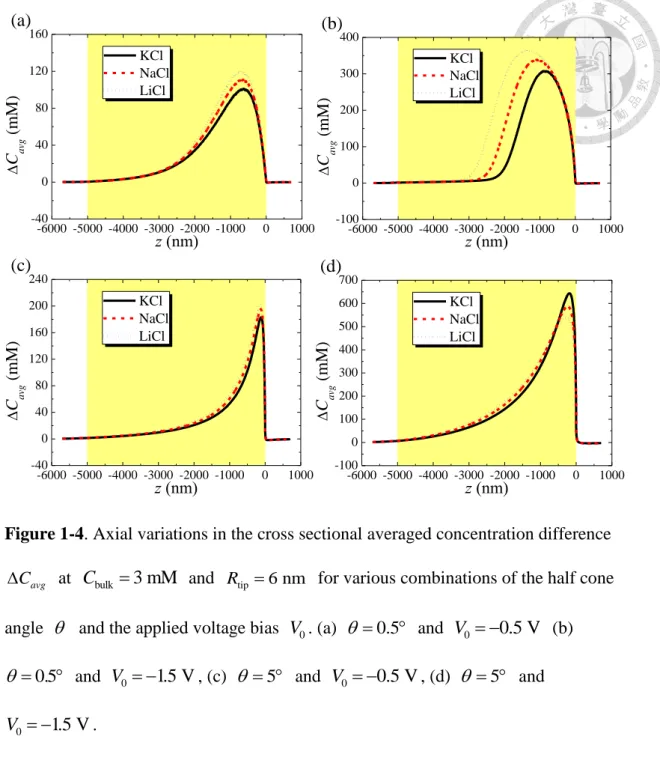
In the absence of V0, cations (counterions) are attracted into the negatively charged nanopore. The application of V0 influences the distribution of ions, leading to either an enrichment or a depletion of the ions in the nanopore. Figure 1-4 illustrates the
difference in the ionic concentration, Cavg (c1c10) ( c2c20), caused by a negative applied voltage bias under various conditions. That by a positive applied voltage bias is shown in Figure 1-S4. c is the cross sectional averaged concentration i
of the ith ionic species, and c denotes its value at Vi0 0=0 V. As seen in Figure 1-S4, the value of Cavg for V0>0 is insensitive to the type of salt, implying that the
species-dependent ICR behavior observed previously arises mainly from the ionic transport for V0<0. As shown in Figure 1-4(a) and 1-4(c), if the negative applied voltage bias is low (V 0 0.5 V), the degree of ion enrichment follows the order
LiCl>NaCl>KCl, which is consistent with that of R . On the other hand, if the f negative applied voltage bias is high (V 0 1.5 V), the order of the degree of ion enrichment remains the same at 0.5, but becomes reversed (i.e., KCl>NaCl>LiCl)
at . This explains the behavior of the 5 R -f V0 curves seen in Figure 1-3(a) and 3(c).
1-3-3 Axial variation in cross sectional averaged potential
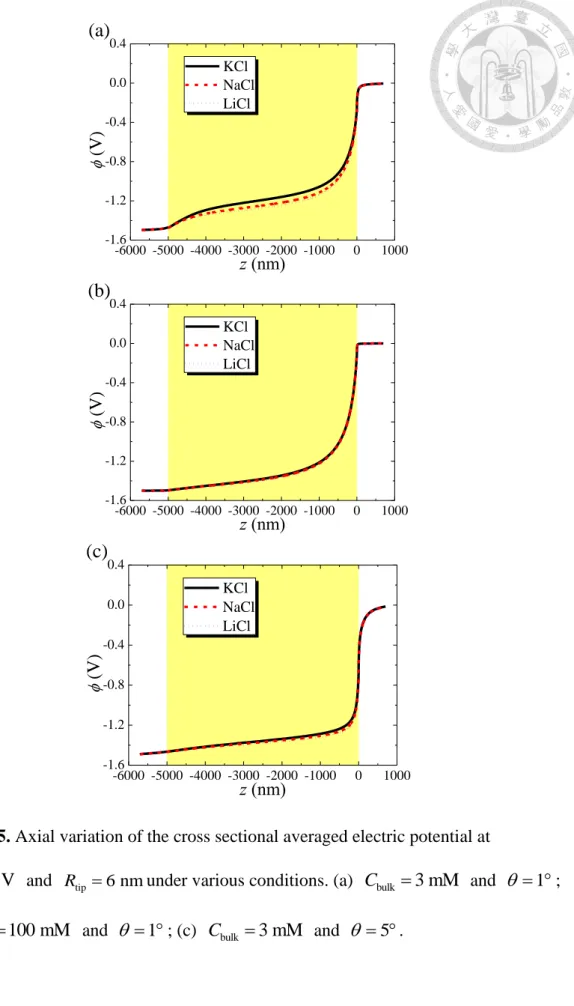
The axial variation in the cross sectional averaged electric potential at V 0 1.5 V for various combinations of the values of θ and Cbulk is presented in Figure 1-5. Since the nanopore is negatively charged (i.e., cation-selective), the total amount of cations driven by a negative applied voltage bias into it is greater than that of anions. The more the amount of cations accumulated near the nanopore tip the slower the rate of decrease in the electric potential. Figure 1-5(a) shows that the rate of decrease in the electric potential drop at Cbulk 3 mM and ranks as LiCl>NaCl>KCl. This implies 1 that KCl accumulates more inside the nanopore than other salts, yielding a slower potential drop. However, if Cbulk (Figure 1-5(b)) or θ (Figure 1-5(c)) takes a higher value, the degree of EDL overlapping decreases, and ions accumulate mostly near the nanopore tip. In this case, the difference in the distribution of electric potential among the types of salt considered is insignificant, and the rate of ion transport is dominated by the diffusivity of cations, which ranks as + + +
K Na Li
D D D , so that the associated R f follows the same order. This reasonably explains the observed voltage-dependent ICR behaviors of the types of salt examined in Figure1- 3. The corresponding distributions of the electric potential at V 0 1.5 V are plotted in Figure 1-S6, which shows that the electric potential is influenced by Cbulk, θ, and the type of salt.
1-3-4 Influence of tip radius
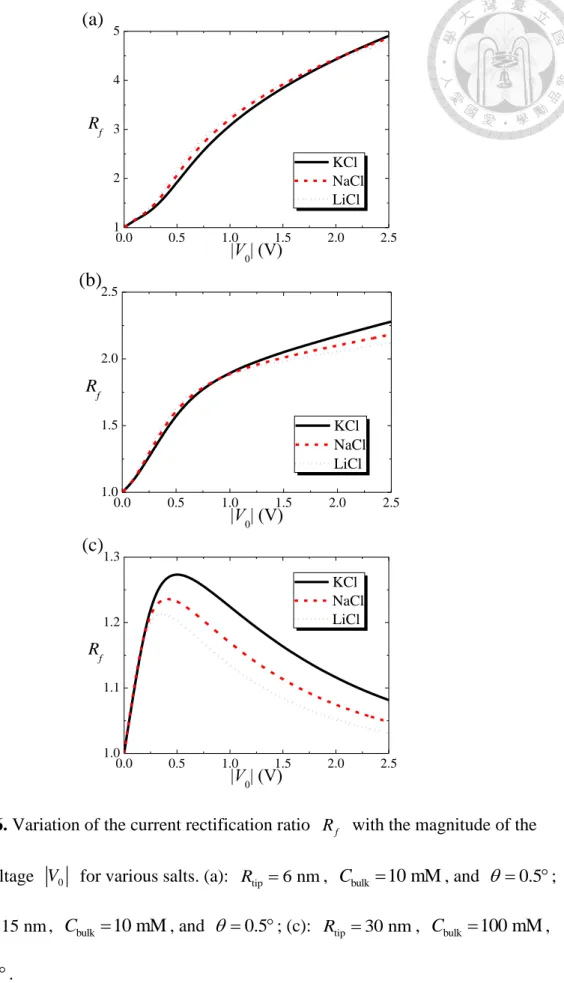
The influence of the tip radius of a nanopore Rtip on its current rectification behavior
is illustrsted in Figure 1-6. As seen in Figure 1-6(a) and 1-6(b), where θ=0.5° and Cbulk=10 mM, the larger the Rtip the smaller the value of V0 at which the R -f V0 curves of the types of salt intersect. This is because that, for the same levels of θ and Cbulk, the region of EDL overlapping decreases with increasing tip radius. If the levels of θ, Cbulk, and Rtip are all raised to those of Figure 1-6(c), the magnitude of R ranks as f
(KCl) (NaCl) (LiCl)
f f f
R R R for all the levels of V0 applied. This is because the EDL is thin in this case, so that the region of EDL overlapping reduces considerably and, therefore, R is mainly dominated by the diffusvity of cations. Figure 1-6(c) also f
reveals that R has a local maximum as f V0 varies. As mentioned previously, the enrichment and depletion of ions in a charged nanopore exhibiting ICR behavior can be attributed to the difference in the ionic fluxes inside/outside it. However, if EDL is thin, the ionic fluxes inside/outside the nanopore are comparable, especially when the applied voltage bias is high, so that R decreases. On the other hand, the current rectification f behaviors for tip radius smaller than 6 nm is shown in Figure 1-S7. Compared with Figure 1-3(a) and Figure 1-3(d), the behaviors of R for f R tip 3 nm are similar to
those for R tip 6 nm, implying that a lower R will not influence the qualitative ICR tip behavior under the present conditions.
1-3-5 Ion selectivity for V0<0
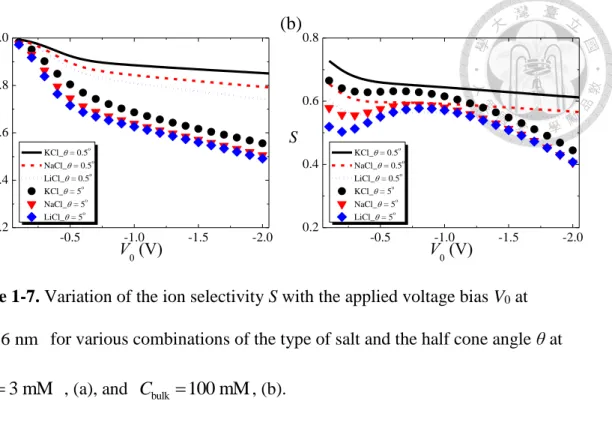
Figure 1-7 shows the influences of the half cone angle θ and the applied voltage bias V0 on the selectivity of the nanopore, cation anion
cation anion
| | | |
| | | |
I I
S I I
, for various types of salt. If S>0 (S<0), the nanopore is cation-selective (anion-selective). In our case, because the nanopore is negatively charged, the ions driven through it are mainly cations (i.e.,
cation-selective). Figure 1-7 revals that the magnitude of S ranks as (KCl) (NaCl) (LiCl)
S S S . As seen in Figure 1-S8, the level of the difference between Ication and Ianion follows the order KCl>NaCl>LiCl, implying that the contribiution of cations to ionic current ranks as K+>Na+>Li+. This explains the observed order of S for the types of salt examined.
As can be seen in Figure 1-7(a), at Cbulk 3 mM and 0.5, the selectivity of all the types of salt exmined is close to unity, implying that the nanopore is highly cation-selective. This figure also indicates that S decreases significantly as θ increases, which is expected since the degree of double layer overlapping in the nanopore
decreases with increasing θ. In addition, S decreases with increasing V0. This is because the larger the V0 the more significant the ion enrichment inside the nanopore so that the less significant the overlapping of double layer, leading to a smaller S. Figure 1-7(b) shows that the S at Cbulk 100 mM is smaller than that at Cbulk 3 mM. Again, this is due to a less significant double layer overlapping in the former.
Interestingly, the S at does not decrease monotonically with increasing V5 0
as that observed at 0.5, and the S of LiCl at is larger than that at 5 0.5 for -1 V<V0<-0.7 V. These anomalous behaviors can be explained by the ionic flux near the nanopore tip shown in Figure 1-8, where J1 (J2) is the cross sectional averaged flux of cations (anions). At Cbulk 3 mM, the significantly overlapped double layer yields an induced electric field near the nanopore tip with its direction opposite to that of V0 so that V0 is lessened. Figure 1-8(a) shows that |J1/V0| decreases with increasing V0 until V0
is sufficiently large. This is because as V0 increases the ion transport is electrostatically hindered by the enriched ions inside the nanopore so that the rate of increase in J1 with increasing V0 is slower than the rate of increase in V0.21 However, if V0 is sufficiently high, it becomes more significant than the electric field arising from ion enrichment so
that |J1/V0| becomes to increase with V0. On the other hand, since anions (co-ions) are mainly present outside the double layer, J2 is influenced mainly by V0. Therefore, |J2/V0| increases essentially with increasing V0, as seen in Figure 1-8(b) and (d). As seen in Figure 1-7(b), at Cbulk 100 mM and 0.5, since the overlapping of double layer in the nanopore is insignificant, the induced electric field mentioned above is
unimportant compared to that associated with V0. Therefore, as in Figure 1-8(a), |J1/V0| also shows a local minimum in Figure1- 8(c), except that the latter is more apparent.
Figure 1-8(a) and (c) reveals that in the latter, |J1/V0| begins to increase with increasing V0 at a smaller value of V0, and the rate of increase is much faster so that the selectivity in Figure 1-7(b) decreases non-monotonically with increasing V0, instead of
monotonically as that in Figure 1-7(a).
1-3-6 Ion selectivity for V0>0
The voltage-dependent selectivity when a positive voltage bias is applied is
illustrated in Figure 1-S9. In this case, because the depletion of ions inside the nanopore is significant, and ion concentration low, the double layer is thick so that S 1, and it is insensitive to the variation in V0, as illustrated in Figure 1-S9(a). Different from that for the case of V0<0, Figure 1-S9(b) shows that the S for various types of salt increases with increasing V0. This is expected because if V0>0, the larger the V0 the more significant the degree of ion depletion, the more significant the overlapping of double layer, and therefore, the larger the S.
1-4. Conclusions
We investigated theoretically the ionic current rectification behavior of a negatively charged conical nanopore focusing on the influence of the half cone angle θ, the bulk
salt concentration Cbulk, and the type of salt (KCl, NaCl, LiCl). It is found that at
bulk 3 mM
C and/or , the rectification ratio 1 R of the types of salt examined f ranks as Rf(LiCl)>Rf(NaCl)>Rf(KCl) for all the levels of the applied voltage bias V0. If V0 is sufficiently high, this order can be reversed if Cbulk and/or θ are raised, so that the
R -Vf 0 curves of the types of salt examined intersect at the same point. This can be attributed to the difference in the degree of ion enrichment of the types of salt considered for V0<0. The degree of enrichment of LiCl is the largest if V0 is small regardless of the level of θ; however, as the level of V0 increases, the enrichment of KCl becomes the largest only if . The point of intersection of the 1 R -Vf 0 curves of the types of salt examined shifts to a lower value of V0 when either Cbulk or θ is increased, which can be explained by the rate of ion transport. Due to the accumulation of ions near the nanopore tip, the rate of decrease in the electric potential decreases if the overlapping of double layer is significant, thereby lowering the rate of transport of ions. However, if Cbulk
and/or θ take a higher value, the distributions of the electric potential of the types of salt examined are essentially the same. The selectivity S for the types of salt examined ranks as S(KCl)>S(NaCl)>S(LiCl), and its behavior as V0 varies depends highly on the level of Cbulk. If Cbulk 3 mM, S decreases monotonically with increasing V0; if Cbulk is
sufficiently high and θ large, S shows both a local minimum and a local maximum as V0
varies.
References
1. Zhang, H. C.; Tian, Y.; Hou, J.; Hou, X.; Hou, G. L.; Ou, R. W.; Wang, H. T.; Jiang, L. Bioinspired Smart Gate-Location-Controllable Single Nanochannels: Experiment and Theoretical Simulation. ACS Nano 2015, 9, 12264-12273.
2. Liu, M. Y.; Zhang, H. C.; Li, K.; Heng, L. P.; Wang, S. T.; Tian, Y.; Jiang, L. A Bio-Inspired Potassium and pH Responsive Double-Gated Nanochannel. Adv. Funct.
Mater. 2015, 25, 421-426.
3. Gao, L. J.; Li, P.; Zhang, Y. Q.; Xiao, K.; Ma, J.; Xie, G. H.; Hou, G. L.; Zhang, Z.;
Wen, L. P.; Jiang, L. A Bio-Inspired, Sensitive, and Selective Ionic Gate Driven by Silver (I) Ions. Small 2015, 11, 543-547.
4. Xie, G. H.; Wen, L. P.; Jiang, L. Biomimetic Smart Nanochannels for Power Harvesting. Nano Res. 2016, 9, 59-71.
5. Tseng, S.; Li, Y. M.; Lin, C. Y.; Hsu, J. P. Salinity Gradient Power: Influences of Temperature and Nanopore Size. Nanoscale 2016, 8, 2350-2357.
6. Zhang, Z.; Kong, X. Y.; Xiao, K.; Liu, Q.; Xie, G. H.; Li, P.; Ma, J.; Tian, Y.; Wen, L. P.; Jiang, L. Engineered Asymmetric Heterogeneous Membrane: A
Concentration-Gradient-Driven Energy Harvesting Device. J. Am. Chem. Soc. 2015, 137, 14765-14772.
7. Cao, L. X.; Guo, W.; Ma, W.; Wang, L.; Xia, F.; Wang, S. T.; Wang, Y. G.; Jiang, L.;
Zhu, D. B. Towards Understanding the Nanofluidic Reverse Electrodialysis System:
Well Matched Charge Selectivity and Ionic Composition. Energ Environ Sci 2011, 4, 2259-2266.
8. Feng, J. D.; Graf, M.; Liu, K.; Ovchinnikov, D.; Dumcenco, D.; Heiranian, M.;
Nandigana, V.; Aluru, N. R.; Kis, A.; Radenovic, A. Single-Layer Mos2 Nanopores as Nanopower Generators. Nature 2016, 536, 197-200.
9. Mei, L. J.; Yeh, L. H.; Qian, S. Z. Buffer Anions Can Enormously Enhance the Electrokinetic Energy Conversion in Nanofluidics with Highly Overlapped Double Layers. Nano Energy 2017, 32, 374-381.
10. Paik, K. H.; Liu, Y.; Tabard-Cossa, V.; Waugh, M. J.; Huber, D. E.; Provine, J.;
Howe, R. T.; Dutton, R. W.; Davis, R. W. Control of DNA Capture by Nanofluidic Transistors. ACS Nano 2012, 6, 6767-6775.
11. He, Y. H.; Tsutsui, M.; Fan, C.; Taniguchi, M.; Kawai, T. Controlling DNA
Translocation through Gate Modulation of Nanopore Wall Surface Charges. ACS Nano 2011, 5, 5509-5518.
12. Kowalczyk, S. W.; Wells, D. B.; Aksimentiev, A.; Dekker, C. Slowing Down DNA Translocation through a Nanopore in Lithium Chloride. Nano Lett. 2012, 12,
1038-1044.
13. Gu, L. Q.; Shim, J. W. Single Molecule Sensing by Nanopores and Nanopore Devices. Analyst 2010, 135, 441-451.
14. Howorka, S.; Siwy, Z. Nanopores and Nanochannels: From Gene Sequencing to Genome Mapping. ACS Nano 2016, 10, 9768-9771.
15. Ying, Y. L.; Zhang, J. J.; Gao, R.; Long, Y. T. Nanopore-Based Sequencing and Detection of Nucleic Acids. Angew. Chem. Int. Edit. 2013, 52, 13154-13161.
16. Vlassiouk, I.; Kozel, T. R.; Siwy, Z. S. Biosensing with Nanofluidic Diodes. J. Am.
Chem. Soc. 2009, 131, 8211-8220.
17. Ma, Y.; Su, Y. S.; Qian, S. Z.; Yeh, L. H. Analytical Model for
Surface-Charge-Governed Nanochannel Conductance. Sensor Actuat B-Chem 2017, 247, 697-705.
18. Schoch, R. B.; Han, J. Y.; Renaud, P. Transport Phenomena in Nanofluidics. RvMP 2008, 80, 839-883.
19. Ma, Y.; Yeh, L. H.; Lin, C. Y.; Mei, L. J.; Qian, S. Z. pH-Regulated Ionic
Conductance in a Nanochannel with Overlapped Electric Double Layers. Anal. Chem.
2015, 87, 4508-4514.
20. Zangle, T. A.; Mani, A.; Santiago, J. G. Theory and Experiments of Concentration Polarization and Ion Focusing at Microchannel and Nanochannel Interfaces. Chem. Soc.
Rev. 2010, 39, 1014-1035.
21. Yeh, L. H.; Zhang, M.; Qian, S.; Hsu, J. P.; Tseng, S. Ion Concentration Polarization in Polyelectrolyte-Modified Nanopores. J. Phys. Chem. C 2012, 116, 8672-8677.
22. Vlassiouk, I.; Smirnov, S.; Siwy, Z. Ionic Selectivity of Single Nanochannels.
Nano Lett. 2008, 8, 1978-1985.
23. Zeng, Z. P.; Yeh, L. H.; Zhang, M. K.; Qian, S. Z. Ion Transport and Selectivity in Biomimetic Nanopores with pH-Tunable Zwitterionic Polyelectrolyte Brushes.
Nanoscale 2015, 7, 17020-17029.
24. Pietschmann, J. F.; Wolfram, M. T.; Burger, M.; Trautmann, C.; Nguyen, G.;
Pevarnik, M.; Bayer, V.; Siwy, Z. Rectification Properties of Conically Shaped Nanopores: Consequences of Miniaturization. Phys. Chem. Chem. Phys. 2013, 15, 16917-16926.
25. Liu, Q.; Wang, Y.; Guo, W.; Ji, H.; Xue, J.; Ouyang, Q. Asymmetric Properties of Ion Transport in a Charged Conical Nanopore. Phys. Rev. E 2007, 75, 051201.
26. Siwy, Z. S. Ion-Current Rectification in Nanopores and Nanotubes with Broken Symmetry. Adv. Funct. Mater. 2006, 16, 735-746.
27. White, H. S.; Bund, A. Ion Current Rectification at Nanopores in Glass Membranes.
Langmuir 2008, 24, 2212-2218.
28. Nasir, S.; Ali, M.; Ramirez, P.; Gomez, V.; Oschmann, B.; Muench, F.; Tahir, M. N.;
Zentel, R.; Mafe, S.; Ensinger, W. Fabrication of Single Cylindrical Au-Coated
Nanopores with Non-Homogeneous Fixed Charge Distribution Exhibiting High Current Rectifications. ACS Appl. Mater. Inter. 2014, 6, 12486-12494.
29. Tagliazucchi, M.; Rabin, Y.; Szleifer, I. Transport Rectification in Nanopores with Outer Membranes Modified with Surface Charges and Polyelectrolytes. ACS Nano 2013, 7, 9085-9097.
30. Ali, M.; Ramirez, P.; Nguyen, H. Q.; Nasir, S.; Cervera, J.; Mafe, S.; Ensinger, W.
Single Cigar-Shaped Nanopores Functionalized with Amphoteric Amino Acid Chains:
Experimental and Theoretical Characterization. ACS Nano 2012, 6, 3631-3640.
31. Lin, C. Y.; Yeh, L. H.; Hsu, J. P.; Tseng, S. Regulating Current Rectification and Nanoparticle Transport through a Salt Gradient in Bipolar Nanopores. Small 2015, 11, 4594-4602.
32. Zhang, Z.; Kong, X. Y.; Xiao, K.; Xie, G. H.; Liu, Q.; Tian, Y.; Zhang, H. C.; Ma, J.;
Wen, L. P.; Jiang, L. A Bioinspired Multifunctional Heterogeneous Membrane with Ultrahigh Ionic Rectification and Highly Efficient Selective Ionic Gating. Adv. Mater.
2016, 28, 144-150.
33. Han, K. Y.; Heng, L. P.; Wen, L. P.; Jiang, L. Biomimetic Heterogeneous Multiple Ion Channels: A Honeycomb Structure Composite Film Generated by Breath Figures.
Nanoscale 2016, 8, 12318-12323.
34. Yang, C.; Hinkle, P.; Menestrina, J.; Vlassiouk, I. V.; Siwy, Z. S. Polarization of Gold in Nanopores Leads to Ion Current Rectification. J. Phys. Chem. Lett. 2016, 7, 4152-4158.
35. Sa, N. Y.; Lan, W. J.; Shi, W. Q.; Baker, L. A. Rectification of Ion Current in Nanopipettes by External Substrates. ACS Nano 2013, 7, 11272-11282.
36. Peng, R.; Li, D. Q. Electroosmotic Flow in Single Pdms Nanochannels. Nanoscale
2016, 8, 12237-12246.
37. Lan, W. J.; Edwards, M. A.; Luo, L.; Perera, R. T.; Wu, X. J.; Martin, C. R.; White, H. S. Voltage-Rectified Current and Fluid Flow in Conical Nanopores. Acc. Chem. Res.
2016, 49, 2605-2613.
38. Ai, Y.; Zhang, M. K.; Joo, S. W.; Cheney, M. A.; Qian, S. Z. Effects of
Electroosmotic Flow on Ionic Current Rectification in Conical Nanopores. J. Phys.
Chem. C 2010, 114, 3883-3890.
39. Lin, D. H.; Lin, C. Y.; Tseng, S.; Hsu, J. P. Influence of Electroosmotic Flow on the Ionic Current Rectification in a pH-Regulated, Conical Nanopore. Nanoscale 2015, 7, 14023-14031.
40. Hsu, J. P.; Wu, H. H.; Lin, C. Y.; Tseng, S. Importance of Polyelectrolyte
Modification for Rectifying the Ionic Current in Conically Shaped Nanochannels. Phys.
Chem. Chem. Phys. 2017, 19, 5351-5360.
41. Plett, T. S.; Cai, W. J.; Le Thai, M.; Vlassiouk, I. V.; Penner, R. M.; Siwy, Z. S.
Solid-State Ionic Diodes Demonstrated in Conical Nanopores. J. Phys. Chem. C 2017, 121, 6170-6176.
42. Tseng, S. J.; Yang, S. T.; Lin, C. Y.; Hsu, J. P. Ionic Current Rectification in a Conical Nanopore: Influences of Electroosmotic Flow and Type of Salt. J. Phys. Chem.
C 2017.
43. Gamble, T.; Decker, K.; Plett, T. S.; Pevarnik, M.; Pietschmann, J. F.; Vlassiouk, I.;
Aksimentiev, A.; Siwy, Z. S. Rectification of Ion Current in Nanopores Depends on the Type of Monovalent Cations: Experiments and Modeling. J. Phys. Chem. C 2014, 118, 9809-9819.
44. Perez-Mitta, G.; Albesa, A. G.; Molares, M. E. T.; Trautmann, C.; Azzaroni, O. The Influence of Divalent Anions on the Rectification Properties of Nanofluidic Diodes:
Insights from Experiments and Theoretical Simulations. Chemphyschem 2016, 17, 2718-2725.
45. Lin, J.-Y.; Lin, C.-Y.; Hsu, J.-P.; Tseng, S. Ionic Current Rectification in a pH-Tunable Polyelectrolyte Brushes Functionalized Conical Nanopore: Effect of Salt Gradient. Anal. Chem. 2016, 88, 1176-1187.
46. Cao, L. X.; Guo, W.; Wang, Y. G.; Jiang, L. Concentration-Gradient-Dependent Ion Current Rectification in Charged Conical Nanopores. Langmuir 2012, 28, 2194-2199.
47. Kubeil, C.; Bund, A. The Role of Nanopore Geometry for the Rectification of Ionic Currents. J. Phys. Chem. C 2011, 115, 7866-7873.
48. Ramirez, P.; Apel, P. Y.; Cervera, J.; Mafe, S. Pore Structure and Function of Synthetic Nanopores with Fixed Charges: Tip Shape and Rectification Properties.
Nanotechnology 2008, 19, 315707.
49. Tseng, S. J.; Lin, S. C.; Lin, C. Y.; Hsu, J. P. Influences of Cone Angle and Surface Charge Density on the Ion Current Rectification Behavior of a Conical Nanopore. J.
Phys. Chem. C 2016, 120, 25620-25627.
50. Hsu, J. P.; Wu, H. H.; Lin, C. Y.; Tseng, S. Ion Current Rectification Behavior of Bioinspired Nanopores Having a pH-Tunable Zwitterionic Surface. Anal. Chem. 2017, 89, 3952-3958.
51. Bhattacharya, S.; Muzard, J.; Payet, L.; Mathe, J.; Bockelmann, U.; Aksimentiev, A.; Viasnoff, V. Rectification of the Current in Alpha-Hemolysin Pore Depends on the Cation Type: The Alkali Series Probed by Molecular Dynamics Simulations and Experiments. J. Phys. Chem. C 2011, 115, 4255-4264.
52. Lin, C. Y.; Chen, F.; Yeh, L. H.; Hsu, J. P. Salt Gradient Driven Ion Transport in Solid-State Nanopores: The Crucial Role of Reservoir Geometry and Size. Phys. Chem.
Chem. Phys. 2016, 18, 30160-30165.
53. Steinbock, L. J.; Lucas, A.; Otto, O.; Keyser, U. F. Voltage-Driven Transport of Ions and DNA through Nanocapillaries. Electrophoresis 2012, 33, 3480-3487.
Table 1-1. Summary of the boundary conditions assumed surface Poisson Nernst-Planck Navier-Stokes
(not in scale) 1 axial symmetry axial symmetry axial symmetry
2
grounded
0 bulk concentration
bulk
ci C
no external pressure gradient
0 p 8
applied voltage V0
3, 7
charge free
0
n
zero normal flux
i 0
n N
slip
4,5,6
surface charge density specified
f s
n
ion-impenetrable
i 0
n N
nonslip
u 0
Figure 1-1. Schematic representation of the ion transport through a charged conical nanopore of tip radius Rtip, base radius Rbase, and length Ln connecting two large, identical reservoirs filled with an aqueous salt solutoin. V0 is the voltage bias applied across the nanopore with the electrode in the upper reservoir grounded.
-2 -1 0 1 2 -1.0
-0.5 0.0 0.5
KCl NaCl LiCl
I (nA)
V0 (V) (a)
-2 -1 0 1 2
-4 -3 -2 -1 0 1
KCl NaCl LiCl
(b)
I (nA)
V0 (V)
-2 -1 0 1 2
-12 -8 -4 0
(c) 4
V0 (V)
KCl NaCl LiCl
I (nA)
-2 -1 0 1 2
-5 -4 -3 -2 -1 0 1
KCl NaCl LiCl
(d)
I (nA)
V0 (V)
Figure 1-2. Current-voltage curves for various salt solutions at various combinations of bulk salt concentration Cbulk and half cone angle at R tip 6 nm. (a)
bulk 3 mM
C and 0.5; (b) Cbulk 3 mM and ; (c) 1 Cbulk 3 mM and
; (d) 5 Cbulk 100 mM and . 1
0.0 0.5 1.0 1.5 2.0 2.5 1.0
1.5 2.0 2.5 3.0
KCl NaCl LiCl
|V0| (V) (a)
Rf
0.0 0.5 1.0 1.5 2.0 2.5
1 2 3 4 5 6
KCl NaCl LiCl
(b)
Rf
|V0| (V)
0.0 0.5 1.0 1.5 2.0 2.5
1 2 3 4 5 6
KCl NaCl LiCl
(c)
Rf
|V0| (V) 0.0 0.5 1.0 1.5 2.0 2.5
1 2 3 4 5 6
(d) 7
Rf
|V0| (V) KCl
NaCl LiCl
Figure 1-3. Current rectification ratio, R , as a function of the magnitude of the f applied voltage, V0 , for various salt solutions at various combinations of the bulk salt concentration Cbulk and the half cone angle at Rtip 6 nm. (a) Cbulk 3 mM and
0.5; (b) Cbulk 3 mM and ; (c) 1 Cbulk 3 mM and ; (d) 5
bulk 100 mM
C and . 1
-6000 -5000 -4000 -3000 -2000 -1000 0 1000 -40
0 40 80 120 160
(a)
z (nm)
C avg (mM)
KCl NaCl LiCl
-6000 -5000 -4000 -3000 -2000 -1000 0 1000 -100
0 100 200 300
(b)400
z (nm)
C avg (mM)
KCl NaCl LiCl
-6000 -5000 -4000 -3000 -2000 -1000 0 1000 -40
0 40 80 120 160 200
(c)240
z (nm)
C avg (mM)
KCl NaCl LiCl
-6000 -5000 -4000 -3000 -2000 -1000 0 1000 -100
0 100 200 300 400 500 600
(d)700
KCl NaCl LiCl
C avg (mM)
z (nm)
Figure 1-4. Axial variations in the cross sectional averaged concentration difference Cavg
at Cbulk 3 mM and Rtip 6 nm for various combinations of the half cone
angle and the applied voltage bias V . (a) 0 0.5 and V 0 0.5 V (b)
0.5 and V 0 1.5 V, (c) and 5 V 0 0.5 V, (d) and 5
0 1.5 V V .
-6000 -5000 -4000 -3000 -2000 -1000 0 1000 -1.6
-1.2 -0.8 -0.4 0.0 0.4
KCl NaCl LiCl
(V)
(a)
z (nm)
-6000 -5000 -4000 -3000 -2000 -1000 0 1000 -1.6
-1.2 -0.8 -0.4 0.0 0.4
z (nm) (b)
KCl NaCl LiCl
(V)
-6000 -5000 -4000 -3000 -2000 -1000 0 1000 -1.6
-1.2 -0.8 -0.4 0.0 0.4
z (nm) (c)
KCl NaCl LiCl
(V)
Figure 1-5. Axial variation of the cross sectional averaged electric potential at
0 1.5 V
V and Rtip 6 nmunder various conditions. (a) Cbulk 3 mM and ; 1 (b) Cbulk 100 mM and ; (c) 1 Cbulk 3 mM and . 5
0.0 0.5 1.0 1.5 2.0 2.5 1
2 3 4
(a) 5
KCl NaCl LiCl Rf
|V0| (V)
0.0 0.5 1.0 1.5 2.0 2.5
1.0 1.5 2.0 2.5
|V0| (V) Rf
(b)
KCl NaCl LiCl
0.0 0.5 1.0 1.5 2.0 2.5
1.0 1.1 1.2
(c)1.3
|V0| (V) Rf
KCl NaCl LiCl
Figure 1-6. Variation of the current rectification ratio Rf with the magnitude of the applied voltage V for various salts. (a): 0 Rtip 6 nm, Cbulk 10 mM, and 0.5;
(b): Rtip 15 nm, Cbulk 10 mM, and 0.5; (c): Rtip 30 nm, Cbulk 100 mM, and . 5