ORIGINAL REPORT
J Rehabil Med 40 © 2008 The Authors. doi: 10.2340/16501977-0230
Objective: To help clinicians and researchers interpret change scores of the simplified Stroke Rehabilitation Assessment of Movement measure, we estimated the minimal detectable change of the 3 subscales (including upper-limb movements, lower-limb movements, and mobility) of the measure. Design and patients: The measure was tested on 102 patients with chronic stroke by a single rater twice, with a 7–14-day interval for the test-retest study, and on 54 patients with sub-acute stroke by 2 raters twice, with a 2-day interval for the inter-rater study.
Methods: The minimal detectable change was calculated on the basis of standard error of measurement. Furthermore, the intraclass correlation coefficient was used to examine the agreement between test and retest and between different raters.
Results: The minimal detectable changes were from 12.5 to 13.2 points for the 3 subscales in the test-retest study and from 16.6 to 18.5 points in the inter-rater study. The test-retest agreement and the inter-rater agreement were suffi-cient (intraclass correlation coeffisuffi-cient = 0.88–0.96).
Conclusion: The minimal detectable changes of the simpli-fied Stroke Rehabilitation Assessment of Movement measure are useful for both clinicians and researchers to determine whether the change score of an individual patient is real.
Key words: stroke, arm, movement, psychometrics.
J Rehabil Med 2008; 40: 615–619
Correspondence address: Ching-Lin Hsieh, School of Occupational Therapy, College of Medicine, National Taiwan University, 4th Floor, 17, Xuzhou Rd., Taipei 100, Taiwan. E-mail: [email protected]
Submitted January 28, 2008; accepted April 7, 2008 INTRoduCTIoN
Motor and mobility deficits are common in patients after stroke and seriously interfere with their activities of daily living (AdL) (1). Although several measures are available to assess the motor and mobility function of patients with stroke, the measurement error of the measures remains largely unknown, thus limiting their interpretability (2, 3).
For estimating measurement error between repeated meas-urements (called random error), minimal detectable change (MdC), or so-called “smallest real difference”, is proposed (4). The MdC is the smallest threshold of change scores that are detectable and beyond random error at a certain level of confidence (usually 95%) (5). Both clinicians and research-ers can use the MdC as a threshold to determine whether the changed score on a measure of an individual patient has reached a real improvement (or deterioration) or is due to the measurement error. Thus the MdC of a measure is critical to interpret data in clinical or research settings.
The Stroke Rehabilitation Assessment of Movement measure (STREAM) was developed to evaluate the motor and basic mobility function of patients after stroke. The STREAM has 3 10-item subscales, including upper-limb movements, lower-limb movements, and mobility subscales (6). To improve the efficiency of administration, the 15-item Simplified STREAM (S-STREAM) was developed with sufficient psychometric properties (including Rasch reliability, concurrent validity, predictive validity, and responsiveness) (7, 8). These observa-tions indicate that the S-STREAM shows promise in measuring motor and mobility deficits for patients with stroke. However, the MdC of the S-STREAM is largely unknown; a defect which limits its utility.
The purpose of this study was to estimate the MdC of the 3 subscales of the S-STREAM in patients after stroke, using a commonly-used confidence level at 95% for the MDC. We estimated the MdCs of the S-STREAM administered by a single rater (test-retest) and by different raters (inter-rater). In addition, we examined the test-retest agreement and inter-rater agreement of the S-STREAM.
METHoDS Participants
Test-retest approach. Patients were recruited from the departments of Physical Medicine and Rehabilitation at 2 hospitals in Taiwan. The following criteria were used to determine whether patients could be included in this study: (i) stroke onset more than 6 months prior to the start of the study (i.e. stable patients); (ii) able to follow simple instruc-tions without severe cognitive deficits; (iii) absence of other major
THE MINIMAL DETECTABLE CHANGE oF THE SIMPLIFIED STRoKE
REHABILITATIoN ASSESSMENT oF MoVEMENT MEASURE
Wen-Shian Lu, MS
1, Chun-Hou Wang, BS
2, Jau-Hong Lin, PhD
3, Ching-Fan Sheu, PhD
4and
Ching-Lin Hsieh, PhD
5From the 1Department of Occupational Therapy, Chung Shan Medical University, 2Department of Physical Therapy, Chung Shan Medical University and Department of Physical Therapy Chung Shan Medical University Rehabilitation Hospital, 3Faculty of Physical Therapy, Kaohsiung Medical University, 4 Institute of Education, National Cheng Kung University, 5School of Occupational Therapy, College of Medicine, National Taiwan University and Department of
deficits (e.g. brain tumour, fracture, amputation, or severe rheumatoid arthritis) that would reduce or limit a subject’s ability to perform move-ments. The study was approved by local ethics committees. Inter-rater approach. The data were obtained from a previous study examining inter-rater reliability of the STREAM (9). Patients who met the diagnosis of cerebral haemorrhage or cerebral infarction and were admitted to the departments of Physical Medicine and Rehabilitation at a hospital in Taiwan were recruited using the same criteria as those in the test-retest except for the first criterion.
All participants gave informed consent prior to their inclusion in the study. demographic and diagnostic information about participants was collected from medical records.
Procedure
Test-retest approach. The STREAM was administered by a trained rater twice at an interval of 1–2 weeks to patients in stable conditions in each of the 2 hospitals. To ensure that the patients’ conditions were stable during the study periods, we excluded patients who developed recurrent strokes or other medical conditions that might result in patients’ poorer performances in motor or mobility function during the test-retest periods.
Inter-rater approach. The STREAM was administered to the same patient by 2 physical therapists in a random order in the same physi-cal environment within a 2-day period (9). The 2-day period was established to minimize the effect of a possible spontaneous recovery, a confounding variable that could affect the result. Both physical therapists were blinded to the results of each other’s assessments during the study period.
Prior to the study, the raters familiarized themselves with the STREAM and its clinical application (9). Both raters reviewed the original literature describing the test and received 2 h of in-service training on the administration of the measure. To improve the raters’ efficiency we asked both raters to use this measure daily in their clinical practice for at least one week before participating in the study. Measure. The 15-item S-STREAM was developed on the basis of the original 30-item STREAM, expert opinions andRasch analysis (7). The 15 items are equally distributed among the 3 subscales and are listed in Appendix I. The limb movement items are scored on a 3-point scale (0 = unable to perform the test movement, 1 = able to perform the test movement only partially, and 2 = able to complete the test movement). Mobility items are scored on a 4-point scale (0 = unable to perform the test movement, 1 = able to perform the test movement only par-tially, 2 = able to complete the test movement with a mobility aid, and 3 = able to complete the test movement without an aid). Furthermore, the ordinary raw scores of the S-STREAM can be transformed into interval Rasch scores using a computer program (available from http:// homepage.ntu.edu.tw/~clhsieh/s-stream/) (7). For easier interpretation, the possible Rasch score of each subscale was further transformed to 0–100 (7). Higher scores indicate better performance.
The Barthel Index (BI) was used to indicate ADL function in our participants (10). The BI has 10 items of fundamental ADL: feeding, grooming, bathing, dressing, bowel and bladder care, toilet use, am-bulation, transfer, and stair climbing. The total score ranges from 0 to 20 (11), with higher scores implying greater independence in basic ADL function. The reliability, validity, and responsiveness of the BI in patients after stroke are well validated (12, 13).
Data analysis. All the data for the S-STREAM were retrieved from the patients’ scores on the STREAM. The Rasch transformed score for each subscale of the S-STREAM (7) was used for data analyses.
MdC based on the standard error of measurement (SEM) is calcu-lated using the following formula (14):
MdC = z-score level of confidence × √2 × SEM
SEM = Sd all testing scores× √ (1-r)
In these formulae, the z-score represents the confidence interval (CI)
The Sd means the standard deviation of all scores of the 2 assess-ments, and r is the coefficient of the test-retest or inter-rater reliability, which is estimated by the intraclass correlation coefficient (ICC). The multiplier of √2 indicates the additional uncertainty caused by the use of different scores from measurements at 2 time-points.
The ICC was employed to examine the extent of agreement between repeated measurements rated twice by the same rater (test-retest) or by the 2 raters individually (inter-rater). A random effect 2-way ANoVA was employed to compute the variance needed to estimate the inter-rater or test-retest reliability (15). An ICC value of more than 0.80 indicates high reliability (16).
In addition, the agreement between test-retest measurements can be visualized by Bland-Altman plots with 95% limits of agreement (LoA) (17). In these plots, the differences (d) between each pair of observations are presented against the average value for each pair of observations. Assuming that differences follow the standard normal distribution, 95% of the differences will lie between d ± 1.96 × Sd (i.e. LoA), where Sd represents the standard deviation of differences.
RESuLTS
Test-retest approach
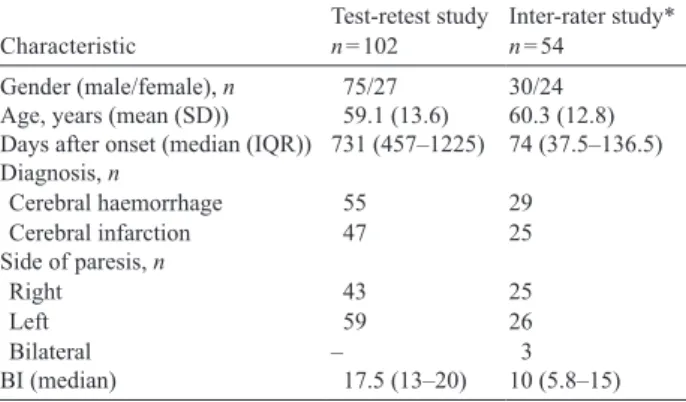
A total of 102 patients after stroke completed both assessments. Their mean age was approximately 60 years, and 63% of the patients were male. The median length of time after stroke onset of these subjects was approximately 2 years, which indicates that they were in the chronic stage of stroke. The BI scores indicate that most of the patients had mild disability. Further information on the characteristics of the patients is shown in Table I.
Table II shows the Rasch transformed scores of the 102 pa-tients rated twice by the rater with the S-STREAM. The mean differences of the Rasch transformed scores were –0.1, –0.4 and –0.1 points for the upper-limb movement subscale, lower-limb movement subscale and mobility subscale, respectively. The MdCs were 13.5, 13.2 and 12.5 points, correspondingly. The magnitude of MDCs around 13% in proportion to the possible scores of the S-STREAM indicates limited random measurement errors (18).
The ICCs for the 3 subscales were ≥ 0.95, indicating very high test-retest reliability. In Figs 1–3 the differences of scores are plotted against mean scores of the 2 sessions (17). The
Table I. Characteristics of the patients after stroke
Characteristic Test-retest studyn = 102 Inter-rater study*n = 54 Gender (male/female), n 75/27 30/24
Age, years (mean (Sd)) 59.1 (13.6) 60.3 (12.8) days after onset (median (IQR)) 731 (457–1225) 74 (37.5–136.5) diagnosis, n Cerebral haemorrhage Cerebral infarction 5547 2925 Side of paresis, n Right Left Bilateral 43 59 – 25 26 3 BI (median) 17.5 (13–20) 10 (5.8–15) *Part of the data had been reported previously (9).
LoAs of the 3 subscales ranged from 13.6 to –13.8 for the upper-limb subscale, 12.9 to –13.7 for the lower-limb subscale and 12.6 to –12.8 for the mobility subscale.
Inter-rater approach
A total of 54 patients after stroke were recruited to this study. Their mean age was approximately 60 years, and 56% were male. The median length of time after stroke onset of these subjects was approximately 75 days, which indicates that they were in the sub-acute stage. The BI scores indicate that most of the patients had moderate disability. Further information about the characteristics of the patients is shown in Table I.
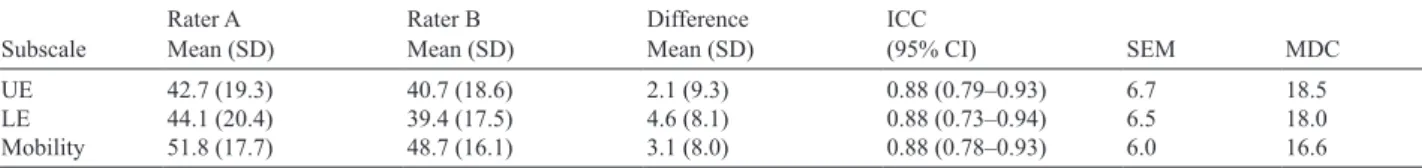
Table III shows the Rasch transformed scores of the S-STREAM of the 54 patients rated twice by the 2 raters. The mean differences of the Rasch transformed scores were 2.1, 4.6 and 3.1 points for the upper-limb subscale, lower-limb subscale, and mobility subscale, respectively. The MdCs were 18.5, 18.0 and 16.6 points, correspondingly, indicating acceptable random measurement errors (4).
In addition, the ICCs for the 3 subscales were ≥ 0.88, indi-cating high inter-rater reliability.
Table II. Test-retest reliability indices of the simplified Stroke Rehabilitation Assessment of Movement (S-STREAM) instrument (n = 102) Subscale First testMean (Sd) Second testMean (Sd) differenceMean (Sd) ICC(95% CI) SEM MdC
uE 51.6 (21.5) 51.5 (21.4) –0.1 (7.0) 0.95 (0.92–0.96) 4.9 13.5
LE 52.7 (22.0) 52.3 (21.9) –0.4 (6.8) 0.95 (0.93–0.97) 4.7 13.2
Mobility 59.9 (26.7) 59.8 (21.9) –0.1 (6.5) 0.96 (0.94–0.97) 4.5 12.5
UE: upper extremity; LE: lower extremity; ICC: intraclass correlation coefficient; CI: confidence interval; SEM: standard error or measurement; Sd: standard deviation; MdC: minimal detectable change.
Fig. 1. Bland-Altman method for plotting the differences in scores against the mean scores of the upper-limb movement subscale of the Simplified Stroke Rehabilitation Assessment of Movement measure (S-STREAM). The 2 bold lines define the limits of agreement (mean of difference ± 1.96 × Sd).
Fig. 2. Bland-Altman method for plotting the differences in scores against the mean scores of the lower-limb movement subscale of the Simplified Stroke Rehabilitation Assessment of Movement measure (S-STREAM). The 2 bold lines define the limits of agreement (mean of difference ± 1.96 × Sd).
dISCuSSIoN
In clinical settings, evaluations of a patient’s condition are rou-tinely administered every week to every 2 weeks. A therapist evaluates the progress and modifies a treatment programme based on the results of evaluations. Because random errors exist in any kind of measurement, however, a difference in evaluations of characteristics could be viewed as a real change only when it is beyond the range of random error. In the test-retest study, we found that the MdCs of the 3 subscales were 13.5, 13.2 and 12.5 points for the upper-limb movement sub-scale, lower-limb movement subsub-scale, and mobility subsub-scale, respectively. This finding means that only a change between 2 concessive measurements rated by a same rater greater than 13.5 points (e.g. for upper-limb movement) can be interpreted with 95% certainty as a real change.
Furthermore, the MdC can be viewed as the safest threshold for identifying statistically significant individual changes (3). That is to say, a score variation of a measure on an individual patient between concessive measurements greater than the MDC can be regarded as a change with statistical significance. Accordingly, we can use the MdC to determine whether an individual patient has made a significant improvement in clinical settings.
The MDC can be modified for a group comparison (for research purposes), depending on the size of the group (n), as follows (19):
MdCgroup = MdCindividual ÷ √n
However, in research contexts, the MDCgroup is seldom a concern if the sample size of a study is substantial. For exam-ple, if the MdCindividual for the upper-limb movement subscale is 13.5 points, the MdCgroup will be 2.4 (for sample size = 30), which is too small to be a concern.
A researcher can use MdCindividual as a threshold to present the proportion of the study group that achieves a real change (2). Researchers usually report the mean difference of the study group in regard to the changes. However, these results are always confusing to clinicians because they do not guarantee that all the patients have achieved significant improvement. That is to say, even though the mean changes within a study group are significant, the individual change of a substantial proportion of the study group might not achieve MdCindividual. Thus, reporting the proportion of patients who have achieved improvement beyond MdCindividual helps researchers translate research findings into clinical contexts.
The ICC represents the extent of consistency between 2 assessments (20, 21). We found that ICCs for the test-retest agreement of the 3 subscales of the S-STREAM are high. In addition, the Bland-Altman plots show only small and indistinctive deviations from 0, indicating that no systematic differences in scores emerged between the 2 sessions of as-sessments. The plots also show that the mean scores of assess-ments scatter entirely within the ranges of the 3 subscales of the S-STREAM, implying that the subjects have a wide range of motor and mobility deficits. These results support that the S-STREAM is reliable in monitoring the changes of motor and mobility performances of patients after stroke over time when administered by trained raters.
The MdCs of the 3 subscales for inter-rater investigation were 18.5 points for the upper-limb subscale, 18.0 points for the lower-limb subscale, and 16.6 points for the mobility subscale. As expected, the MdCs obtained from the different raters were higher than those obtained from an individual rater. These val-ues could help clinicians and researchers to judge whether the changes after therapy are in fact manifested in motor functions when the assessments are administered by different raters.
Any measure needs extensive examination to further under-stand its particular strengths and limitations (22). The scale also has to be extensively tested in clinical settings. In this study, we estimated the MdC of the S-STREAM, representing a change beyond random error, or reaching statistical significance (3). However, the minimal important difference (MID) (23), which represents a change that is meaningful to patients, is also criti-cal for decision-making in clinicriti-cal settings. To further promote the utility of the S-STREAM, future research to estimate the MId for the S-STREAM is warranted.
In brief, our results show that the S-STREAM has appropri-ate MdC, test-retest reliability, and inter-rappropri-ater reliability for cli-nicians and researchers to apply it in monitoring changes over time in patients with stroke. The MdCs of the S-STREAM, obtained from either a single rater or different raters, are use-ful for future users to determine whether the change score is beyond random error.
ACKNoWLEDGEMENTS
This study was supported by research grants from the National Science Council (NSC96-2314-B-002-168-MY2), the National Health Research Institutes (NHRI-EX96-9512PI) and the National Taiwan University Hospital (96-S633).
Table III. Inter-rater reliability indices of the simplified Stroke Rehabilitation Assessment of Movement (S-STREAM) instrument (n = 54) Subscale Rater AMean (Sd) Rater BMean (Sd) differenceMean (Sd) ICC(95% CI) SEM MdC
uE 42.7 (19.3) 40.7 (18.6) 2.1 (9.3) 0.88 (0.79–0.93) 6.7 18.5
LE 44.1 (20.4) 39.4 (17.5) 4.6 (8.1) 0.88 (0.73–0.94) 6.5 18.0
Mobility 51.8 (17.7) 48.7 (16.1) 3.1 (8.0) 0.88 (0.78–0.93) 6.0 16.6
REFERENCES
1. Shaughnessy M, Michael KM, Sorkin JD, Macko RF. Steps after stroke: capturing ambulatory recovery. Stroke 2005; 36: 1305–1307.
2. Haley SM, Fragala-Pinkham MA. Interpreting change scores of tests and measures used in physical therapy. Phys Ther 2006; 86: 735–743.
3. Jette AM, Tao W, Norweg A, Haley S. Interpreting rehabilitation outcome measurements. J Rehabil Med 2007; 39: 585–590. 4. Flansbjer UB, Holmback AM, Downham D, Patten C, Lexell
J. Reliability of gait performance tests in men and women with hemiparesis after stroke. J Rehabil Med 2005; 37: 75–82. 5. Schreuders TA, Roebroeck ME, Goumans J, van Nieuwenhuijzen
JF, Stijnen TH, Stam HJ. Measurement error in grip and pinch force measurements in patients with hand injuries. Phys Ther 2003; 83: 806–815.
6. Daley K, Mayo N, Wood-Dauphinee S. Reliability of scores on the Stroke Rehabilitation Assessment of Movement (STREAM) measure. Phys Ther 1999; 79: 8–19.
7. Hsueh IP, Wang WC, Wang CH, Sheu CF, Lo SK, Lin JH, et al. A simplified stroke rehabilitation assessment of movement instru-ment. Phys Ther 2006; 86: 936–943.
8. Hsieh YW, Lin JH, Wang CH, Sheu CF, Hsueh IP, Hsieh CL. discriminative, predictive and evaluative properties of the simpli-fied stroke rehabilitation assessment of movement instrument in patients with stroke. J Rehabil Med 2007; 39: 454–460. 9. Wang CH, Hsieh CL, Dai MH, Chen CH, Lai YF. Inter-rater
reliability and validity of the stroke rehabilitation assessment of movement (STREAM) instrument. J Rehabil Med 2002; 34: 20–24.
10. Mahoney FI, Barthel DW. Functional evaluation: the Barthel Index. Md State Med J 1965; 14: 61–65.
11. Collin C, Wade DT, Davies S, Horne V. The Barthel ADL Index: a reliability study. Int disabil Stud 1988; 10: 61–63.
12. Hsueh IP, Lee MM, Hsieh CL. Psychometric characteristics of the Barthel activities of daily living index in stroke patients. J Formos Med Assoc 2001; 100: 526–532.
13. Hsueh IP, Lin JH, Jeng JS, Hsieh CL. Comparison of the psycho-metric characteristics of the functional independence measure, 5 item Barthel index, and 10 item Barthel index in patients with stroke. J Neurol Neurosurg Psychiatry 2002; 73: 188–190. 14. Chen HM, Hsieh CL, Sing Kai L, Liaw LJ, Chen SM, Lin JH.
The test-retest reliability of 2 mobility performance tests in pa-tients with chronic stroke. Neurorehabil Neural Repair 2007; 21: 347–352.
15. Shrout PE, Fleiss JL. Intraclass correlations: uses in assessing rater reliability. Psychological Bulletin 1979; 86: 420–428.
16. Prince B, Makrides L, Richman J. Research methodology and ap-plied statistics. Part 2: the literature search. Physiother Can 1980; 32: 201–206.
17. Bland JM, Altman DG. Statistical methods for assessing agreement between two methods of clinical measurement. Lancet 1986; 1: 307–310.
18. Smidt N, van der Windt DA, Assendelft WJ, Mourits AJ, Deville WL, de Winter AF, et al. Interobserver reproducibility of the as-sessment of severity of complaints, grip strength, and pressure pain threshold in patients with lateral epicondylitis. Arch Phys Med Rehabil 2002; 83:1145–1150.
19. de Vet HC, Bouter LM, Bezemer PD, Beurskens AJ. Reproduc-ibility and responsiveness of evaluative outcome measures. Theoretical considerations illustrated by an empirical example. Int J Technol Assess Health Care 2001; 17: 479–487.
20. Benaim C, Perennou DA, Villy J, Rousseaux M, Pelissier JY. Validation of a standardized assessment of postural control in stroke patients: the Postural Assessment Scale for Stroke Patients (PASS). Stroke 1999; 30: 1862–1868.
21. Mao HF, Hsueh IP, Tang PF, Sheu CF, Hsieh CL. Analysis and comparison of the psychometric properties of three balance meas-ures for stroke patients. Stroke 2002; 33: 1022–1027.
22. Dodds TA, Martin DP, Stolov WC, Deyo RA. A validation of the functional independence measurement and its performance among rehabilitation inpatients. Arch Phys Med Rehabil 1993; 74: 531–536.
23. Schunemann HJ, Guyatt GH. Commentary – goodbye M(C)ID! Hello MID, where do you come from? Health Serv Res 2005; 40: 593–597.
APPENDIX I. The 15 items of the Simplified Stroke Rehabilitation Assessment of Movement measure
5 items of the upper-limb movement subscale: • Elbow extension while lying in a supine position • Scapular protraction
• Making a fist
• Raising arm to fullest elevation • Fingers total extension
5 items of the lower-limb movement subscale: • Knee extension while sitting
• Hip flexion while sitting • Knee flexion while sitting • Plantarflexion while sitting • Dorsiflexion while standing 5 items of the mobility subscale:
• Rolling • Supine to sitting • Sitting to standing • 10-m walk