行政院國家科學委員會專題研究計畫 成果報告
使用三倍頻發射相位法於超音波組織諧波強度之調變(I) 研究成果報告(精簡版)
計 畫 類 別 : 個別型
計 畫 編 號 : NSC 96-2221-E-011-143-
執 行 期 間 : 96 年 08 月 01 日至 97 年 07 月 31 日 執 行 單 位 : 國立臺灣科技大學電機工程系
計 畫 主 持 人 : 沈哲州
計畫參與人員: 碩士班研究生-兼任助理人員:謝依峻 碩士班研究生-兼任助理人員:王鴻偉 碩士班研究生-兼任助理人員:陳韋廷 碩士班研究生-兼任助理人員:邱奕元 碩士班研究生-兼任助理人員:楊運乾
報 告 附 件 : 出席國際會議研究心得報告及發表論文
處 理 方 式 : 本計畫涉及專利或其他智慧財產權,2 年後可公開查詢
中 華 民 國 97 年 07 月 17 日
行政院國家科學委員會補助專題研究計畫成果報告
使用三倍頻發射相位法於超音波組織諧波強度之調變(I)
計畫類別:■ 個別型計畫 □ 整合型計畫 計畫編號:NSC 96-2221-E-011-143
執行期間: 96 年 8 月 1 日至 97 年 7 月 31 日
計畫主持人:沈哲州 共同主持人:
計畫參與人員:謝依峻 王鴻偉 陳偉廷 邱奕元 楊運乾
成果報告類型(依經費核定清單規定繳交):■精簡報告 □完整報告
本成果報告包括以下應繳交之附件:
□赴國外出差或研習心得報告一份
□赴大陸地區出差或研習心得報告一份
■出席國際學術會議心得報告及發表之論文各一份
□國際合作研究計畫國外研究報告書一份
處理方式:除產學合作研究計畫、提升產業技術及人才培育研究計畫、
列管計畫及下列情形者外,得立即公開查詢
□涉及專利或其他智慧財產權,□一年■二年後可公開查詢
執行單位:台灣科技大學電機系
中 華 民 國 97 年 7 月 3 日
行政院國家科學委員會專題研究計畫成果報告
使用三倍頻發射相位法於超音波組織諧波強度之調變(I)
計畫編號:NSC 96-2221-E-011-143 執行期限:96 年 8 月 1 日至 97 年 7 月 31 日 主持人:沈哲州 國立台灣科技大學電機系
一、中文摘要
本研究是對醫學超音波影像中的組織 諧波信號相關問題進行討論。當聲波穿越 人體時會因有限振幅失真現象使得組織諧 波信號逐漸累積產生,組織諧波的特色是 其信號強度微弱而影響影像的靈敏度以及 穿透度﹔但對於對比劑諧波影像而言過強 的組織諧波信號反而會影響微氣泡區域的 影像對比,因此抑制組織諧波的技術也有 其必要性。在本論文中我們提出"三倍頻 發射相位法"以調整第二組織諧波信號的 強度,其原理是藉由改變頻率合成分與頻 率差成分之間的相位差以增強或者抑制組 織諧波信號。由實驗與模擬的結果來看,
利用三倍頻發射相位法來增強組織諧波可 以有效提升諧波信號強度且不會造成對比 解析度的下降,組織諧波的抑制方面雖然 會使波束的旁瓣上升但並不會影響到對比 劑諧波影像中因背景組織諧波強度下降所 造成的的影像對比提升。
關鍵詞:超音波影像、組織諧波、三倍頻 發射相位法、對比劑諧波影像
Abstract
Tissue harmonic imaging suffers from low signal-to-noise ratio (SNR) under typical imaging conditions. On the contrary, presence of strong tissue harmonics also degrades microbubble detection in contrast harmonic imaging. Therefore, a novel approach for both enhancement and suppression of tissue harmonic signal is developed by phasing transmit signal at 3f0
frequency. Results indicate that the relative phasing between the frequency-sum component and the frequency-difference component markedly changes the amplitude of the second harmonic signal over a wide range of axial depths. For harmonic enhancement, approximate 6 dB increase of second harmonic amplitude can be achieved with improved lateral harmonic beam pattern.
For harmonic suppression, the second harmonic signal can be significantly reduced by about 11 dB. Hence, the method of 3f0
transmit phasing has potentials both for improving SNR in tissue harmonic imaging and for enhancing image contrast in contrast agent imaging by suppression of tissue harmonic background.
Keywords: tissue harmonic; contrast agents;
contrast imaging; harmonic suppression;
harmonic enhancement 二、緣由與目的
Tissue harmonic generation relies on finite amplitude distortion of propagating waveform and is characterized by the generation of harmonic signals at multiples of the original transmit frequency [1, 2].
Tissue harmonic imaging which is based on backscattered tissue harmonic signal has become popular due to its clinically superior image quality even on technically difficult bodies because of the reduced reverberation artifact and sidelobes level [3]. Therefore, contrast resolution can be significantly improved in tissue harmonic imaging.
One major limitation of tissue harmonic imaging is low signal-to-noise ratio (SNR).
Under current safety regulations, the harmonic amplitude is generally much lower than its linear counterpart under typical imaging conditions [4]. The harmonic amplitude is even lower outside the focal zone, especially in the near field where there is not enough accumulation and acoustic energy for finite amplitude distortion to generate sufficient harmonics. Consequently, both penetration and sensitivity of tissue harmonic imaging are limited because of low SNR. Several methods have been proposed to enhance the tissue harmonic signal such as coded excitation [5].
Tissue harmonic signal also plays an important role in detecting microbubble contrast agents. In contrast harmonic imaging, the contrast-to-tissue ratio (CTR) is sometimes limited by significant tissue harmonic signal especially with a higher mechanical index (MI). Hence, power Doppler technique is usually combined with harmonic imaging for better sensitivity and specificity of contrast detection at the cost of reduced frame rate [6]. In addition, the flash artifact associated with color Doppler imaging can also be a problem. To increase the CTR without using Doppler techniques, a prebiased transmit scheme was proposed to null the tissue harmonic signal at certain depth in the background [7]. However, its implementation would be clinically difficult since the prebiased transmit pulse must be estimated by back-propagating the measured tissue harmonic signal at the nulling zone.
In this work, a novel method, the 3f0
transmit phasing, is studied for either SNR enhancement in tissue harmonic imaging or CTR improvement in contrast harmonic imaging.
三、理論與方法
The mechanism of tissue harmonic generation can be formulated using the frequency domain solution to Burgers’
equation [4]:
where the fundamental frequency is f and β is a nonlinearity parameter of the propagating medium. The symbol c is the sound velocity and the symbol ∂un denotes the incremental sound field at nf frequency after propagation for a distance of ∂z due to the finite-amplitude-distortion-based harmonic generation. In (1), when two sinusoids are multiplied, they generate tissue harmonics whose frequencies are the sum and difference of the original frequencies. The first summation term in the right-hand side within the parenthesis represents the contribution of sinusoid pairs whose sum-frequency is nf. On the other hand, the second summation term comprises of sinusoid pairs whose difference-frequency is nf. They are referred to as the frequency-sum component and the frequency-difference component of tissue harmonic signal, respectively. Note that both the frequency-sum component and the frequency-difference component are sensitive to the phase of their constitutive spectral signals. Therefore, tissue harmonic generation can be enhanced when the two components are in-phase and being constructively summed together. Otherwise, they may cancel out each other and result in reduced tissue harmonic amplitude.
For second harmonic signal, the frequency-difference component can be produced from the spectral interaction between the fundamental signal and the signal at 3f0 frequency. In this case, phase of the frequency-sum component is 2φf when the fundamental transmit signal is modeled as exp(j2πf0t+φf). The symbol φf is the fundamental transmit phase. On the other hand, phase of the frequency-difference component will be θ provided that the 3f0
transmit signal is modeled as exp(j2π(3f0)t+θ+φf). The symbol θ represents the relative phase between the 3f0
transmit signal and the fundamental transmit signal. By applying these conditions into (1),
. ) 2 (
1
1
'*
' '
'
2
∑
−∑
= − + = −
∂ =
∂ n
k
N
n k
n k k k
n k
n kuu nu u
c j f z
u βπ
(1)
it can be shown that the phase of the frequency-sum and the frequency-difference component can be 180° out of phase for second harmonic suppression with the following phase relation:
Similarly, for the enhancement of second harmonic amplitude, the two components should be in-phase to be constructively combined:
Experimental methods
Hydrophone measurements were performed to study effects of 3f0 transmit phasing on second harmonic generation. An
arbitrary function generator (Hewlett-Packard, Palo Alto, CA, U.S.A.)
was used to generate the transmit pulse which contains both a 1.25-MHz fundamental sinusoid and a 3.75-MHz 3f0 sinusoid. The length of the transmit pulse is chosen to be 10 µs. Both the 3f0 phase and amplitude can be programmed relative to the fundamental sinusoid. The transmit pulse was sent to a 25A250A power amplifier (Amplifier Research, Souderton, PA, U.S.A.) to drive a 2.25 MHz focused transducer (Panametrics, Waltham, MA, U.S.A.).
Acoustic waveform in water was measured by a PVDF needle hydrophone (Force Technology, MH28-6, Brøndby, Denmark).
The received signal was then sent to a PR5072 ultrasonic receiver for filtering and amplification (Panametrics, Waltham, MA, U.S.A.) and digitized at 20 MHz with an E1429A digitizer (Hewlett Packard, Palo Alto, CA, U.S.A.).
B-scan images were also constructed using similar experimental setup except that the transducer was operated in the pulse-echo imaging mode and the transmit waveform was a Gaussian pulse with length of about 5 µs. The fundamental frequency is set to be 1.5 MHz. A gelatin-based ultrasound phantom with uniform distribution of glass beads was used. There was also a cylindrical,
anechoic cyst parallel to the surface of the phantom. To form two-dimensional cross-sectional images, the transducer was mechanically scanned in a direction parallel to the phantom surface and perpendicular to the axis of the anechoic cyst. The received rf data at each transducer position were demodulated and low-pass filtered before envelope detection and logarithmic conversion.
Simulation methods
The model approximates acoustic diffraction using incremental field propagation of sound beam. Arbitrary transmit waveforms can be simulated using spectral decomposition into discrete frequency components. For each frequency component, linear propagation for an axial increment is modeled using the angular spectrum method [8, 9]. For the nonlinear propagation in each increment, the finite-amplitude-distortion-based harmonic generation is simulated by substituting the spectral components into (1) to produce the frequency-sum and the frequency-difference components of the second harmonic signal. A 64-channel linear array with 55-mm transmit focus is assumed in the simulations. The array had a 0.3 mm pitch. The homogeneous propagating medium has a parameter β of 3.5 approximating the nonlinear property of water [10]. In the simulations, the fundamental transmit frequency is at 2 MHz and the frequency response of the transducer is not considered. Transmit signals of both continuous wave (CW) and pulse wave (PW) are considered. For a CW case, the fundamental signal and the second harmonic signal are respectively represented as the first and the second spectral components of the Fourier series of the transmit waveform in the simulation. For a PW case, on the other hand, the fundamental signal is extracted by low-pass filtering with a flat frequency response between 1 MHz and 3 MHz and the second harmonic signal is extracted by band pass filtering with a flat frequency response between 3 MHz and 5 MHz. For both CW and PW transmit, the peak acoustic pressure
π φ
θ=2 f + (2)
φf
θ=2 (3)
at fundamental frequency is 200 KPa. The fundamental transmit phase remains fixed to 90° in the simulations unless specified.
四、結果與討論 Simulations
Fig. 1 shows the focal second harmonic amplitudes with various amplitude ratios and phases of 3f0 transmit signal. Note that the focal second harmonic amplitudes have been normalized to that in conventional transmit condition (i.e. only f0 transmit) for comparison. In other words, the normalized amplitude will be lager than unity if the 3f0
transmit signal results in enhancement of harmonic generation. It is demonstrated in Fig. 1 that for a fixed amplitude ratio, the resultant second harmonic signal varies with the 3f0 transmit phases. Clearly, suppression of second harmonic signal occurs when a 3f0 signal with relative phase of about -60° is transmitted. On the contrary, the second harmonic signal can be enhanced by transmitting a 3f0 transmit with 120° phase angle. Note that there is a 180° phase difference of 3f0 transmit signal between the cases of enhancement and suppression as expected in (2) and (3). It is also noticeable in Fig. 3 that the most effective suppression of second harmonic signal is achieved when the amplitude ratio of 3f0 transmit signal is about 0.5. In other words, with the 3f0
transmit amplitude scaled to half of the fundamental amplitude, the magnitude of frequency-difference component of the second harmonic signal is approximately similar to that of frequency-sum component so that a maximum cancellation between these two components can be achieved when they are 180° out-of-phase. Hence, the amplitude ratio of the 3f0 transmit signal is fixed to be 0.5 in subsequent simulations and experiments.
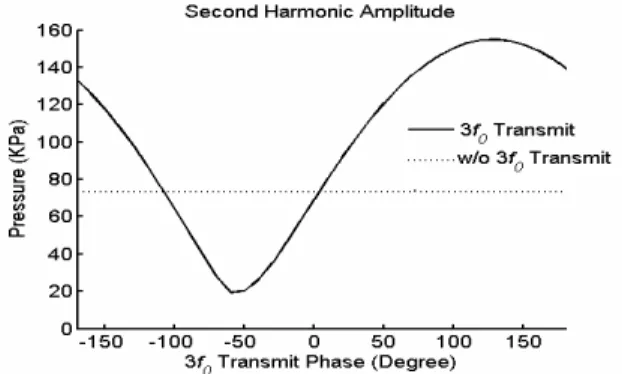
The variation of second harmonic amplitude with 3f0 transmit phase at focal depth is shown in Fig. 2. For reference, the second harmonic amplitudes produced without 3f0 transmit is depicted by the dotted
horizontal line. For enhancement, the second harmonic amplitude with 3f0 transmit phasing roughly doubles from 72 KPa to 150 KPa. In this case, a maximal 6-dB improvement of SNR in tissue harmonic imaging can be achieved. For suppression, the second harmonic amplitude with 3f0
transmit phasing is significantly reduced to about 20 KPa. In other words, a maximal 11-dB reduction of the background tissue signal is possible in contrast harmonic imaging.
Figure 1. Simulated focal second harmonic amplitude as a function of 3f0 transmit amplitude ratio and 3f0 transmit phase.
Figure 2. Simulated focal second harmonic amplitude as a function of 3f0 transmit phase. The 3f0 transmit amplitude ratio is 0.5.
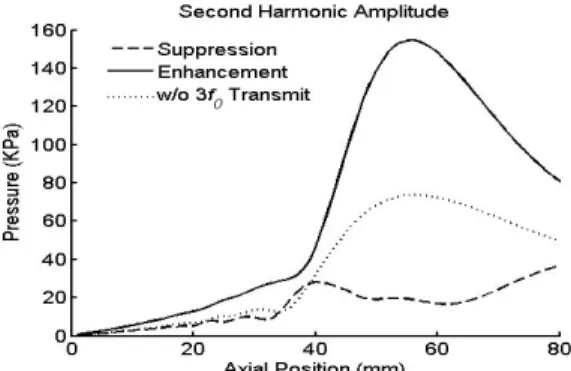
The axial amplitudes of the second harmonic signal with optimal enhancement and optimal suppression are shown in Fig. 3.
It is obvious that the method of 3f0 transmit phasing effectively changes the amplitude of second harmonic signal for a wide range of axial depths. For both enhancement and suppression, the performance of 3f0 transmit phasing is maximal in the focal zone where the fundamental transmit energy and 3f0
transmit energy can be efficiently mixed to produce the frequency-difference component.
In addition, for harmonic enhancement, the depth of focus of the tissue harmonic signal
also becomes shorter due to the relatively strong focusing of the frequency-difference component.
Figure 3. Simulated axial second harmonic amplitudes.
The radiation patterns of the second harmonic signal are also compared in Fig. 4.
For harmonic enhancement, the mainlobe of the radiation beam pattern remains similar to that without 3f0 transmit while the sidelobe levels are reduced. The reduction of sidelobe levels is a consequence of the lower sidelobes of the frequency-difference radiation pattern. In other words, with the increase in SNR of tissue harmonic signal, the spatial resolution in the lateral direction is kept unchanged and the contrast resolution is also improved. On the other hand, the CTR with 3f0 transmit phasing can be improved because of the suppression of tissue harmonic signal in the background.
Figure 4. Simulated second harmonic lateral beam patterns.
Note that the inclusion of 3f0 transmit signal has nearly no influence on the axial fundamental beam and hence, the acoustic illumination of microbubbles remains unchanged in contrast harmonic imaging.
Experiments
The measured second harmonic amplitude along the beam axis with 3f0
transmit phasing is illustrated in Fig. 5. Only the axial amplitudes with optimal enhancement and maximal suppression are shown. The corresponding radiation patterns at focus are also measured and compared. Fig.
6 shows the harmonic beam patterns. Fig. 5 and Fig. 6 demonstrate clearly that the intensity of tissue harmonic signal can be enhanced without degrading the contrast resolution. On the other hand, the tissue background in contrast harmonic imaging is suppressed with the cost of elevated harmonic sidelobe levels. Nevertheless, the improvement of CTR is still promising because the characteristics of fundamental beam are not affected by 3f0 transmit phasing.
Figure 5. Measured axial second harmonic amplitudes.
Figure 6. Measured second harmonic lateral beam patterns.
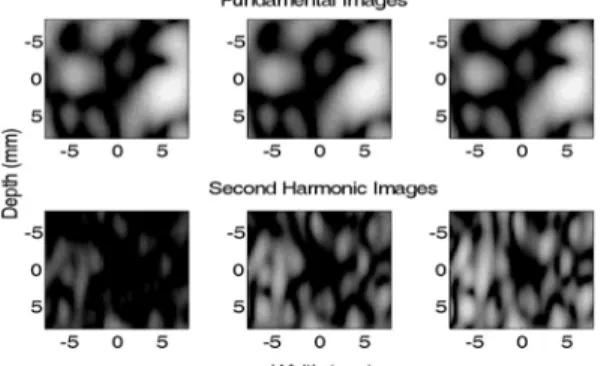
Fig. 7 shows the tissue harmonic B-scan images with harmonic suppression using 3f0 transmit phasing, without 3f0
transmit phasing and with harmonic enhancement using 3f0 transmit phasing, respectively from the left to right. For comparison, the corresponding fundamental images are also shown in the lower panels.
Images are all normalized to the maximum brightness in the enhancement case and are all displayed with a 30 dB dynamic range.
First, it is observed that the anechoic cyst can be better defined in these second harmonic images than in the fundamental images.
Second, it is also clearly shown that the method of 3f0 transmit phasing is effective in either increasing or reducing the intensity of tissue harmonic images while keeping the fundamental images almost unaltered.
Figure 7. B-scan phantom images with anechoic cyst.
五、計畫成果自評
In this study, the proposed method of 3f0 transmit phasing has been demonstrated to be effective in modifying tissue harmonic intensity using both simulations and experiments. Therefore, this technique can be utilized to improve the SNR in tissue harmonic imaging or to suppress interferences from tissue background for better contrast detection.
One major issue in 3f0 transmit phasing is the elevated MI at focus because the peak pressure of the propagating waveform is usually higher when the 3f0 transmit signal is included. Since the mechanical effect of the f0 transmit signal and the 3f0 transmit signal are very different, the bio-effects of 3f0
transmit phasing should be investigated to address this clinically crucial issue.
六、參考文獻
[1] R. T. Beyer and S. V. Letcher, Nonlinear acoustics. New York: Academic, 1969, pp.
202-230.
[2] M. E. Haran and B. D. Cook, “Distortion of finite amplitude ultrasound in lossy media,” J. Acoust.
Soc. Amer., vol. 73, no. 3, pp. 774-779, March 1983.
[3] F. Tranquart, N. Grenier, V. Eder, and L.
Pourcelot, “Clinical use of ultrasound tissue
harmonic imaging,” Ultrasound Med. Biol., vol.
25, no. 6, pp. 889-894, 1999.
[4] T. Christopher, “Finite amplitude distortion-based inhomogeneous pulse echo ultrasonic imaging,”
IEEE Trans. Ultrason., Ferroelect., Freq. Contr., vol. 44, no. 1, pp. 125-139, Jan. 1997.
[5] R. Y. Chiao and X. H. Hao, “Coded excitation for diagnostic ultrasound: a system developer's perspective,” IEEE Trans. Ultrason., Ferroelect., Freq. Contr., vol. 52, no. 2, pp. 160-170, Feb.
2005.
[6] P. H. Chang, K. K. Shung, S. J. Wu et al.,
“Second harmonic imaging and harmonic Doppler measurements with Albunex®,” IEEE Trans Ultrason Ferroelect Freq Contr., vol. 42, no.
6, pp. 1020–1027, Nov. 1995.
[7] T. Christopher, “Source prebiasing for improved second harmonic bubble-response imaging,”
IEEE Trans. Ultrason., Ferroelect., Freq. Contr., vol. 46, no. 3, pp. 556-563, May 1999.
[8] D. L. Liu and R. C. Waag, “Propagation and backpropagation for ultrasonic wavefront design,” IEEE Trans. Ultrason., Ferroelect., Freq.
Contr., vol. 44, no. 1, pp. 1-12, Jan. 1997.
[9] J. W. Goodman, Introduction to Fourier Optics.
New York: McGraw-Hill, 1968.
[10] W. K. Law, L. A. Frizzell and F. Dunn,
“Determination of the nonlinearity parameter B/A of biological media,” Ultrasound Med. Biol., vol.
11, no. 2, pp. 307-318, 1985.
出席國際學術會議心得報告
計畫編號 NSC 96-2221-E-011-143
計畫名稱 使用三倍頻發射相位法於超音波組織諧波強度之調變(I)
出國人員姓名
服務機關及職稱 沈哲州 國立台灣科技大學電機系 助理教授
會議時間地點 美國紐約 10/28~11/4
會議名稱 2007 IEEE International Ultrasonics Symposium
發表論文題目
1. Speckle Suppression using Maximal-Brightness-Difference-Based Adaptive Median Weighting
2. A Feasibility Study of Tissue Harmonic Generation with 3f0 Transmit Phasing
3. Coded Excitation and Nonlinear Pulse Compression in Pulse-Inversion Fundamental Imaging
一、參加會議經過
本人這次利用國科會的補助經費參加 2007 年在美國紐約舉行的 IEEE International Ultrasonics Symposium 研討會一共發表了三篇壁報論文,由於本會是超音波工程學界的 年度重要會議,因此本人事前的準備均力求完善並順利完成論文的報告,此外藉由和與 會者之間的互動與詢答可以感受到他們對於本人之研究均有相當的興趣與肯定,令人感 到十分興奮。
二、與會心得
本次出國開會也遇到同來開會的一些國內專家學者,並也和一些在美國超音波領域工 作的相關專家有許多互動,在這些討論中可以看出在日漸成熟的超音波產業其實越來越 趨向於有特定臨床應用的影像技術發展,例如分子影像相關的高頻技術與對比劑特性仍 是被廣泛探討的主流領域,而另一大類崛起中的光聲影像也同樣都是應用導向的研究為 主,能了解這樣的發展趨勢對本人未來的研究相信很有正面的幫助!
此外本人也利用會餘時間對俗稱大蘋果的紐約市略加遊歷,相較於 10 多年前初次到紐
約的印象相比,這次舊地重遊其實紐約市容變化不大,倒是由於季節的關係可以看到這 作城市裡泛黃的秋意,此外也刻意到之前曾經登頂觀覽的世貿大樓其遺址憑弔一番,該 建築在 921 事件中倒塌造成了上千人的傷亡,讓人不禁感嘆世界上價值觀的衝突往往一 不慎就釀成巨禍,而且發生在號稱有最多種族共處的紐約更是一種令人心驚的感觸! 這 無疑也是本次開會在專業討論之餘的一點心得。