Chapter 4
Polarization Shift Keying (PolSK) Fiber-Optic System Measured DNA Sensor
In chapter 3, we successful fabricated optical high sensitivity silicon nanopillars array sensor. In this chapter, the sensor is biosensing because of the peculiar properties of the sensor such as the capability of enhance electromagnetic waves interaction and control Polarization Shift Keying (PolSK) fiber-optic system to measure polarization states to the impairments in the sensor. The content of chapter 4 is arranged as follows:
Section 4-1, the sensing techniques and working principle of the sensor
using Si-Nanopillar array based on PolSK fiber-optic system. In Section
4-2, measure bio-molecular samples are introduced. We will show the
experimentation results in 4-3. Finally, we also give the summary in
section 4-4.
4-1 Sensing Techniques and Working Principle of the Sensor Using Si-Nanopillar Array Based on PolSK Fiber-Optic System
The presence of bio-molecules again contributes to a slight change of refractive index, leading to an alteration of the optical transmission through the Si nanopillars array sensor. The Si nanopillars array sensor is very attractive for sensing applications because their properties are highly sensitive to changes in the refractive index in the nanopillars array. In this kind of the Si nanopillars array sensor, the characteristic of the electromagnetic wave including amplitude, phase place, leaning towards polarized direction and wavelength can get enormously different results by controlling the light frequency spectrum, group velocity chromatic dispersion and phase matching. The Si nanopillars array sensor is biosensing because of the peculiar properties of the Si nanopillars array sensor such as the capability of enhance electromagnetic waves interaction and control Polarization Shift Keying (PolSK) fiber-optic system to measure polarization states to the impairments in the sensor.
The electric field can be localized in the slight refractive index region,
which makes the sensors extremely sensitive to the refractive index slight
change resulting from the infiltration of bio-molecules. The focus for our research is to detect the strongly polarization sensitivity of the Si nanopillars array sensor. We judge the bio-molecules from the slight different changes of refractive index, which caused sensor strongly polarization sensitivity, and observe signal constellation by Poincaré sphere based on Polarization Shift Keying (PolSK) fiber-optic system. By the infiltration of bio-molecules Si nanopillars array sensor structure caused by different group velocities of the polarization eigenmodes.
Therefore, in order to know the impairments of the variation state of polarization in the silicon nanopillars array. We use the instruments of the Polarization Shift Keying (PolSK) fiber-optic system to measure polarization states to the impairments in the sensor.
4-1-1 Introduction of PolSK Fiber-Optic System
Polarization modulation schemes have long been of interest to the
communications community. PolSK fiber-optic system encodes
information on a constellation of signal points in the space of the Stokes
parameters. In general, each signal point corresponds to a given state of
polarization and a given optical power. If only the polarization of the
lightwave, and not its power, is modulated, all the signal points lie on the Poincaré sphere. When a polarized lightwave is sent through the sensor, it is well-known that the state of polarization of the lightwave is altered due to the sensor using silicon nanopillars array and samples. However, if we look at a whole PolSK signal constellation, sensor polarization only causes a rigid rotation of the constellation over the Poincaré sphere. In other words, each of the signal points is displaced, but the spatial relationship between the points is preserved. As a result, we judge the bio-molecules from the slight different changes of refractive index, which caused sensor strongly polarization sensitivity, and observe signal constellation by Poincaré sphere.
All so far proposed PolSK systems make use of a binary modulation
scheme (2-PolSK) which information is sent by switching the
polarization of the transmitted lightwave between two linear orthogonal
SOPs. For binary systems, polarization modulation offers a 3 dB better
power sensitivity than intensity modulation and a reduced sensitivity to
self- and cross-phase modulation. Modulations based on the state of
polarization (SOP) are made possible by the fact that depolarization
phenomenon are of little importance even after relatively sensor spans.
Moreover, previous measurements [71] have shown that the rate of polarization changes due to the transit along the sensor is very low, and no significant variation can take place within a time span comparable with the symbol time. In the three-dimensional space defined by the Stokes parameters, two orthogonal SOPs map onto opposite points with respect to the origin. Thus, detection of binary modulation schemes is simply accomplished by looking at the sign of the scalar product of the received state of polarization (SOP) vector in the Stokes space with a reference vector representing one of the received SOPs in the absence of noise. This reference vector depends on the sensor induced changes on the transmitted SOPs, and for this reason, all 2-PolSK systems must somehow keep track of it. As to the effect of the laser phase noise, a general analytical treatment in coherent optical heterodyne receivers is not available. However, numerical analyses and experimental results have proved the considerable insensitivity to phase noise of receivers based on non-linear memory less processing of the signal, provided that the IF filter bandwidth is large enough to avoid phase-to-amplitude noise conversion [72].
Initially PolSK was both theoretically analyzed and experimentally
demonstrated only in conjunction with coherent detection [73-74]. This early work on coherent detection PolSK has established some important facts: sensor polarization effect does not corrupt polarization-encoded information and in particular the bit error probability is ideally unaffected;
sensor polarization effect compensation at the receiver is necessary but can be performed at the decision stage after photodetection; binary PolSK has a 40 photons/b quantum-limited sensitivity, whereas coherent ASK requires 80 photons/b (peak); binary and multilevel PolSK systems are largely insensitive to phase noise; multilevel PolSK quantum limited performance is better than DPSK if 3 b/symbol or more are transmitted.
4-1-2 The State of Polarization (SOP), Stokes Parameters and Poincare ' Sphere
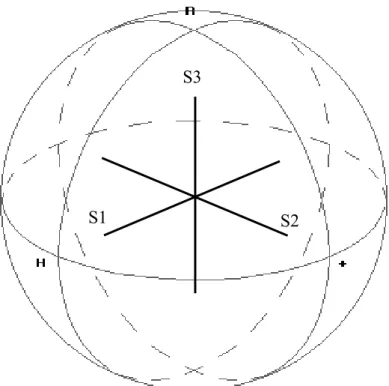
There are three axes S
1, S
2and S
3, and moves on the surface of a
sphere that we call the Poincare' sphere which is shown in Fig.4-1. The
polarization vector will be traced out a curve on the surface of the
Poincare' sphere by the different wavelength. If the device under test
(DUT) possession of the stable PMD the curve on the Poincare' sphere is
a circle. When the vector goes from the center of this circle through the
center of the Poincare' sphere that represents the principal axis of the device under test (DUT). The rate at the angle of the curve changes, divided by the rate at which the optical frequency changes, is the PMD.
Before introduce the definition of the Poincare' sphere, we have to describe the simple theoretics for the Stokes vector transformed from the Jones-matrix.
The polarized light can be described by using Jones-matrix as a complex vector symbolizing the x- and y- components of the electric field at a point in space which is shown in equation (4-1) [75-76]. When the light travels through a device that its own state of polarization (SOP) will undergo a transformation by the complex 2x2 Jones- matrix. The Jones-matrix is determined by measuring the output Jones vectors in response to any three-unique input vectors. The difference of the phase between x-axis and y-axis that define the δ(delta) in equation (4-2).
And, when the scope of theδ(delta) to lie in -π<δ< 0
othat we call the left circle polarization. The scope of theδ(delta) to lie in 0
o<δ<
180
othat we call the right circle polarization. It would describe the any
state of polarization with adjusting the magnitude and phase relationships
of the Ex(t) and Ey(t) components in a light wave signal. In 1852, Mr.
Stokes used the four parameters S
0, S
1, S
2and S
3to outright express the state of polarization (SOP) of the light wave in vector form, which is shown in equation (4-4) and (4-5). Since there are only three independent variables, the four Stokes parameters are verified as the following equation (4-3). And the Poincare' sphere uses the normalized S parameters (S
1= S
1/S
0, S
2= S
2/S
0, S
3= S
3/S
0) by the total optical power as a co-ordinate system to represent any possible state of polarization (SOP). The range of the normalized Stokes parameters is –1 to +1. An alternative expression for the SOPs is the Stokes vector as shown in equation (4-6).
⎟ ⎟
⎠
⎞
⎜ ⎜
⎝
⎛
+ ω
⋅
+ ω
= ⋅
⎟ ⎟
⎠
⎞
⎜ ⎜
⎝
= ⎛
) P t cos(
E
) P t cos(
E )
t ( E
) t ( ) E
t ( E
y y
0
x x
0 y
r
xr r
(4-1)
x y
def
= P − P
δ ( - 180
o< δ ≤ 180
o) (4-2)
2 3 2 2 2 1 2
0
S S S
S = + + (4-3)
The linear horizontal and vertical SOPs are represented respectively
as (1,0,0) and (-1,0,0). Similarly, the right hand circular polarization
(RHC) is represented as (0,0,1) while the left hand circular polarization
(LHC) is (0,0,-1). The remaining axis shows the linear +45
oand
linear –45
ostates. The magnitude of the Stokes vector is the sum of
squares of S
1, S
2, and S
3. The use of the Stokes vector parameters is best illustrated via the use of the Poincare' sphere that shown detailed in Fig.4-2
S=
⎟ ⎟
⎟ ⎟
⎟
⎠
⎞
⎜ ⎜
⎜ ⎜
⎜
⎝
⎛
=
±
=
=
=
=
⎟⎟
⎟ ⎟
⎟
⎠
⎞
⎜⎜
⎜ ⎜
⎜
⎝
⎛
SOP (LHC)
&
(RHC) between
difference Power
S
SOP 45 Linear between
difference Power
S
SOP Horizontal
&
Vertical between
difference Power
S
states) d
unpolarise and
polarised (in
Power Total
S
S S S S
3
0 2
1 0
3 2 1 0
(4-4)
S=
⎟⎟
⎟ ⎟
⎟
⎠
⎞
⎜⎜
⎜ ⎜
⎜
⎝
⎛
−
−
⇒ −
⎟⎟
⎟ ⎟
⎟ ⎟
⎠
⎞
⎜⎜
⎜ ⎜
⎜ ⎜
⎝
⎛
⋅
⋅
⋅
⋅
⋅
⋅
− +
=
⎟⎟
⎟ ⎟
⎟
⎠
⎞
⎜⎜
⎜ ⎜
⎜
⎝
⎛
− LCP RCP
total
oy ox
oy ox
oy ox
oy ox
I I
I I
I I
I
E E
E E
E E
E E
S S S S
ο ο
ο ο
δ
δ
45 4590 0 2
2
2 2
3 2 1 0
sin 2
cos
2 (4-5)
S= ⎟⎟ ⎟
⎟ ⎟
⎠
⎞
⎜⎜
⎜ ⎜
⎜
⎝
⎛
⋅
= ⋅
⎟ ⎟
⎟ ⎟
⎟ ⎟
⎟ ⎟
⎟ ⎟
⎠
⎞
⎜ ⎜
⎜ ⎜
⎜ ⎜
⎜ ⎜
⎜ ⎜
⎝
⎛
⋅
⋅
⋅
⋅
⋅
⋅
− +
=
⎟ ⎟
⎟ ⎟
⎟ ⎟
⎟ ⎟
⎠
⎞
⎜ ⎜
⎜ ⎜
⎜ ⎜
⎜ ⎜
⎝
⎛
ε θ ε
θ ε
δ δ
2 sin
2 sin 2 cos
2 cos 2
cos 1
sin 2
cos 2
2 2
2 2
3 0 2 1
o oy ox
o oy ox
o oy ox
o oy ox
o o o o
S E E
S E E
S E E
S E E
S S
S S
S S
S S
(4-6)
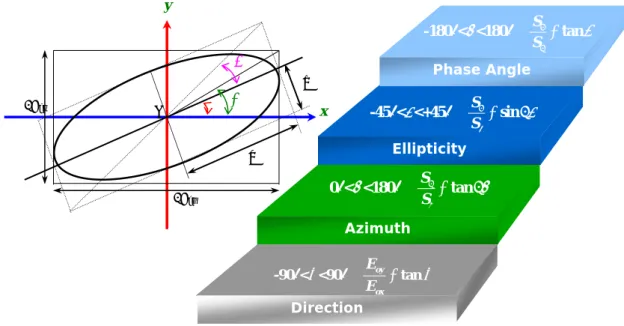
The relationships between the β, ellipticityεand azimuthθ
which is sketch the map in the Fig. 4-3 [77]. Furthermore, the
relationships of the parameters definitions is listed as following:
Phase Angle -180
o<δ< 180
o= tan δ S
S
2 3
Ellipticity - 45
o<ε< + 45
o= sin 2 ε S
S
0 3
Azimuth 0
o<θ< 180
o= tan 2 θ S
S
1 2
Direction 90
o<β< -90
o= tan β E
E
ox oy
4-2 Introduction of Measure Bio-molecular Samples
In this section, we will test the virus, DNA and germ which are discussed extensively. We hope that our sensor can diagnosis virus and the innovation technique will be contributed for the medical field. The discussed sample in this section as following:
I. Plasmid
Plasmids are (typically) circular double-stranded DNA molecules separate from the chromosomal DNA and capable of autonomous replication. They usually occur in bacteria, sometimes in eukaryotic organisms (e.g., the 2-micrometre-ring in Escherichia coli). Their size varies from 1 to over 400 kilobase pairs (kbp). There are anywhere from one copy, for large plasmids, to hundreds of copies of the same plasmid present in a single cell, or even to thousands of copies for certain artificial plasmids selected for high copy number (such as the pUC series of plasmids) [78].
II. Herpes Simplex Virus Type-1 (HSV-1)
The herpes simplex virus (HSV) is a double-stranded DNA virus
with an enveloped, icosahedral capsid. There are two distinct types of the
virus, herpes simplex virus type-1 (HSV-1) and herpes simplex virus
type-2 (HSV-2), both of which are closely related α-herpesviruses (having a broad host range). Here we focus on herpes simplex virus type-1 (HSV-1) to study. It is a common cause of infections of the skin and mucous membranes, manifesting itself as tiny, clear, fluid-filled blisters usually around the mouth. Upon entering the body through oral transmission, HSV-1 penetrates the nerve cells (primary sensory neurons) in the lower layers of human skin tissue and replicates itself in the cell nuclei, thus destroying host cells. HSV-1 has a great impact on human health globally due to its high prevalence in particular children [79].
III. Glucose
Diabetes is now a serious global problem that has attracted continuous interest for the development of an efficient glucose sensor.
Because insulin is the principal hormone that regulates uptake of glucose into most cells from the blood (primarily muscle and fat cells, but not central nervous system cells), deficiency of insulin or the insensitivity of its receptors plays a central role in all forms of diabetes mellitus. Much of the carbohydrate in food is converted within a few hours to the monosaccharide glucose, the principal carbohydrate found in blood.
Some carbohydrates are not converted. Insulin is released into the blood
by beta cells (β-cells) in the pancreas in response to rising levels of blood
glucose (e.g., after a meal). Insulin enables most body cells (about 2/3 is
the usual estimate, including muscle cells and adipose tissue) to absorb
glucose from the blood for use as fuel, for conversion to other needed
molecules, or for storage. Insulin is also the principal control signal for
conversion of glucose (the basic sugar used for fuel) to glycogen for
internal storage in liver and muscle cells. Reduced glucose levels result
both in the reduced release of insulin from the beta cells and in the
reverse conversion of glycogen to glucose when glucose levels fall,
although only glucose thus recovered by the liver re-enters the
bloodstream as muscle cells lack the necessary export mechanism. Higher
insulin levels increase many anabolic ("building up") processes such as
cell growth and duplication, protein synthesis, and fat storage. Insulin is
the principal signal in converting many of the bidirectional processes of
metabolism from a catabolic to an anabolic direction, and vice versa. In
particular, it is the trigger for entering or leaving ketosis (i.e., the fat
burning metabolic phase). If the amount of insulin available is
insufficient, if cells respond poorly to the effects of insulin (insulin
insensitivity or resistance), or if the insulin itself is defective, glucose will
not be handled properly by body cells (about ⅔ require it) or stored appropriately in the liver and muscles. The net effect is persistent high levels of blood glucose, poor protein synthesis, and other metabolic derangements, such as acidosis [80].
VI. Saccharomyces cerevisiae
A species of yeast which is an important mode organism for
biological study, particularly for genetics and molecular biology. The
entire genome of this species has been base sequenced and it is used to do
research on basic cellular mechanics of replication, recombination, cell
division and metabolism. Saccharomyces cerevisiae is also economically
important in the food industry, where it is used to ferment grain sugars to
make beer and as baker’s yeast for baking bread or making other food
which requires rising by gas bubbles of carbon dioxide. It is also
sometimes taken as a vitamin supplement for protein, the B vitamins, and
folic acid [81].
4-3 Experimental Results of PolSK Communication with theDNA
In this section, we will test the virus, DNA and germ which are discussed extensively. The discussed sample in this section as following:
I. Plasmid II. Herpes Simplex Virus Type-1 (HSV-1) III. Saccharomyces VI. Glucose as Fig. 4-4 shows.
The experimental setups for measuring polarization states from the
silicon nanopillars array sensor are shown in Fig. 4-5. An HP8168
tunable laser, with a tunability range of 1440-1590 nm, is used as our
source. In order to optimize the intensity of the TE polarized-light, a fiber
polarization controller is inserted between the laser and the input tapered
lensed fiber as shows Fig. 4-9. To improve the signal to noise ratio, a
polarizer that transmits only TE-polarized light is inserted between the
device and the detector. The Si nanopillars array sensor is biosensing
because of the peculiar properties of the Si nanopillars array sensor such
as the capability of enhance electromagnetic waves interaction and
control Polarization Shift Keying (PolSK) fiber-optic system to measure
polarization states to the impairments in the sensor. The picture of the
experiment frame with measuring polarization states from the silicon
nanopillars array sensor is shown in Fig. 4-6 and Fig.4-7. Fig. 4-8
explains we use the sensor to soak in the solution of sample and come to
do the experimentation and analysis. We judge the bio-molecules from
the slight different changes of refractive index, which caused sensor
strongly polarization sensitivity, and observe signal constellation by
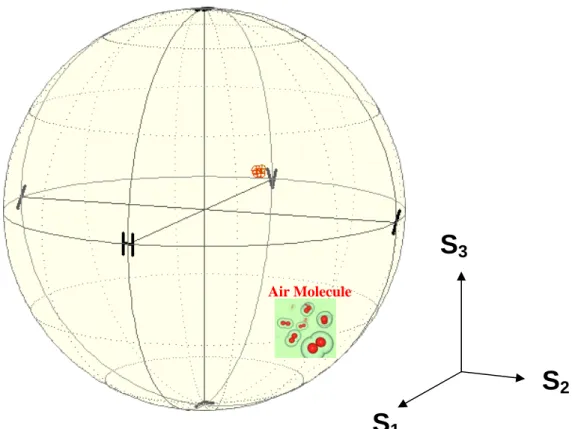
Poincaré sphere. Average result of the state of polarization measurement
of air which has no liquid to sensor is shown Fig. 4-10 at TE mode. From
the result we can obviously observe the trajectory of the polarization
states, Azimuth 2.124
o±0.1
oand Ellipticity 0.585
o±0.15
o. We find the
polarization state of our measurement result is very stable and it has a
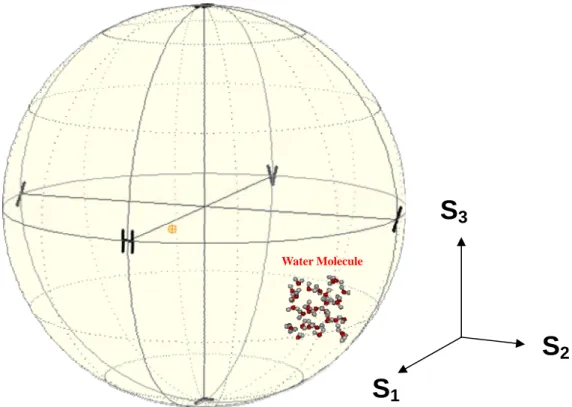
unique polarization states. Average result of the state of polarization
measurement of water is shown Fig. 4-11 at TE mode. From the result we
can obviously observe the trajectory of the polarization states, Azimuth
5.434
o±1
oand Ellipticity 2.3825
o±0.5
o. We find the polarization state of
our measurement result is very stable and it has a unique polarization
states. The rotated orientation variation is as shown in Fig. 4-11, which
makes the sensors extremely sensitive to the refractive index slight
change resulting from the infiltration of water-molecules. Then we will
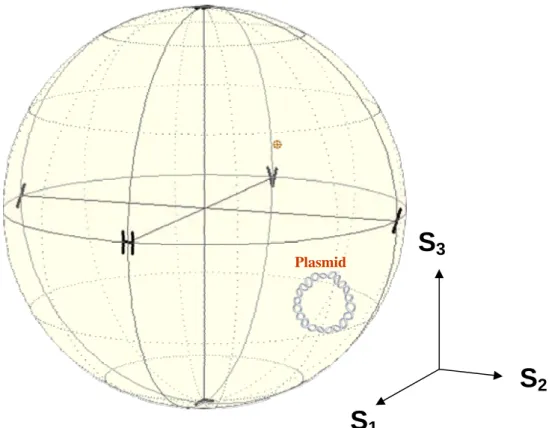
test the virus, DNA and germ. In case I, average result of the state of
polarization measurement of Plasmid is shown Fig. 4-12 at TE mode.
From the result we can obviously observe the trajectory of the polarization states, Azimuth 7.041
o±1.1
oand Ellipticity 3.763
o±0.65
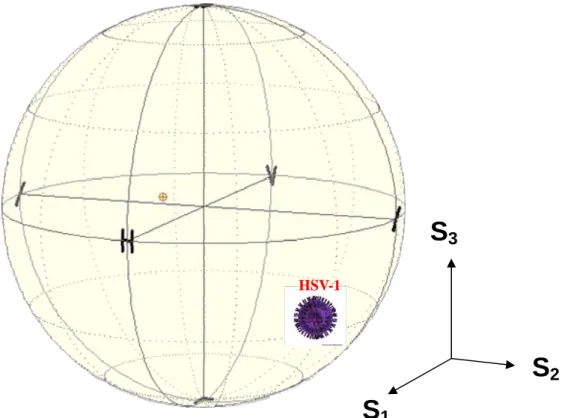
o. We find the polarization state of our measurement result is very stable and it has a unique polarization states. The rotated orientation variation is as shown in Fig. 4-12, which makes the sensors extremely sensitive to the refractive index slight change resulting from the infiltration of Plasmid-molecules. In case II, average result of the state of polarization measurement of Herpes Simplex Virus Type-1 (HSV-1) is shown Fig.
4-13 at TE mode. From the result we can obviously observe the trajectory
of the polarization states, Azimuth -73.483
o±0.5
oand Ellipticity
2.093
o±1.41
o. We find the polarization state of our measurement result is
very stable and it has a unique polarization states. The rotated orientation
variation is as shown in Fig. 4-13, which makes the sensors extremely
sensitive to the refractive index slight change resulting from the
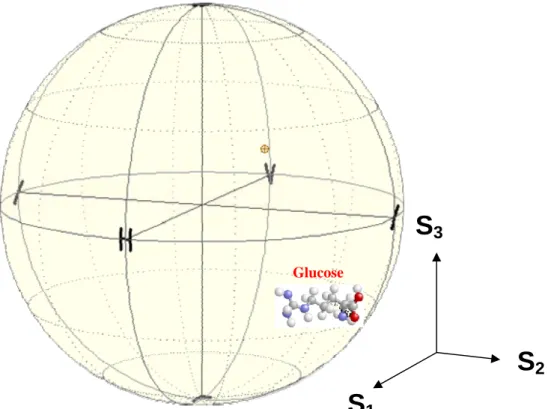
infiltration of Herpes Simplex Virus Type-1-molecules. In case III,
average result of the state of polarization measurement of Glucose is
shown Fig. 4-14 at TE mode. From the result we can obviously observe
the trajectory of the polarization states, Azimuth -69.673
o±0.268
oand
Ellipticity 6.573
o±0.73
o. We find the polarization state of our measurement result is very stable and it has a unique polarization states.
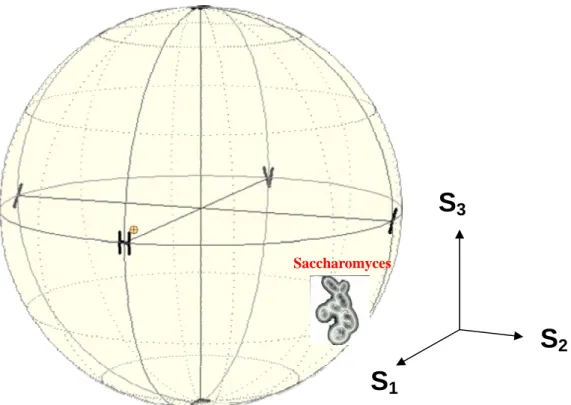
The rotated orientation variation is as shown in Fig. 4-14, which makes the sensors extremely sensitive to the refractive index slight change resulting from the infiltration of Glucose-molecules. In case VI, average result of the state of polarization measurement of Saccharomyces is shown Fig. 4-15 at TE mode. From the result we can obviously observe the trajectory of the polarization states, Azimuth -68.555
o±0.707
oand Ellipticity 8.213
o±0.562
o. We find the polarization state of our measurement result is very stable and it has a unique polarization states.
The rotated orientation variation is as shown in Fig. 4-15, which makes the sensors extremely sensitive to the refractive index slight change resulting from the infiltration of Saccharomyces -molecules.
In order to optimize the intensity of the TM polarized-light, a fiber
polarization controller is inserted between the laser and the input tapered
lensed fiber as shown Fig. 4-16. Average result of the state of polarization
measurement of air which has no liquid to sensor is shown Fig. 4-17 at
TM mode. From the result we can obviously observe the trajectory of the
polarization states, Azimuth -88.467
o±0.1
oand Ellipticity 1.425
o±0.15
o.
We find the polarization state of our measurement result is very stable and it has a unique polarization states. Average result of the state of polarization measurement of water is shown Fig. 4-18 at TM mode. From the result we can obviously observe the trajectory of the polarization states, Azimuth -87.934
o±0.289
oand Ellipticity 4.093
o±1.25
o. We find the polarization state of our measurement result is very stable and it has a unique polarization states. The rotated orientation variation is as shown in Fig. 4-18, which makes the sensors extremely sensitive to the refractive
index slight change resulting from the infiltration of water-molecules.
Then we will test the virus, DNA and germ at TM mode. In case I, average result of the state of polarization measurement of Plasmid is shown Fig. 4-19 at TM mode. From the result we can obviously observe the trajectory of the polarization states, Azimuth 89.927
o±1.1
oand Ellipticity 5.341
o±0.233
o. We find the polarization state of our measurement result is very stable and it has a unique polarization states.
The rotated orientation variation is as shown in Fig. 4-19, which makes
the sensors extremely sensitive to the refractive index slight change
resulting from the infiltration of Plasmid-molecules. In case II, average
result of the state of polarization measurement of Herpes Simplex Virus
Type-1 (HSV-1) is shown Fig. 4-20 at TM mode. From the result we can obviously observe the trajectory of the polarization states, Azimuth 88.178
o±1.364
oand Ellipticity 2.169
o±0.632
o. We find the polarization state of our measurement result is very stable and it has a unique polarization states. The rotated orientation variation is as shown in Fig.
4-20, which makes the sensors extremely sensitive to the refractive index
slight change resulting from the infiltration of Herpes Simplex Virus Type-1-molecules. In case III, average result of the state of polarization measurement of Glucose is shown Fig. 4-21 at TM mode. From the result we can obviously observe the trajectory of the polarization states, Azimuth -88.588
o±0.486
oand Ellipticity 3.5217
o±0.95
o. We find the polarization state of our measurement result is very stable and it has a unique polarization states. The rotated orientation variation is as shown in Fig. 4-21, which makes the sensors extremely sensitive to the refractive
index slight change resulting from the infiltration of Glucose-molecules.
In case VI, average result of the state of polarization measurement of
Saccharomyces is shown Fig. 4-22 at TM mode. From the result we can
obviously observe the trajectory of the polarization states, Azimuth
-87.996
o±0.876
oand Ellipticity 1.971
o±1.1
o. We find the polarization
state of our measurement result is very stable and it has a unique polarization states. The rotated orientation variation is as shown in Fig.
4-22, which makes the sensors extremely sensitive to the refractive index
slight change resulting from the infiltration of Saccharomyces
-molecules.
4-4 Summary
Si nanopillars array sensor can be used to judge biomolecules
attached to the device surfaces. In the demonstration of the
experimentation, small molecules (Plasmid, HVS-1, Glucose,
Saccharomyces cerevisiae) can be judged by monitoring the polarize
variation. In this chapter, the experiment not only judges sensing of
biomolecules, but also shows that such silicon nanopillars array sensor
are capable of detecting both DNA and germ without using fluorescent
labels. This is a very promising value from this preliminary experiment in
comparison with other planar optical biosensors. The sensor based on
Polarization Shift Keying (PolSK) fiber-optic system can have a higher
sensitivity compared to other label-free detection methods, such as
surface plasma resonance, quartz microbalance, and microcantilever
sensors. With these capabilities, silicon nanopillars array sensors can
potentially be used in many areas such as drug discovery, disease
diagnostics, chemical analysis and environmental monitoring. We believe
this technology can bring revolutionary medical treatment to the
mankind.
S1 S2 S3
Fig. 4-1 The principal axis of the Poincar'e sphere
S 1
S 2
( 1 0 0
( -1,0,0 ( 0,-1,0
( 0,1,0
( 0,0,-1 ) ( 0,0,1 )
δ=0°
δ=90°
δ
δ= -90°
δ=45°
δ=135°
δ= - 45°
2Θ
2ε δ
δ=135°
Poincaré Sphere S3
x y
δ
y
2Eox
2Eoy
a
b O
Fig.4-4 The discussed sample in this section as following: I. Plasmid II.
Herpes Simplex Virus Type-1 (HSV-1) III. Saccharomyces VI. Glucose.
Fig. 4-3 The relationships among the β, ellipticity ε and azimuth θ
Θ β ε
x
Phase Angle
Ellipticity
Azimuth
Direction
-90 < <90 oy tan
ox
E
β E β
° ° =
2 1
2 0 < <180 S tan
θ S θ
° ° =
3 0
2 -45 < <+45 S sin
ε S ε
° ° =
3 2
-180 < <180 S tan
θ S δ
° ° =
I II III VI
Polarimeter
Sample
Polarization Controller Laser
Source
PC
Fig.4-5 Experimental setups for measuring polarization states from the silicon nanopillars array sensor.
Fig.4-6 The picture of the experiment frame.
Fig.4-7 The picture of the experiment frame with measuring polarization states from the silicon nanopillars array sensor.
Fig.4-8 Utilize the sensor to soak in the solution of sample.
TE
S
1S
2S
3Fig.4-9 Set up, the experiment of TE mode light.
Air Molecule
S
1S
2S
3Fig.4-10 Average result of the state of polarization measurement of air
S
1S
2S
3Water Molecule
Fig. 4-11 Average result of the state of polarization measurement of water for TE mode.
S
1S
2S
3Plasmid
Fig. 4-12 Average result of the state of polarization measurement of
Plasmid for TE mode.
HSV-1
S
1S
2S
3Fig. 4-13 Average result of the state of polarization measurement of Herpes Simplex Virus Type-1 (HSV-1) for TE mode.
S
1S
2S
3Glucose
Fig. 4-14 Average result of the state of polarization measurement of
Saccharomyces
S
1S
2S
3Fig. 4-15 Average result of the state of polarization measurement of Saccharomyces for TE mode.
TM
S
1S
2S
3Fig. 4-16 Set up, the experiment of TM mode light.
Air Molecule
S
1S
2S
3Fig. 4-17 Average result of the state of polarization measurement of air which has no liquid to sensor for TM mode.
S
1S
2S
3Water Molecule
Fig. 4-18 Average result of the state of polarization measurement of
Plasmid
S
1S
2S
3Fig. 4-19 Average result of the state of polarization measurement of Plasmid for TM mode.
S
1S
2S
3HSV-1
Fig. 4-20 Average result of the state of polarization measurement
ofHerpes Simplex Virus Type-1 (HSV-1) for TM mode.
Glucose
S
1S
2S
3Fig. 4-21 Average result of the state of polarization measurement of Glucose for TM mode.
S
1S
2S
3Saccharomyces