國立臺灣大學工學院機械工程研究所 碩士論文
Graduate Institute of Mechanical Engineering College of Engineering
National Taiwan University Master Thesis
應用類神經網路建立一個具有自然使用者介面之 觸覺回饋裝置
Applying Artificial Neural Networks to Develop A Haptic Feedback Device with Natural User Interface
林子皓 Zi-Hao Lin
指導教授:陳湘鳳 博士 Advisor: Shana Smith, Ph.D.
中華民國 105 年 7 月 July, 2016
Acknowledgement
The journey in research is a long one. It sometimes feels hard and there’s no end in sight. But when I type these words. It made me realize that no matter how hard everything seemed at first and we will pull through no matter what it is.
The first person I’d like to thank is my thesis advisor professor Shana Smith. I thank her for all the help. All the time she spent advising us on the right research direction, and sometimes about her life experience. I know I am not always the most attentive student nor was I the most earnest, but I tried my best to be a good student.
Second, I’d like to acknowledge my family, though they cannot provide me with techinical support or offer any conclusive research insights, yet without their support and care, I wouldn’t have made it this far in life without any major failures.
I’d also like to acknowledge everyone from the Advanced Product Realization and Interaction Lab, it is with their help and friendship that made the two-year grad school a memorable one. And of course I’d like to thank Ph. D candidate Jian-Min Wu for his help with device and circuit designs, without him, this research would’ve taken a lot longer to complete.
Lastly, I want to thank everyone who has been part of my life in these last two years, there aren’t many, but thank you all for all the memories you provided me with, both good and bad, it is with these memories that made me who I am today, and I am thankful for every last pieces of those memories.
ABSTRACT
Virtual Reality (VR) and Augmented Reality (AR) technology are increasingly used in complex engineering applications; however, VR and AR systems provide limited haptic feedback in these applications. In order to solve this problem, a method for providing realistic haptic feedback was designed in this research. A recording device combined accelerometer and force sensor was designed to record the real texture, and a simulation device combined accelerometer, force sensor, and piezo actuator was designed to simulate the actuator haptic feedback.
The recorded data from the recording device was processed to be the simulation data using a neural network. The neural network was used to train an approximate function.
This function was programed into the simulation device, so that the simulation device can create corresponding tactile feedback which was recorded from the recording device.
With our method, we can provide realistic haptic feedback and perform real-time feedback in natural operation.
Keywords: Haptics Feedback, Tactile Sensation, Vibrotactile, Neural Network, Natural User Interface, Piezo Actuator
CONTENTS
口試委員會審定書 ... #
Acknowledgement ...i
ABSTRACT ... ii
CONTENTS ... iii
LIST OF FIGURES ... v
LIST OF TABLES ...ix
Chapter 1 Introduction ... 1
1.1Equation Chapter 1 Section 1 Background ... 1
1.2 Motivation and purpose ... 2
Chapter 2 Literature Review ... 3
2.1 Haptic Feedback Device ... 3
2.1.1 DC motor ... 3
2.1.2 Voice coil actuator ... 7
2.1.3 Piezoelectric materials ... 8
2.1.4 Speakers ... 10
2.1.5 Pneumatic stimulation ... 10
2.1.6 Smart fluid ... 12
2.1.7 Electrostatic ... 13
2.2 Vibrotactile ... 15
2.3 Signal processing methods ... 17
2.3.1 Reducing the Dimension ... 17
2.3.2 Neural networks ... 19
2.3.3 Band pass filter ... 19
Chapter 3 Research methodology ... 21
3.1 Record texture data ... 22
3.2 Process texture data ... 30
3.3 Simulation ... 39
Chapter 4 Experiment and User Test ... 50
4.1 Experiment ... 50
4.1.1 Record texture data ... 52
4.1.2 Process texture data ... 57
4.1.3 Simulate texture data ... 61
4.2 User Test ... 65
4.2.1 Haptic feedback distinguish test ... 66
4.2.2 Haptic feedback intensity test ... 68
4.2.3 Haptic feedback texture distinguish test ... 72
4.3 Discussion ... 75
Chapter 5 Conclusion and Future Work... 76
5.1 Conclusion ... 76
5.2 Future Work ... 76
REFERENCE ... 78
LIST OF FIGURES
Figure 2.1 PHANToM (Massie,1993) ... 4
Figure 2.2 PHANToM Omni® ... 5
Figure 2.3 Razer Hydra (Razer, 2014) ... 5
Figure 2.4 Operating scene for the hybrid system(Vyawahare & Stone, 2012) ... 6
Figure 2.5 Wearable haptic feedback device (Nishimura et al., 2014) ... 6
Figure 2.6 Gravity Grabber (Minamizawa et al., 2007) ... 7
Figure 2.7 Voice coil actuator haptic feedback device (Romano et al., 2012) ... 8
Figure 2.8 Piezoelectric haptic feedback device (Kyung et al., 2004) ... 9
Figure 2.9 Piezoelectric tactile feedback device (Hayward and Cruz-Hernandez, 2000) 9 Figure 2.10 Speaker haptic feedback (Hashimoto et al., 2009) ... 10
Figure 2.11 Pneumatic stimulation tactile feedback device (Inoue et al., 2009) ... 11
Figure 2.12 Pneumatic stimulation tactile feedback device (Stanley et al., 2013) ... 11
Figure 2.13 MudPad (Jansen et al., 2010) ... 12
Figure 2.14 ER fluids tactile feedback device (Goto and Takemura, 2013) ... 13
Figure 2.15 TeslaTouch (Bau et al., 2010) ... 14
Figure 2.16 Electrostatic tactile feedback device (Nakamura and Yamamoto, 2013) ... 14
Figure 2.17 Mechanoreceptors (1) (Goldstein, 2010) ... 15
Figure 2.18 Mechanoreceptors (2) (Goldstein, 2010) ... 16
Figure 2.19 A neural network... 19
Figure 3.1 Research flowchart ... 21
Figure 3.2 Record flowchart ... 23
Figure 3.3 MPU6050 ... 24
Figure 3.4 FSR402 ... 24
Figure 3.5 MEGA2560... 25
Figure 3.6 finger sheath... 25
Figure 3.7 Hard board with accelerometer ... 25
Figure 3.8 Record device finger part... 26
Figure 3.9 Record device ... 26
Figure 3.10 Operating device ... 28
Figure 3.11 Record data from breadboard texture ... 29
Figure 3.12 Record device flowchart ... 29
Figure 3.13 A neural network structure... 30
Figure 3.14 Z-axis signal before filtering in time domain ... 32
Figure 3.15 Z-axis signal before filtering in frequency domain ... 32
Figure 3.16 Z-axis signal after filtering in frequency domain ... 33
Figure 3.17 Z-axis signal after filtering in time domain ... 33
Figure 3.18 Training process ... 35
Figure 3.19 Process flowchart ... 38
Figure 3.20 Piezo actuator... 40
Figure 3.21 Simulation device ... 40
Figure 3.22 Simulation device with finger ... 41
Figure 3.23 Using simulation device ... 41
Figure 3.24 Simulation device without pressing the force sensor ... 42
Figure 3.25 Simulation device with pressing the force sensor... 42
Figure 3.26 Circuit flowchart ... 43
Figure 3.27 100 Hz sin wave... 44
Figure 3.28 100 Hz square wave ... 44
Figure 3.30 150 Hz square wave ... 45
Figure 3.31 200 Hz sin wave... 46
Figure 3.32 200 Hz square wave ... 46
Figure 3.33 250 Hz sin wave... 47
Figure 3.34 250 Hz square wave ... 47
Figure 3.35 Simulation flowchart ... 49
Figure 4.1 Breadboard ... 50
Figure 4.2 Plastic desk pad... 51
Figure 4.3 Rubber bubble pad ... 51
Figure 4.4 Sandpaper ... 52
Figure 4.5 Recorded data of breadboard ... 53
Figure 4.6 Recorded z-axis signal of breadboard in frequency domain ... 53
Figure 4.7 Recorded data of plastic desk pad ... 54
Figure 4.8 Recorded z-axis signal of plastic desk pad in frequency domain ... 54
Figure 4.9 Recorded data of rubber bubble pad ... 55
Figure 4.10 Recorded z-axis signal of rubber bubble pad in frequency domain ... 55
Figure 4.11 Recorded data of sandpaper ... 56
Figure 4.12 Recorded z-axis signal of sandpaper in frequency domain ... 56
Figure 4.13 z-axis signal after filtering of breadboard in time domain ... 57
Figure 4.14 z-axis signal after filtering of breadboard in frequency domain ... 58
Figure 4.15 z-axis signal after filtering of plastic desk pad in time domain ... 58
Figure 4.16 z-axis signal after filtering of plastic desk pad in frequency domain ... 59
Figure 4.17 z-axis signal after filtering of rubber bubble pad in time domain ... 59
Figure 4.18 z-axis signal after filtering of rubber bubble pad in frequency domain ... 60
Figure 4.19 z-axis signal after filtering of sandpaper in time domain ... 60
Figure 4.20 z-axis signal after filtering of sandpaper in frequency domain ... 61
Figure 4.21 Simulation z-axis signal of breadboard in time domain ... 62
Figure 4.22 Simulation z-axis signal of breadboard in frequency domain ... 62
Figure 4.23 Simulation z-axis signal of plastic desk pad in time domain... 63
Figure 4.24 Simulation z-axis signal of plastic desk pad in frequency domain ... 63
Figure 4.25 Simulation z-axis signal of rubber bubble pad in time domain ... 64
Figure 4.26 Simulation z-axis signal of rubber bubble pad in frequency domain ... 64
Figure 4.27 Simulation z-axis signal of sandpaper in time domain ... 65
Figure 4.28 Simulation z-axis signal of sandpaper in frequency domain ... 65
Figure 4.29 Correct rate for questionnaire 1 ... 68
Figure 4.30 Result for Plastic desk pad ... 70
Figure 4.31 Result for Sandpaper... 71
Figure 4.32 Result for Rubber bubble pad ... 71
Figure 4.33 Result for Breadboard ... 72
Figure 4.34 Correct rate for questionnaire 3 ... 74
LIST OF TABLES
Table 2.1 Mechanoreceptors Characteristic... 16
Table 3.1 Network setting ... 34
Table 3.2 Input weights ... 37
Table 3.3 Input bias weights ... 37
Table 3.4 Output wights ... 37
Table 4.1 Questionnaire 1 ... 66
Table 4.2 Questionnaire 2 ... 69
Table 4.3 Questionnaire 3 ... 73
Chapter 1 Introduction
1.1 Background
Since Virtual Reality (VR) and Augmented Reality (AR) systems become more mature and widespread, there are many applications based on the systems, one of these applications helps users experience the product before the prototype made, or learn the assembly/disassembly process, users can understand the product or be trained for assembling/disassembling by operating the system before the prototype produced.
Because of this application, we can avoid design errors and material waste.
In order to achieve the application, VR and AR systems have a big problem, they do not have haptic feedback. It is important, when users operate the tasks which need sensitive sensations to finish. According to the prior research, operating the task with gloves increases the time from 10% to 75% (Sanders and McCormick, 1987). And other research describes that wearing heavy gloves is not only decreasing the tactile sensations, but also lowering the ability to distinguish two points for 50% (Chodack and Spampinato, 1991).
With these studies, we know that if the hand sensitivity is affected while operating the task, it will increase the operating time and difficulty. So, if the VR and AR systems are designed without haptic feedback, it may discount the systems effectiveness. We have to consider the haptic feedback when we design the systems.
1.2 Motivation and purpose
These studies let us understand that haptic feedback is important while operating the system, so, we need to develop a method that can perform the real haptic feedback.
In our research, we develop a method which contains recording the real environment texture, processing the recorded data, and simulating the feedback. Through this method, we can simulate the real haptic feedback with our device easily.
Chapter 2 Literature Review
In this section, we will introduce some background to our research, and it includes haptic feedback devices, vibrotatile, and algorithms. The background can help us to learn the state of the art of haptic feedback research.
2.1 Haptic Feedback Device
Haptic feedback can be performed by many kinds of methods and devices. In this section, we will introduce some common methods and devices which are used for haptic feedback.
2.1.1 DC motor
DC motor is a common actuator to provide haptic feedback. Although DC motor has several advantages, e.g., inexpensive, easy to control, and widely used, it also has some disadvantages, e.g., narrow frequency bandwidth, long response time, and large size.
Massie (1993) designed a haptic device, PHANToM which composed of six DC motors and linkages, as shown in Figure 2.1. When users interact with virtual 3-D objects, this device can make users feel the shapes and stiffness of the objects. However, due to the DC motor limitations, it cannot provide high frequency vibrations. In addition, the operation method is different from the way which users interact with the real world.
Vyawahare and Stone (2012) combined the PHANToM Omni® , as shown in Figure 2.2, and the Razer Hydra motion sensing controller from Razer Inc., as shown in Figure 2.3, to create an asymmetric interface and interactions for bimanual virtual assembly system. The user uses the Razer Hydra with the right hand to grab the virtual components, and the left hand to controls the feedback-capable PHANToM Omni® to operate assembly tools such as screwdrivers, wrenches, and etc., as shown in Figure 2.4.
The hybrid system allows for a larger workspace using Razer Hydra, which helped offset the limitation of the PHANToM Omni® , yet the Razer Hydra does not offer any haptic feedback.
Figure 2.1 PHANToM (Massie,1993)
Figure 2.2 PHANToM Omni®
Figure 2.3 Razer Hydra (Razer, 2014)
Figure 2.4 Operating scene for the hybrid system(Vyawahare & Stone, 2012)
Nishimura et al. (2014) developed a wearable haptic feedback device, as shown in Figure 2.5. This device combines a voice coil actuator and two DC motors. The voice coil actuator offers the vertical motion and vibration, the two DC motors provide the tangential skin stretch .With these actuators, user can feel the feedbacks, up, down, and horizontal stretch caused by tactile texture.
Figure 2.5 Wearable haptic feedback device (Nishimura et al., 2014)
Minamizawa et al. (2007) designed a device called the Gravity Grabber, as shown in Figure 2.6. The device consists of two DC motors and two belts. When the two motors turn the opposite direction, the belt is tightened and provide vertical upward force to fingers; when the motor rotate in the same direction, they provide tangential shear deformation to the finger skin. By this method they successfully simulate the weight of a virtual object in a virtual reality environment.
Figure 2.6 Gravity Grabber (Minamizawa et al., 2007)
2.1.2 Voice coil actuator
Voice coil actuator has several advantage, e.g., fast response time, wide frequency bandwidth, it also has disadvantages, e.g., expensive, small stroke, and large size.
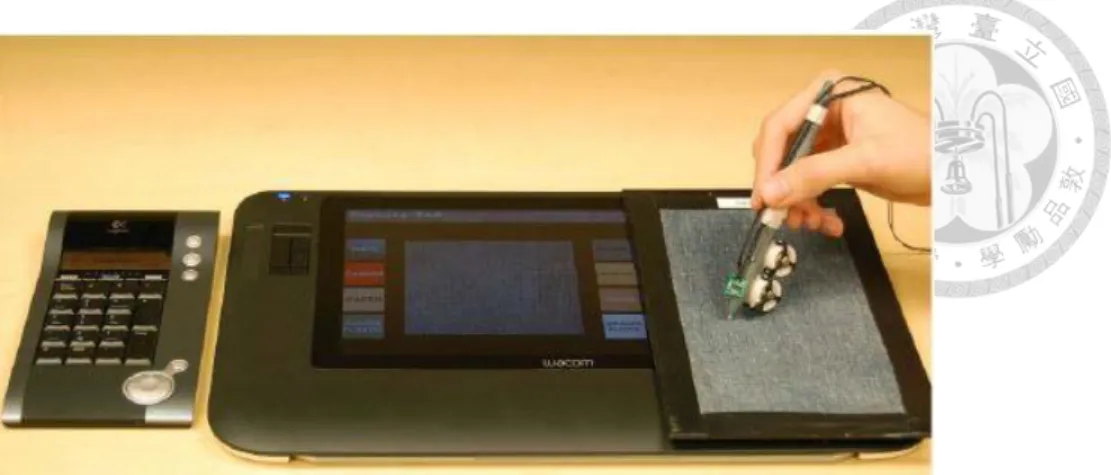
Romano et al. (2012) attached an accelerometer, a force sensor, and two voice coil actuators to a tablet stylus to record the texture data and simulate the haptic feedback, as shown in Figure 2.7.
Figure 2.7 Voice coil actuator haptic feedback device (Romano et al., 2012)
2.1.3 Piezoelectric materials
Piezoelectric materials have several advantages, e.g., small size, thin, fast response time and strong vibrations. Because of these advantages, it can apply to create realistic haptic feedback. However, piezoelectric materials need high driven voltage and have small stroke.
Kyung et al. (2004) suggested the design of an integrated tactile display system that provided kinesthetic force, pressure distribution, vibration and slip/stretch. The system consisted of two parts: a DC motor for kinesthetic display and eight piezoelectric bimorphs with end fixed for normal stimulation to the skin, as shown in Figure 2.8.
Figure 2.8 Piezoelectric haptic feedback device (Kyung et al., 2004)
Hayward and Cruz-Hernandez (2000) found that people not only have vibrotactile sensitivity but also have skin stretch sensitivity. Using these tactile properties, they created a tactile feedback device, which is composed of 64 closely aligned piezoelectric actuators coupled with thin film to create transverse and lateral tensile stress fields.
However, the device did not designed to provide a variety of tactile feedbacks. Figure 2.9 shows a side view of this device.
Figure 2.9 Piezoelectric tactile feedback device (Hayward and Cruz-Hernandez, 2000)
2.1.4 Speakers
Speakers have several advantages, e.g., cheap, fast response time, wide frequency bandwidth and small size. Because of these advantages, some studies use speakers to create haptic feedback devices.
Hashimoto et al. (2009) used speakers to make a haptic feedback device, as shown in Figure 2.10. When users hold the speakers while the speakers vibrating the air between the speakers and their palms. They can feel force feedback by speaker’s vibrations. Due to the wide bandwidth, speakers can provide different tactile feedbacks with different frequencies.
Figure 2.10 Speaker haptic feedback (Hashimoto et al., 2009)
2.1.5 Pneumatic stimulation
The principle of using pneumatic stimulation to produce haptic feedbacks is changing the pressure. Inoue et al. (2009) used an air jet, a tensioned flexible sheet, and a nozzle to create a device to stimulate virtual lumps, as shown in Figure 2.11. The nozzle was controlled to fire the air jet when the fingertip was on the virtual lumps.
Figure 2.11 Pneumatic stimulation tactile feedback device (Inoue et al., 2009)
Stanley et al. (2013) used a flat, deformable layer of hollow silicone cells filled with coffee grounds to create a tactile feedback device, as shown in Figure 2.12. This device can achieve both variable stiffness and deformable geometry via air pressure.
Figure 2.12 Pneumatic stimulation tactile feedback device (Stanley et al., 2013)
2.1.6 Smart fluid
Jansen et al. (2010) used magnetic field to drive magnetorheological fluid to create a haptic feedback device, called MudPad. As shown in Figure 2.13, the electromagnet array below the device provides a magnetic field to control to accumulate or disperse of the magnetorheological fluid. Using magnetorheological fluid has advantages, e.g., fast response time, but it also has disadvantages, e.g., the electromagnet array is large.
Figure 2.13 MudPad (Jansen et al., 2010)
Goto and Takemura (2013) used electric field to changes the characteristics of electro-rheological fluid (ERF) to provide tactile feedback. An electric field was applied at a specific position in an ERF chamber to simulate a solid bump, as shown in Figure 2.14.
Figure 2.14 ER fluids tactile feedback device (Goto and Takemura, 2013)
2.1.7 Electrostatic
Electrostatic can provide a shear force or vibration to user's finger by creating voltage difference between two objects, or creating an electric field between two objects by electrostatic attraction which simulates frictional force. For example, Bau et al.
(2010) used electric fields to create a device, called TeslaTouch, as shown in Figure 2.15.
When the user moves a finger on the screen, they can feel subtle vibrations.
Figure 2.15 TeslaTouch (Bau et al., 2010)
Nakamura and Yamamoto (2013) created a tactile feedback system on a touch screen, as shown in Figure 2.16. This system consists of an electrode in a circular contact plate, which is put on top of an LCD screen. The system can provide different friction between the circular contact plate and the LCD screen, so that the user can feel a sense of different friction feedbacks.
Figure 2.16 Electrostatic tactile feedback device (Nakamura and Yamamoto, 2013)
2.2 Vibrotactile
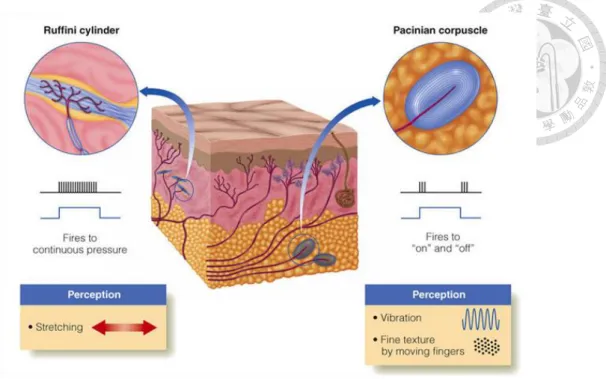
Human’s perception is coming from the nerves responses when sensory nerves received the external stimuli. Human’s skin can be categorized into two parts: epidermis and dermis. There are four kinds of mechanoreceptors in the skin, and they are meissner corpuscle, merkel receptor, ruffini cylinder and pacinian corpuscle, as shown in Figure 2.17 and Figure 2.18. Dermis can accept physical external stimuli from the four mechanoreceptors.
Figure 2.17 Mechanoreceptors (1) (Goldstein, 2010)
Figure 2.18 Mechanoreceptors (2) (Goldstein, 2010)
Merkel receptor is sensitive to 1 to 10 Hz pressure by pressing a surface texture.
Meissner corpuscle is sensitive to 2 to 40 Hz of sudden geometry change. Ruffini cylinder is sensitive to 100 to 500 Hz of continuous force. Pacinian corpuscle is sensitive to 40 to 500 Hz vibrations and texture. (Goldstein, 2010; Johansson and Vallbo, 1983; Kaczmarek et al., 1991; Kyung et al., 2004), as shown in Table 2.1.
Table 2.1 Mechanoreceptors Characteristic
Receptor Class Receptive Field (mm2)
Frequency Range
Threshold Skin Deform on Hand (um)
Probable Sensory
Merkel
Receptor SA I 2-100 1-10 Hz 7-600 Pressure
Meissner
Corpuscle RA I 1-100 2-40 Hz 4-500 Vibration
Touch Tickle
Pacinian RA II 10-1000 40-500 Hz 3-20 Vibration
Corpuscle Tickle Ruffini
Cylinder SA II 10-500 100-500Hz 30-1500
Stretch Shear Tension
Vibrotactile can be separated roughly into two types: low frequency and high frequency. Low frequency conveys shape, compliance, and friction. High frequency conveys object texture.
According to Bensma¨ıa et al.’s (2005) study, human distinguish high frequency vibrations based on signal spectrum and distinguish low frequency based on energy. In addition, mechanoreceptors can detect high frequency vibrations from all directions, but cannot distinguish which directions.
2.3 Signal processing methods
In this section, we discuss some algorithms which are used to process texture data for simulating haptic feedback.
2.3.1 Reducing the Dimension
We can record high frequency vibration signals from physical texture. However, human cannot distinguish exact high frequency vibration directions. In addition, simulating textures with multi-axis vibrations using a haptic device is very difficult and complicated.
According to Bensma¨ıa et al.’s research (2005), when human have similar tactile
similar signal spectrums. Therefore, when the signal dimensions are reduced, the simplified signal should have similar spectrum as the original one.
Landin et al. (2010) listed several algorithms which can reduce the signal dimensions, e.g., single axis, principal component analysis, sum of component, vector magnitude and discrete Fourier transform. Each algorithm has its advantages and disadvantages.
Single axis method chooses one axis to record. This method can record texture information quickly and easily, and the data does not have to be reduced into lower dimension. However, this method has some constraints. For example, if the selected axis is not the energy concentrated axis, the recorded data will lose a lot of texture information. Therefore, Users should choose correct axis carefully using this method.
Principle component analysis is similar to single axis, but it chooses axis based on the axis with the highest energy. Since this method also picks one axis, it means that this method also might lose some texture information.
Sum of component is the method that summing the values from all axes. This method may cause destructive interference on data, because the value from each axis has positive and negative directions. Therefore, it might also lose a lot of texture information.
Vector magnitude method finds the square root of the sum the squares of the magnitude of the signals from all axes. This method makes the reduced signal always positive, so the reduced signal may have the same energy as the original one, but it might also lose a lot of texture information.
Discrete Fourier transform 321 transforms the original signals from time domain to frequency domain and sums the phase angle in each direction together for each signal.
The, find the value of the magnitude for each signal. The computed value is
reduced into one dimension on frequency domain, and then the reduced signal and the summed phase angle are used to compute the inverse signal from frequency domain to time domain.
2.3.2 Neural networks
Neural networks are an algorithm which can solve nonlinear problems without clear definition and accurate math model. For haptic feedback problem, it is usually difficult to define a clear math model or accurate equations for surface texture signals, and it may be nonlinear. Therefore, neural networks are very suitable for solving this type of problem. Figure 2.19 shows an example of a neural network structure, which includes input neurons, an input layer, a hidden layer, and an output layer.
Input layer neuron 1
Input layer neuron
N
Input layer
N
Hidden layer neuron 1
Hidden layer neuron N
Hidden layer
N Win,1,1
Win,N,N
Win,1,N
Output layer neuron 1
Output layer neuron N
Output layer
Hidden layer neuron 1
Hidden layer neuron N
N bias Win,1,1
bias Win,1,N
bias Win,N,N
Output neuron
Active function f1
Active function f1
Active function f1
Wout,1
Wout,N
Output neuron
bias Wout Active function f2
Input 1 vx
Input 1
∆f Input 1
vy
Output az
Figure 2.19 A neural network
2.3.3 Band pass filter
also noises caused by hand motion or other factors. These signals which caused by hand motion may affect our training data and results, so we have to remove them.
In order to remove the noises which we do not need, we have to filter these noises out. The frequency of these noises caused by hand motion are usually between 1 to 5 Hz (Romano et al., 2012). Since human’s tactile perception is sensitive to 100 Hz to 250 Hz of texture vibrations (Table 2.1), band pass filter can be used to remove these noises.
In this research, the Discrete Fourier Transform is used to transform the original signal from time domain to frequency domain, then the data with frequency lower than 5 Hz and higher than 250 Hz is removed. After that, we reverse the signal from frequency domain to time domain.
Chapter 3 Research methodology
Our system design can separated into three parts: record texture data, process texture data, and simulate texture vibration, as shown in Figure 3.1.
Record texture data
Process texture data
Simulate texture vibration
Figure 3.1 Research flowchart
First, we build a device, which combines a 3-axis accelerometer and a force sensor to record data while interacting with the object texture. Then, we use a neural network to train the recorded data to find the approximate transfer function. Third, we use the
3.1 Record texture data
As mentioned in section 2.2, we know that processing multi-axis signals and simulating multi-axis haptic feedback are complicated and difficult. In addition, human cannot recognize the directions of high frequency vibrations. Therefore, we reduce signal dimensions to increase the simulation speed and reduce the difficulty and complexity of our design.
Since the axis perpendicular (z-axis) to a surface has the largest vibration energy when users interact with the surface texture, in this research, single axis method is used to reduce signal dimensions.
Romano et al. (2012) addressed that velocity and compressive force will affect the texture signals when users interact with physical texture. In this research, we record compressive force (fn) and 3-axis acceleration (ax, ay, and az), and then compute velocity from acceleration using our recording device while users interacting with object texture.
The output of the recording device is vx, vy, az, and Δf, as shown in Figure 3.2.
Record
Process texture data
Simulate texture Vvibration 3-axis
accelerometer MPU6050
Force sensor
FSR402
Compute Arduino MEGA2560
ax,ay,az fn
vx,vy,Δf,az
Figure 3.2 Record flowchart
This research uses an MPU6050 3-axis accelerometer (as shown in Figure 3.3), an FSR402 force sensor (as shown in Figure 3.4), an Arduino MEGA 2560 control board, (as shown in Figure 3.5), and a rubber finger sheath (as shown in Figure 3.6). The MPU6050 3-axis accelerometer is fixed on a hard board (as shown in Figure 3.7) to make sure the recorded signals will not be absorbed by the rubber finger sheath, as shown in Figure 3.8. Figure 3.9 shows the final recording device.
Figure 3.3 MPU6050
Figure 3.4 FSR402
Figure 3.5 MEGA2560
Figure 3.6 finger sheath
Figure 3.7 Hard board with accelerometer
Figure 3.8 Record device finger part
Figure 3.9 Record device
The 3-axis accelerometer needs to be calibrated before it can be used. A calibration program is used to compute data offset.
After the 3-axis accelerometer is calibrated, the device is ready to record data.
Figure 3.10 shows a user is using the recording device to record the surface texture of a breadboard. The device will record accelerations in 3 axes and force for each. In order to get the velocity data, we have to integrate the acceleration data, as shown in equation (1) and equation (2).
,0 *
x x x
V V a dt (1)
,0 *
y y y
V V a dt (2)
vx: current velocity on x-axis vy: current velocity on y-axis vx,0: initial velocity on x-axis vy,0: initial velocity on y-axis ax: acceleration on x-axis ay: acceleration on y-axis dt: time interval we set 0.001 s
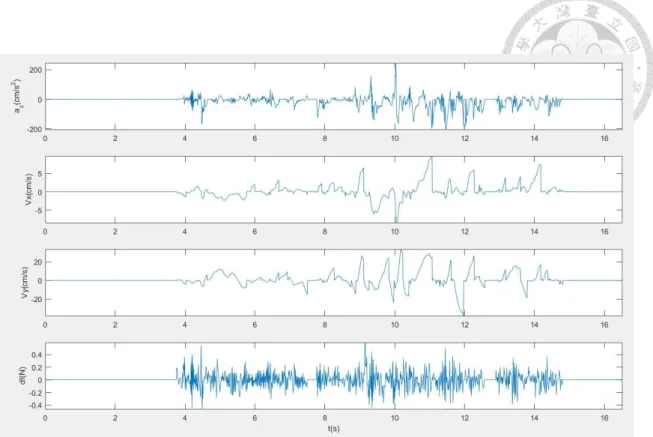
Each time, when the force is zero, the current velocity will be reset to zero, and it will become the initial velocity as shown in equation (3). Figure 3.11 shows the output of the recording device, and it includes the acceleration in the z direction, velocities in the x and y directions, and delta force.
0, if force 0 { , if force 0
V V
(3)
Figure 3.10 Operating device
Figure 3.11 Record data from breadboard texture
Texture
Device
MPU6050 FSR402 MEGA2560
Computer
Figure 3.12 Record device flowchart
3.2 Process texture data
Romano et al. (2012) addressed that the relative velocity and compressive force will affect vibration acceleration while interacting with surface texture. Therefore, they built a table to describe the relationships among velocity, force, and vibration acceleration. The vertical axis of the table is velocity, the horizontal axis is compressive force, and the data on the corresponding coordinate point is the acceleration signals.
When they use a tablet stylus to simulate the vibrations, the stylus will detect the current velocity and compressive force, then the stylus will vibrate with the corresponding acceleration signals.
It is difficult to find all data in the table, so they used interpolation method to calculate other data. In our research, we use neural networks to find the corresponding accelerations, as shown in Figure 3.13. The input neurons include vx, vy, and ∆f. The output layer is the corresponding recorded az. The neural network training will compute the connecting weights between the input layer and the hidden layer.
Input layer neuron
1
Input layer neuron
N
Input layer
N
Hidden layer neuron 1
Hidden layer neuron N
Hidden layer
N Win,1,1
Win,N,N Win,1,N
Output layer neuron 1
Output layer neuron N
Output layer
Hidden layer neuron 1
Hidden layer neuron N
N bias Win,1,1
bias Win,1,N
bias Win,N,N
Output neuron
Active function f1
Active function f1 Active function f1
Wout,1
Wout,N
Output neuron
bias Wout Active function f2
Input 1 vx
Input 1
∆f Input 1
vy
Output az
Figure 3.13 A neural network structure
Before we start training the network, we have to filter out some noises, e.g., low
frequency signal caused by hand jittering or high frequency signal which human is insensitive.
Band pass filter is used to filter out the noises in the signals recorded from surface texture. Signals with frequencies lower than 5 Hz and higher than 500Hz are filter out.
Frequency lower than 5Hz can be caused by hand jittering (Romano et al., 2012), and human is insensitive to frequency higher than 500 Hz (as shown in Table 2.1).
Discrete Fourier transform is used to transform the data from time domain to frequency domain. The phase angle and magnitude of the data are also computed. The data with frequencies between 5 Hz and 500 Hz is kept. After we remove the data which we do not want, we compute the inverse data from frequency domain to time domain by using inverse Discrete Fourier transform.
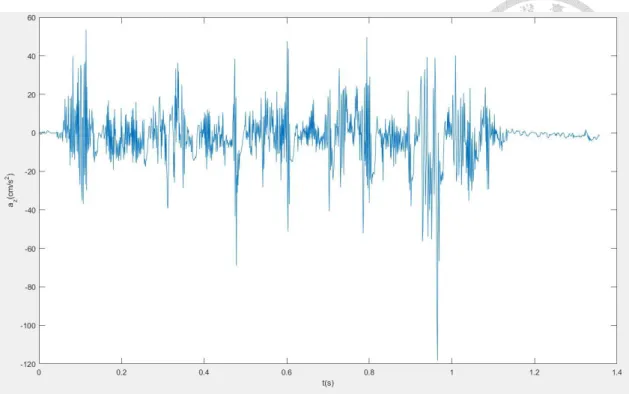
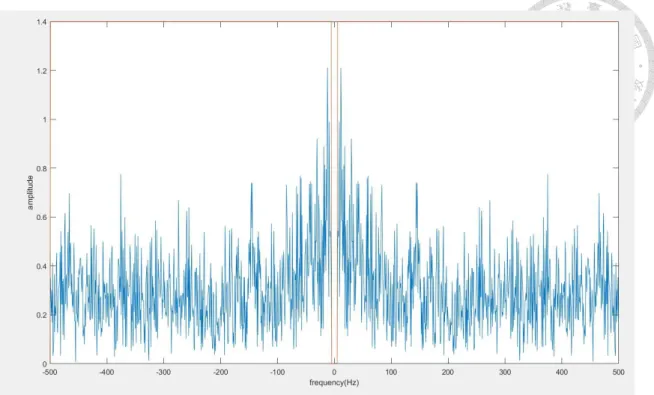
Figure 3.14 shows the z-acceleration in time domain before filtering. Figure 3.15 shows the Z-axis acceleration in frequency domain. Figure 3.16 show the z-acceleration in frequency domain after filtering. Figure 3.17 shows the Z-axis acceleration in time domain. We can clearly see that some signals have significant effect before filtering, but these signals disappear after filtering.
Figure 3.14 Z-axis signal before filtering in time domain
Figure 3.15 Z-axis signal before filtering in frequency domain Keep
Keep
Figure 3.16 Z-axis signal after filtering in frequency domain
Figure 3.17 Z-axis signal after filtering in time domain
After the noise was filtered out from the signals, the data is trained by the neural network. The parameter setting of the neural network setting is shown in Table 3.1.
Table 3.1 Network setting
Input layer Neurons
3
Output
neurons 1
Hidden
layers 1
Hidden layers neurons
10
Active
function logsig、purelin
Velocities vx, vy and ∆ f are set as the input data, and Z-axis acceleration is set as the output data. The first one-third of the input and output data is used for training. The second one-third of data is used for validation. The last one-third of data is for testing.
The training process is shown in Figure 3.18.
Set network variable
Initial weights
Compute hidden layer And
Output layer
Compute error function
Modify weights
Have training data?
Yes
Training complete?
No No
Stop training Yes
Figure 3.18 Training process
The initial input weights, and input bias weights, output weights, and output bias weights are randomly set between [-10, 10]. The active function in hidden layer and output layer are shown in equation (4) and (5). The transfer function in hidden layer and output layer are shown as in equation (6) and (7). The learning rate of the training process was set to 0.9. The training process used back propagation, steepest descent approximations, and over-fitting controls to calculate NN errors and modify neuron weights. The training process stopped when it reached 2000 epochs or the total error was less than 10-9.
1
( ) 1
1 n
f n e
(4)
Active function f1: logsig
2( )
f n n (5)
Active function f2: purelin
1 in b in,
net f w inputw (6)
net: hidden layer output input: vx,vy, and ∆f win: input weights wb,in: input bias weights
2 out b out,
output f w netw (7)
output: z-axis acceleration wout: output weights wb,out: output bias weights
Table 3.2 to Table 3.4 show the training results, and output bias weight is 0.11.
Table 3.2 Input weights
N1 N2 N3 N4 N5 N6 N7 N8 N9 N10
vx 0.87 -1.87 0.13 -1.32 -1.26 1.09 1.91 2.91 -1.67 -0.53 vy 2.38 -2.04 2.86 0.61 -2.05 2.21 0.97 0.44 -1.46 -2.45
∆f -1.63 -1.17 0.81 2.58 -1.74 1.65 2.14 -0.23 -1.97 1.66
Table 3.3 Input bias weights
N1 N2 N3 N4 N5 N6 N7 N8 N9 N10
-2.99 2.33 -1.66 1.16 -0.04 1.00 0.61 1.75 -2.35 -3.013
Table 3.4 Output wights
N1 N2 N3 N4 N5 N6 N7 N8 N9 N10
-0.41 -0.39 -0.07 0.14 0.04 0.57 -0.22 -0.26 0.51 0.02
After the neural network is trained, the approximate transfer function is created.
Using the approximate transfer function, acceleration corresponding to any velocity and force can be found to simulate the acceleration caused by interacting with surface
Record texture data
Simulate texture vibration Band pass filter
Neural network training
Approximation function Record data
vx,vy,∆f az
az `
Figure 3.19 Process flowchart
3.3 Simulation
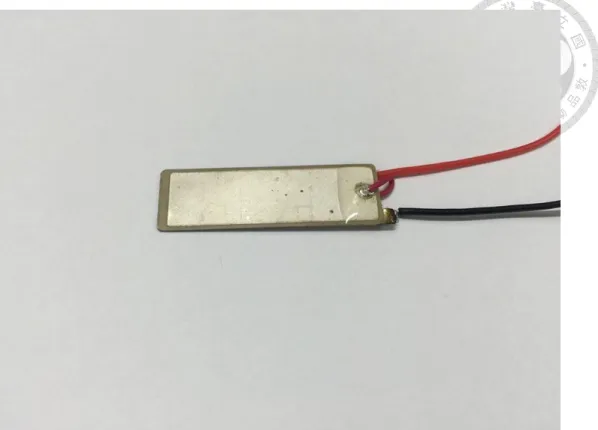
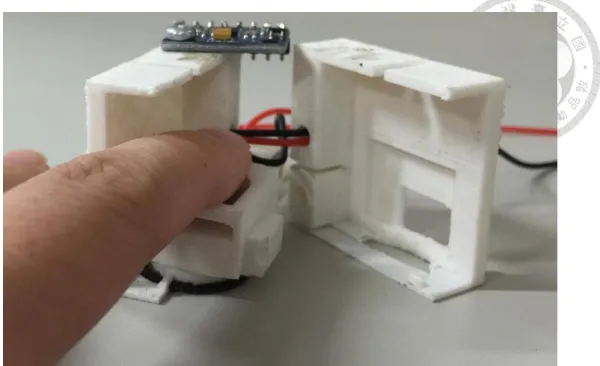
The approximate transfer function is programmed into the Arduino MEGA2560, which is attached in the simulation device. The simulation device is consisted of a hard case for putting a finger, a piezo actuator (as shown in Figure 3.20), a 3-axis accelerometer, a force sensor, an Arduino MEGA2560 board, and an amplifier circuit, as shown in Figure 3.21 and Figure 3.22. The piezo actuator is size of 10mm * 30mm and vpp is 96 volt. Users put their finger into the simulation device and move their finger with the simulation device as shown in Figure 3.23. When the 3-axis accelerometer detects the current velocity and the force sensor detects the compressive force, the data is sent to the Arduino MEGA2560 board to find the corresponding acceleration. The acceleration is amplified by the amplifier circuit to obtain the input voltage to drive the piezo actuator to simulate the actual surface texture.
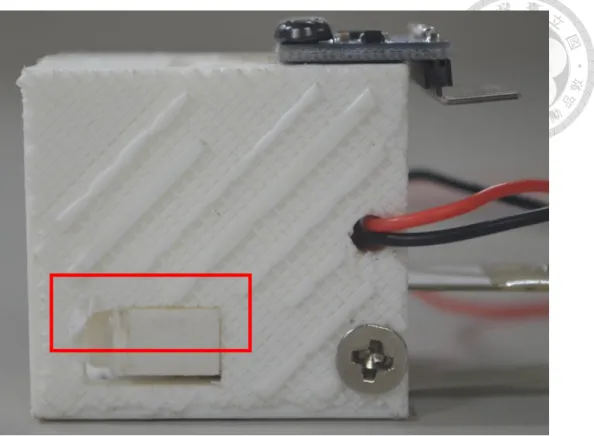
The hard case is designed to avoid the users restricting the vibration of the piezo actuator when the users press on the force sensor as shown in Figure 3.24 and Figure 3.25.
Figure 3.20 Piezo actuator
Figure 3.21 Simulation device
Figure 3.22 Simulation device with finger
Figure 3.24 Simulation device without pressing the force sensor
Figure 3.25 Simulation device with pressing the force sensor
Because the Arduino MEGA2560 control board only outputs 0 or 5 volt of digital signals, but the vibration signal is an analog signal. Therefore, we need to convert output signals to analog signals.
An amplifying and converting circuit is designed to convert output signals to analog signals. The circuit can transform the digital output 0 or 5 volt to analog -2.5 to 2.5 volt by using I2C port and amplify the signal to -45 to 45 volt for driving the piezo actuator to vibrate. Figure 3.26 shows the amplifying and converting process.
Simulation device
Convert Offset Amplify
0-5 volt digital signal
0-5 volt analog signal -2.5-2.5 volt signal
-45-45 volt output signal
Figure 3.26 Circuit flowchart
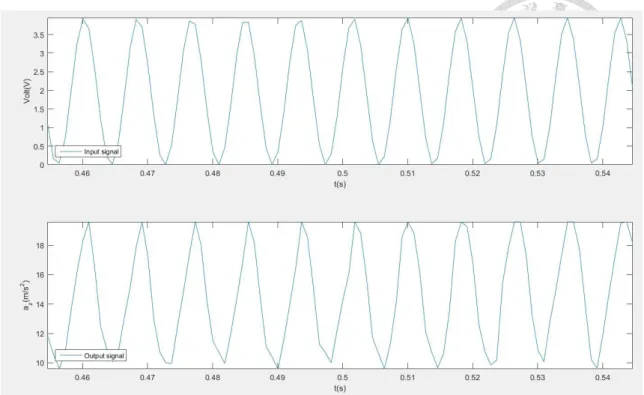
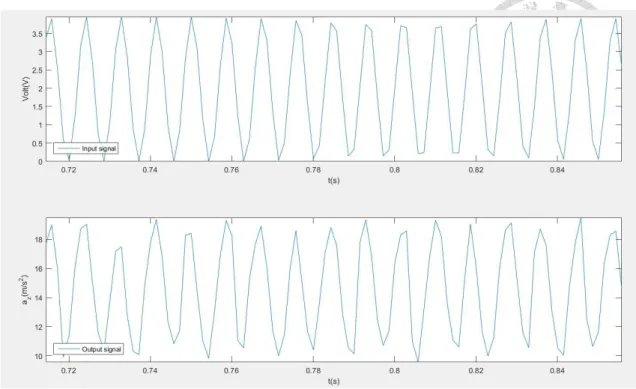
Figure 3.27 to Figure 3.34 show that the relationship between the input electrical signal for driving the piezo actuator and the output vibration acceleration for 100Hz, 150Hz, 200Hz, and 250Hz of sine and square waves. On top of figure is input signal for driving piezo actuator, and below is output vibration acceleration which record by accelerometer. The results show that the relationship between the input electrical signal and the output vibration acceleration is linear.
Figure 3.27 100 Hz sin wave
Figure 3.28 100 Hz square wave
Figure 3.29 150 Hz sin wave
Figure 3.30 150 Hz square wave
Figure 3.31 200 Hz sin wave
Figure 3.32 200 Hz square wave
Figure 3.33 250 Hz sin wave
Figure 3.34 250 Hz square wave
According to our experiment results, we can know the input electrical signal and output acceleration signal is a linear relation. So, we can use acceleration signal to be electrical signal to drive the piezo actuator directly. And the simulation process flowchart is shown in Figure 3.35.
Record texture data
Process texture data
Simulate texture vibration
Simulation device
MPU6050 FSR402
MEGA2560
Piezo actuator
ax,ay,az
∆f
Converting and Amplifying
circuit Digital output signal
Analog signal output
Figure 3.35 Simulation flowchart
Chapter 4 Experiment and User Test
4.1 Experiment
The experiment includes three parts: record texture data, process texture data, and simulate surface texture Four kinds of surface textures are tested: breadboard (Figure 4.1), plastic desk pad (Figure 4.2), rubber bubble pad (Figure 4.3) and 80-grit sandpaper (Figure 4.4). In this experiment, we use breadboard texture as example.
Figure 4.1 Breadboard
Figure 4.2 Plastic desk pad
Figure 4.3 Rubber bubble pad
Figure 4.4 Sandpaper
4.1.1 Record texture data
Figure 4.5 to Figure 4.12 show that the recorded data, z-axis acceleration, x-y plane velocity, delta force, and frequency domain z-axis acceleration data of the physical surface texture.
Figure 4.5 Recorded data of breadboard
Figure 4.6 Recorded z-axis signal of breadboard in frequency domain
Figure 4.7 Recorded data of plastic desk pad
Figure 4.8 Recorded z-axis signal of plastic desk pad in frequency domain
Figure 4.9 Recorded data of rubber bubble pad
Figure 4.10 Recorded z-axis signal of rubber bubble pad in frequency domain
Figure 4.11 Recorded data of sandpaper
Figure 4.12 Recorded z-axis signal of sandpaper in frequency domain
4.1.2 Process texture data
Figure 4.13 to Figure 4.20 show that the z-axis acceleration data before and after filtering.
Figure 4.13 z-axis signal after filtering of breadboard in time domain
Figure 4.14 z-axis signal after filtering of breadboard in frequency domain
Figure 4.15 z-axis signal after filtering of plastic desk pad in time domain
Figure 4.16 z-axis signal after filtering of plastic desk pad in frequency domain
Figure 4.17 z-axis signal after filtering of rubber bubble pad in time domain
Figure 4.18 z-axis signal after filtering of rubber bubble pad in frequency domain
Figure 4.19 z-axis signal after filtering of sandpaper in time domain
Figure 4.20 z-axis signal after filtering of sandpaper in frequency domain
4.1.3 Simulate texture data
Figure 4.21 to Figure 4.28 show that the time domain and frequency domain of the simulation signal.
Figure 4.21 Simulation z-axis signal of breadboard in time domain
Figure 4.22 Simulation z-axis signal of breadboard in frequency domain
Figure 4.23 Simulation z-axis signal of plastic desk pad in time domain
Figure 4.24 Simulation z-axis signal of plastic desk pad in frequency domain
Figure 4.25 Simulation z-axis signal of rubber bubble pad in time domain
Figure 4.26 Simulation z-axis signal of rubber bubble pad in frequency domain
Figure 4.27 Simulation z-axis signal of sandpaper in time domain
Figure 4.28 Simulation z-axis signal of sandpaper in frequency domain
4.2 User Test
intensity test, and haptic feedback texture distinguish test. The participants include 10 males and 10 females. The age range is between 20 and 25.
4.2.1 Haptic feedback distinguish test
The purpose of the haptic feedback distinguish test is to test if the participants can distinguish two different simulated surface textures. A questionnaire is designed for each texture for the haptic feedback distinguish test, as shown in Table 4.1
Table 4.1 Questionnaire 1
Option Feedback 1 Feedback 2
Plastic Desk pad
Simulated Plastic desk pad
feedback
Simulated Other texture feedback
Sandpaper Simulated Other texture feedback
Simulated Sandpaper feedback
Rubber Bubble pad
Simulated Rubber bubble pad
feedback
Simulated Other texture feedback
Breadboard Simulated Other texture feedback
Simulated Breadboard
feedback
User test
First, the participants touch the physical surface texture, then they are given two kinds of haptic feedback. One is the corresponding simulated texture, and the other one is other simulated texture. Participants need to choose which simulated texture matches the given physical texture. The intensities of the feedbacks are all controlled by voltage (45v).
Results
Figure 4.29 shows that females can distinguish real textures and corresponding simulated textures better than males. That might be because female’s hand is more sensitive than male’s. Generally speaking, female’s hands are tenderer and thinner than male’s hands. So females can distinguish the physical surface texture and corresponding simulated feedback with higher correct rate.
Figure 4.29 Correct rate for questionnaire 1
4.2.2 Haptic feedback intensity test
The purpose of the haptic feedback intensity test is to find the effects of the feedback intensity on the realism of simulation.
User test
Participants touch a real texture, then they are given a corresponding simulated haptic feedback. The intensities of the feedbacks are controlled by 0.25, 0.50, 0.75, and 1.00 times of the max voltage (45v), which is the working voltage of the piezo actuator. After the participants finished experiencing these feedbacks, they choose a level which matches the physical surface texture the most. The questionnaire is shown
in Table 4.2.
Table 4.2 Questionnaire 2
Options Level 1
(0.25)
Level 2 (0.50)
Level 3 (0.75)
Level 4 (1.00)
Max Voltage Plastic
desk pad
(45v)
Sandpaper (45v)
Rubber bubble pad
(45v)
Breadboard (45v)
Results
Figure 4.30 shows the results of the haptic feedback intensity test for the plastic desk pad. The results show that participants feel lower intensity feedback can simulate the plastic desk pad better. The reason might be because plastic desk pad is a smooth surface. So the recorded z-acceleration signal’s magnitude might be smaller than others.
The simulated feedback intensity with lower intensity makes participants feel like the plastic desk pad.
Figure 4.30 Result for Plastic desk pad
Figure 4.31 shows the results of the haptic feedback intensity test for the 80-grit sandpaper. The results show that participants feel medium-high intensity feedback can simulate the sand paper better. The reason might be because the sandpaper has hard and averagely distributed grit. So the recorded z-acceleration signal’s magnitude might be medium-high. The simulated feedback intensity with medium-high intensity makes participants feel like the sandpaper.
Figure 4.31 Result for Sandpaper
Figure 4.32 shows the results of the haptic feedback intensity test for the rubber bubble pad. The results show that participants feel medium-high intensity feedback can simulate the rubber bubble pad better. The reason might be because the rubber bubble pad has larger bump than other surface textures. So the recorded z-acceleration signal’s magnitude might be medium-high. The simulated feedback intensity with medium-high intensity makes participants feel like the rubber bubble pad.
Figure 4.33 shows the results of the haptic feedback intensity test for the
breadboard. The results show that participants feel low-medium intensity feedback can simulate the rubber bubble pad better. The reason might be because the breadboard has a lot of small holes, but it has smooth texture. So the recorded z-acceleration signal’s magnitude might be low-medium. The simulated feedback intensity with low-medium intensity makes participants feel like the breadboard.
Figure 4.33 Result for Breadboard
4.2.3 Haptic feedback texture distinguish test
The purpose of the haptic feedback texture distinguish test is to test if the participants can distinguish a simulated surface texture. The simulated surface texture feedback intensity is corresponding to the result of haptic feedback intensity test. A questionnaire is designed for each simulated feedback for the haptic feedback texture distinguish test, as shown in Table 4.3.
Table 4.3 Questionnaire 3 Options Breadboard Plastic
desk pad
Rubber
bubble pad Sandpaper Simulated
plastic desk pad feedback Simulated sandpaper feedback Simulated
rubber bubble pad
feedback Simulated Breadboard
feedback
User test
First, participants are given a simulated surface texture, then they touch the four kinds of physical surface textures. One is the corresponding physical surface texture.
Participants need to choose which physical surface texture matches the given simulated surface texture.
Result
Figure 4.34 shows that both males and females can distinguish the simulated
surface texture well. The reason might be because the rubber bubble pad is soft and deformable. It is difficult to simulate these properties by using vibration.
Figure 4.34 Correct rate for questionnaire 3
4.3 Discussion
This research presented a method to record the physical surface textures, process the data by neural network, and simulate the corresponding haptic feedback. Recording and simulating device were designed with the accelerometer, force sensor, piezo actuator, control board, and amplifying circuit. Users were given simulated haptic feedback.
The results showed that users can distinguish the different simulated haptic feedback with corresponding physical surface texture correctly. And the simulated feedback intensity had effect for users feeling the simulated corresponding feedback.
When the feedback intensities were the same level, users could not distinguish plastic desk pad and corresponding feedback well. And users could distinguish plastic desk pad and corresponding feedback in high correct rate after the feedback intensity was adjusted. But it was hard to present the soft and deformable properties by using vibration. Users could distinguish the hard physical surface texture in high correct rate, e.g., sandpaper, but they could not distinguish rubber bubble pad well. In addition, females and males had different results. Females could distinguish the different simulated feedback and corresponding better than males. It might be because that females’ hand were more sensitive than males’.
Romano et al. (2012) addressed that velocity and compressive force will affect the texture signals when users interact with physical texture. This research was inspired by the concept. This research also recorded velocity, acceleration and compressive force.
But this research recorded and simulated in natural operation. It provided users
Chapter 5 Conclusion and Future Work
5.1 Conclusion
A lot of haptic feedback devices transmit haptic sensations to users using handheld tools, which is not intuitive or conform to human natural operation. This thesis presents a method for recording the real world texture and rendering simulated haptic feedback using a natural user interface.
In this research, a recording device, a simulation device, and an approximate function are created to provide realistic haptic feedback. Using this method, surface texture can be recorded and simulated in a natural way.
We build record device, simulation device, and approximate function through neural network to provide haptic feedback. In our method, we can record and simulate in natural operating.
The results show that the simulation device can record a texture, and simulate this feedback and others, we can distinguish the correct one accurately. If we simulate an unknown feedback, we also distinguish this feedback correctly. But if the physical texture is soft or deformable, it is hard to simulate corresponding feedback by using vibration.
5.2 Future Work
This research still needs some improvements. The device cannot be operated in
record the compressive force. Without compressive force, the device will lose an important variable by using this method. And the amplifying and converting circuit has a large size that it cannot be set in the device to a portable device. Neural network system still has a little training problem. And approximate function programing in the device costs some computing time, it may affect users’ simulating experience.
In terms of future design, the operation in three dimension problem might be solved by using VR system. The compressive force can be calculated by virtual object’s deformations. It can be computed by using Hooke’s law. Neural network training problem can be solved by using other type of neural network. And the cost of computing time can be reduced by using a better control board.
If these problem can be solved, and the device is improved into wireless and portable. It can be used for VR and AR system to increase the immersion by providing corresponding haptic feedback.
REFERENCE
Aoki, T., Mitake, H., Keoki, D., Hasegawa, S., & Sato, M. (2009). Wearable haptic device to present contact sensation based on cutaneous sensation using thin wire.
The Proceedings of the International Conference on Advances in Computer Enterntainment Technology.
Bark, K., McMahan, W., Remington, A., Gewirtz, J., Wedmid, A., Lee, D. I., &
Kuchenbecker, K. J. (2013). In vivo validation of a system for haptic feedback of tool vibrations in robotic surgery. Surgical endoscopy, 27(2), 656-664.
Barrow, A.L., & Harwin, W.S. (2008). High Bandwidth, Large Workspace Haptic Interaction: Flying Phantoms. Symposium on Haptic interfaces for virtual environment and teleoperator systems, 295-302.
Bensma¨ıa, S., Hollins, M., Yau, J.: Vibrotactile intensity and frequency information in the Pacinian system: A psychophysical model. Perception and Psychophysics 67(5), 828–841 (2005)
Brisben, A., Hsiao, S., & Johnson, K. (1999). Detection of vibration transmitted through an object grasped in the hand. Journal of Neurophysiology, 81(4), 1548-1558.
Chodack, J., & Spampinato, P. (1991). Spacesuit glove thermal micrometeoroid garment protection versus human factors design parameters. SAE Technical Paper.
Retrieved from http://papers.sae.org/911383/ on 7/17/2015.
Culbertson, H., Unwin, J., & Kuchenbecker, K. J. (2014). Modeling and rendering realistic textures from unconstrained tool-surface interactions. IEEE transactions on haptics, 7(3), 381-393. ISO 690
Davis, R. A., Lee, T. C. M., & Rodriguez-Yam, G. A. (2006). Structural break estimation for nonstationary time series models. Journal of the American Statistical
Association, 101(473), 223-239.
Gallotti, P., Raposo, A., & Soares, L. (2011). v-Glove: A 3D virtual touch interface. XIII Symposium on the Virtual Reality (SVR).
Giraud, F., & Martinot, F. A Piezoelectric Tactile Display Using Travelling Lamb Wave.
Goldstein, E. (2009). Sensation and perception. Cengage Learning
Goto, M., & Takemura, K. (2013). Tactile bump display using electro-rheological fluid.
2013 IEEE/RSJ International Conference on Intelligent Robots and Systems, Tokyo, Japan, pp. 4478–4483.
Hashimoto, Y., Nakata, S., and Kajimoto, H. (2009). Novel tactile display for emotional tactile experience, Proceedings of the International Conference on Advances in Computer Enterntainment Technology, Athens, Greece, 124-131.
Ikei, Y. (2009). Development of Realistic Haptic Presentation Media. Virtual and Mixed Reality, LNCS 5622, 318–325.
Inoue, K., Kato, F., & Lee, S. (2009). Haptic device using flexible sheet and air jet for presenting virtual lumps under skin. IEEE/RSJ International Conference on Intelligent Robots and Systems, St. Louis, USA, pp. 1749–1754.
J. M. Romano and K. J. Kuchenbecker, “Creating realistic virtual textures from contact acceleration data,” IEEE Trans. Haptics,vol. 5, no. 2, pp. 109–119, Apr.–Jun. 2012.
Jansen, Y., Karrer, T., & Borchers, J. (2010). Mudpad: tactile feedback and haptic texture overlay for touch surfaces. ACM International Conference on Interactive Tabletops and Surfaces, New York, NY, USA, pp. 11–14.
Johansson, R. S., & Vallbo, Å . B. (1983). Tactile sensory coding in the glabrous skin of the human hand. Trends in Neurosciences, 6, pp. 27–32.
Johnson, K. O. (2001). The roles and functions of cutaneous mechanoreceptors. Current opinion in neurobiology, 11(4), 455-461.
Kaczmarek, K. A., Webster, J. G., Bach-y-Rita, P., & Tompkins, W. J. (1991).
Electrotactile and vibrotactile displays for sensory substitution systems. IEEE