An Interactive Tool for Data Visualization in Sequence Alignment
5
0
0
全文
(2) trial-and-error methods. We would like to point out that an efficient visualization system must correspond to basic design rules. Most importantly we have to consider the problem’s definition and purpose, as well as the data’s semantic meaning. The same data set has to have different visualization expressions based on different purposes, in much the same way as different persons will have different points of view about the same visualization image.. quence alignment. Compared with other alignment software tools in the literature (GeneDoc, BioEdit) [19], the proposed system improves user friendliness, generalizes the sequence pattern, and uses various figures of expression, which make the data easily understandable and interpretable.. 2. System Design Over the past ten years, genome sequencing has become an important research area in biological studies. Without a doubt, it will be a challenge for the future bio-medical scientist to combine biological, medical, and computer expertise to investigate the information contained in genes, to understand the structure and functions of genes, and the role of different biophysical and physiomedical conditions.. If an image contains too much data the results of visualization will lead to an inability to fully reveal and comprehend information due to the fact that the visual image appears to be cluttered. Therefore, simplification of the complex data is necessary. Simplification of the data, as well as retention of the data character, is very important for visualization. In general, the simplification technology for complicate data contains three simplifications: simplification of data amount, simplification of data dimension, and decrease of the data image directly. The data amount is simplified by using clustering or networks to decrease M1 sets of data into M2 sets (M1 >= M2). Simplification of data dimension can be achieved by using principal component analysis or networks to decrease N1 dimensions of each data set into N2 dimensions (N2 = 2, 3; N1 > N2) for conveniently obtaining data figures. Also, anti-aliasing technology is used to decrease the data image and keep the important visual patterns on image.. The calculation of alignment is one of the most basic tasks when analyzing biological sequences. For instance, any database search involves an alignment step. Algorithms to calculate alignments come in different flavors: routines to calculate global or local alignments, routines to calculate pair-wise or multiple alignments, routines to calculate strictly optimal or only nearly optimal (heuristic) alignments. Furthermore, algorithms are often tailored to specific situations. For instance, alignment of a genomic sequence with an mRNA-sequence is a different task – and is solved differently – than aligning two genomic sequences.. Benchmarking and verification of visualization techniques are lacking formal and general design rules. The major reason for this is the fact that visualization has to depend on a subjective point of view by the user; it is difficult to objectively define the quality and quantity of information, which is absorbed by the users from a data image. In the past, many scholars developed various visualization techniques. However, these are only applied in specific fields and have a special function. They are lacking formal discussion and we cannot be sure if these methods can be generalized. Therefore, designing and standardizing objective evaluations for benchmarking data sets is a worthy investigation point.. 2.1 Data Visualization The most challenging aspect of visualization is to express the large amounts and multiple dimensions of data on a computer screen. One of the difficulties is that data are N-dimensional (N >= 3), however a computer screen can only reveal two- or three-dimensional data. How to map N-dimensional data into 2D or 3D space is the first problem that has to be solved for data visualization. Another difficulty for visualization design is that we don’t really know how humans extract information from pictures or image. Even though there are theories of visualized recognition that can be used in some special fields, these theories actually do not provide much usefulness for visualization design. Moreover, it seems that visualization design is related to domain-specifics. It usually shows different results based on the definition of the problem, purpose, the background of people, experience and visual metaphors. Therefore, it is difficult to develop a formal and general rule for data visualization. At present, most scholars develop visualization technologies according to their experience and. 2.2 Software functions The sequence analysis process used is schematically summarized in Fig. 1. After the data input into the system, sequences that are to be compared are selected. These sequences are checked for alignment and the results can either be used as are, or can be compared to a web-based data bank. A further step visualizes the results and verifies them before the final data -2-.
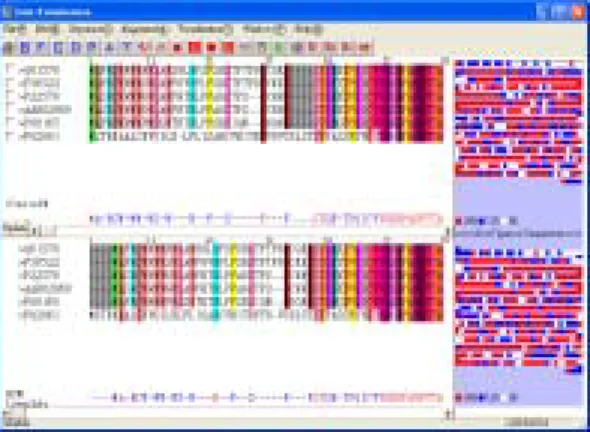
(3) ous alignment methods, which can be selected to facilitate comparison; (4) DATA VISUALIZATION: the system provides a variety of graphics visualizations, including line graphs, circles, histogram, text, degrees of similarity (entirely or partially color-coded or represented in dot maps); (5) HELP: introduces the purpose of the system, its operational methods, content of input data, and output results.. is graphically presented.. Data Input. Sequence Selection. Alignment Comparison. No. The system also contains auxiliary functions that simplify similarity comparisons. For example, if the similarity comparison of all samples leads to a result that still seems too cluttered, a partial comparison of selective samples can be conducted (Fig. 2-6). Additionally, the results of the sequence alignment obtained by different alignment methods can also be compared.. WWW Server for Sequence Alignment Comparison. Yes Alignment Result. Paste Sequence. Visualization of Alignment Results. Verification Process. Yes. No. Sequence Visualization. Visualization Output. Fig. 1 Schematics of the sequence analysis process. Fig. 2. Refined data analysis of randomly chosen sequencing data. There are six major functions incorporated in this system: (1) FILE: file operations include: creating, opening, saving, and submitting. The formats used are txt, doc, and aln (it was used in ClustalW); (2) EDIT: several editing functions, such as creating, deleting, shifting, are provided to help users to edit the sequence. A user can select the desired sequence or nucleic acid, then update, insert, or delete the sequence or nucleic acid. After the above operation, the data can be sent and compared to the web server again. This is enables the user to compare the modified sequence with the previous sequences; (3) ALIGNMENT METHOD: The alignment method can be used in conjunction with the WWW to compare DNA and protein sequences, and also in conjunction with other methods, including BLAST, ClustalW, BCM_Launcher, Multiple Alignment, FGENESH, GeneID (v.1), GeneMark.hmm (v. 2.2a), Genie, GENSCAN, GenView, Grail II, GrailEXP–Perceval (v.3.0), MZEF, AAT, GeneBuilder, GrailEXP, CluastalW, and ExPASy [11-18, 20]. Thus, users have vari-. Fig. 3. Amino acid groupings. -3-.
(4) seen, were designed and implemented to help determine the protein coding regions of a DNA or protein sequence. Many packages provide powerful alignment algorithms, such as T-Coffee [6, 21] and ClustalW [8], but they still need to be guided by human insight. Therefore, there is a need to integrate the sequence alignment visually [4]. In the proposed system, regions where both alignments coincide are color-coded to visualize the local agreement between the two alignments, and to identify regional similarities and differences of the alignments. The proposed system combines the following critical features:. Fig. 4. User-defined display segmentation. (1) Ability to visualize results of two different alignment methods simultaneously. (2) An annotation file for the base sequence, in txt, doc, and aln (ClustalW) format. (3) These different types of sequences: randomly generated sequence, customizable input sequence, and programmed default sequence. (4) The use of a continuous curve to represent the level of identification. (5) The interface is user friendly and operations can easily be modified by inserting or deleting a sequence.. Fig. 5. Similarity histogram of amino acids. (6) Option of inserting new sequences (7) Option of editing a sequence and a feature for real-time re-calculation of alignment. (8) A new line for sequence annotation purposes. (9) An alignment score view in the right panel beside the sequence alignment window. (10) A summary line that describes the chemical properties of amino acids (3 types- hydrophobic, charged and polar) Multiple alignments constitute an extremely powerful means of revealing the constraints imposed by structure and function on the evolution of a protein family. But, when the data is heterogeneous, knowing what is right and who is wrong becomes an art [5]. Addressing that type of question will be difficult and essential. The appropriate method would have to do this in a transparent way, letting the user visualize and control every bit of extra information that goes into his alignment. This ideal method should also allow the user to inject into his model some of his own knowledge. Doing so should be made an easy task.. Fig. 6. Wave presentation. 3. Results and Discussions The system is implemented using Microsoft Visual Basic 6.0, Windows version. Sequence analysis encompasses the use of various bioinformatics methods to determine the biological function and/or structure of genes and the proteins they encode. Several alignment method and tools which calculate the best match for the selected sequences, and line them up so that the identities, similarities and differences can be. The proposed system can be used in com-4-.
(5) multiple alignment and concensus sequence construction for biological sequences,” Computer Application in the Biosciences (CABIOS), vol. 7, no 2, pp. 195-202.. bination with existing WWW servers to compare protein sequences, or through the ACNUC server for nucleic acid sequences. Sequences can be entered by a user or extracted from SWISS-PROT, NCBI, GenBank, EMBL, or HOVERGEN. The system is also able to display sequence features along with the alignment. Data visual front-ends of biological sequences are necessary to make the process of viewing alignments intuitive and to facility discovery of conserved sequences for functionally significant regions. Due to the fact that the data contained in DNA or protein sequences are extremely large, a data mining technology should combine computer algorithm-based and visual mining. Information gathered by these means greatly enhances a scientist’s understanding of DNA and protein sequences.. [3]. W. M. David, Bioinformatics: Sequence and Genome Analysis, Cold Spring Harbor Laboratory Press, 2001. [4]. G. Grinstein, “Harnessing the Human in Knowledge Discovery”, Proceedings of the second International Conference on Knowledge Discovery and Data Mining, Portland, Simoudis, Han, and Fayyad (eds), pp. 384-385, August 1996.. [5]. J. D. Thompson, F. Plewniak, O. Poch, “A comprehensive comparison of multiple sequence alignment programs,” Nucleic Acids Res, vol. 27, no. 13, pp. 2682-2690, 1999.. [6]. C. Notredame , D.G. Higgins, J. Heringa , “TCoffee: A novel algorithm for multiple sequence alignment,” J. Mol. Biol., vol. 302, pp. 205- 217, 2000.. [7]. Alscript, http://www.compbio.dundee.ac.uk/ Software/Alscript/alscript.html. [8]. ClustalW, http://www.ebi.ac.uk/clustalw. [9]. DIALIGN http://bibiserv.techfak.uni- bielefeld.de/dialign/. [10]. http://bioweb.pasteur.fr/seqanal/alignment/ intro-uk.html. 4. Conclusions In this paper, we proposed an interactive graphical system, which can be used to visualize biological sequence alignments. Sequences can be entered by a user or extracted from a database. By clicking on a block, the user can visualize the corresponding local alignment. Visual front-ends are useful for an intuitive viewing of alignment and help to analyze the structure, functions, and evolution of the DNA and protein. The proposed system can be used in conjunction with the WWW to compare DNA and protein sequences. Experimental results shows that a user can easily operate the system after one hour’s practice on the proposed system, which provides a clean output, easy identification of similarity and visualization of alignment data.. [11]. http://blast.ym.edu.tw/indexEasy.php. [12]. http://fasta.bioch.virginia.edu/. [13]. http://gcg.nhri.org.tw/. [14]. http://genes.mit.edu/GENSCAN.html. [15]. http://genome.cs.mtu.edu/aat/aat.html. [16]. http://pcbi.upenn.edu/. [17]. http://searchlauncher.bcm.tmc.edu/. S. F. Altschul, W. Gish, W. Miller, E. Myers and D. Lipman, “A basic local alignment search tool,” J. Mol. Biol. vol. 215, pp 403-410, 1990.. [18]. http://www.doctors.com.tw/. [19]. http://www.ebi.ac.uk/. [20]. http://www.ncbi.nlm.nih.gov/. C. Cappey, A. Danckaert, P. Dessen, and S. Hazout. Mash, “an interactive program for. [21]. 5. References [1]. [2]. -5-. T-Coffee, http://www.ch.embnet.org/ software /TCoffee.html.
(6)
數據

相關文件
Reading Task 6: Genre Structure and Language Features. • Now let’s look at how language features (e.g. sentence patterns) are connected to the structure
Now, nearly all of the current flows through wire S since it has a much lower resistance than the light bulb. The light bulb does not glow because the current flowing through it
The nanostructure with anisotropic transmission characteristics on ITO films induced by fs laser can be used for the alignment layer , polarizer and conducting layer in LCD cell.
Finally, we use the jump parameters calibrated to the iTraxx market quotes on April 2, 2008 to compare the results of model spreads generated by the analytical method with
synchronized: binds operations altogether (with respect to a lock) synchronized method: the lock is the class (for static method) or the object (for non-static method). usually used
In other words, the partition nodes bounding the problem do not occur at immediate neighbors in the grid, hence there is at least one point on the partition line lying between
The corresponding order for progres- sive alignment would be to align sequences from human and galago, then to align the resulting pairwise alignment with the rabbit sequences,
BLAST is still one of the most robust and efficient sequence-matching and sequence- alignment
