Molecular Adsorption at Silica/CH
3
CN Interface
Probed by Using Evanescent Wave Cavity
Ring-Down Absorption Spectroscopy:
Determination of Thermodynamic Properties
Hsiu-Fang Fan, Chien-Yi Hung, and King-Chuen Lin*Department of Chemistry, National Taiwan University, Taipei 106, Taiwan, and Institute of Atomic and Molecular Sciences, Academia Sinica, Taipei 106, Taiwan
Evanescent wave cavity ring-down absorption spectros-copy is applied to measure the thermodynamic properties of the surface adsorption for neutral trans-4-[4-(dibutyl-amino)styryl]-1-(3-sulfopropyl) pyridinium (DP) and charged trans-4-[4-(dibutylamino)styryl]-1-methylpyri-dinium iodide (DMP+I-) at the silica/CH3CN interface, where the interfacial density is determined by measure-ment of absorbance. The bulk concentration dependence of the surface density may be characterized with a Lang-muir isotherm model, which yields saturated surface density, equilibrium constant, and free energy of adsorp-tion of (7.0 ( 0.3)× 1013cm-2, (1.3 ( 0.2)× 104M-1,
and -23.5 ( 0.4 kJ/mol for DP and (8.9 ( 0.3)× 1012 cm-2, (2.6 ( 0.7)× 104M-1, and -25.2 ( 0.6 kJ/mol
for DMP+I-, respectively. The surface density of the isolated silanol groups may then be estimated in terms of the molecular probe results. The absorption contribu-tion from the bulk solucontribu-tion is a factor of ∼101-102 smaller than the total absorbance measured such that subtraction of the bulk contribution leads to negligible change of the thermodynamic properties. The DP is adsorbed to the SiOH sites by forming hydrogen bonds, while the DMP+ cation is bound to the SiO- sites by electrostatic attraction. Surface forces are also probed by addition of triethylamine (TEA), which is competitive with DP for the silanol sites. When the TEA concentration is increased, the DP surface density is found to decrease, whereas the DMP+ surface density increases. The ob-tained thermodynamic properties are generally consistent with those measured by second harmonic generation spectroscopy. However, when a tetramethylammonium ((CH3)4N+Cl-) salt is added, the DMP+ cation behaves differently between these two methods. Formation of an electrical double layer may account for the difference.
The cavity ring-down absorption spectroscopy (CRDS) has been widely applied in the studies of spectroscopy, kinetics, dynamics, and photochemistry in gas phase.1-8Until recently, this
technique has been extended to the applications of thin film,9-14 condensed matter, and surface15-20after some modification of the designs. CRDS relies on measurement of the decay rate of light trapped in an optical cavity with high reflectance. When a pulsed laser radiation is guided into an optical cavity, confined by a pair of highly reflective mirrors (R >99.9%), the trapped light reflects between two mirrors leaking a small fraction for each pass. The decay rate of the light transmitting through the cavity is related to the absorption coefficient of the sample in the cavity. As a potential absorption technique, CRDS owns the following advan-tages: (1) independence of fluctuation of radiation intensity, (2) more sensitivity than conventional absorption methods due to a longer optical path, and (3) ease in setting up the apparatus.7,8
Evanescent wave-CRDS, which combines the CRDS technique with the attenuated total reflectance method, was first developed
* To whom correspondence should be sent. Fax: 886-2-23621483. E-mail: kclin@ccms.ntu.edu.tw.
(1) O’Keefe, A.; Deacon, D. A. G. Rev. Sci. Instrum. 1988, 59, 2544-2551.
(2) O’Keefe, A.; Scherer, J. J.; Cooksy, A. L.; Sheeks, R.; Heath, J.; Saykally, R. J. Chem. Phys. Lett. 1990, 173, 214-218.
(3) Benard, D. J.; Winker, K. B. J. Appl. Phys. 1991, 69, 2805-2809. (4) Pearson, J.; Orr-Ewing, A. J.; Ashfold, M. N. R.; Dixon, R. N. J. Chem. Phys.
1997, 106, 5850-5873.
(5) Lommatzsch, U.; Wahl, E. H.; Owano, T. G.; Kruger, C. H.; Zare, R. N. Chem. Phys. Lett.2000, 320, 339-344.
(6) Huang, H. Y.; Chuang, W. T.; Sharma, R. C.; Hsu, C. Y.; Lin, K. C.; Hu, C. H. J. Chem. Phys. 2004, 121, 5253-5260.
(7) Scherer, J. J.; Paul, J. B.; O’Keefe, A.; Saykally, R. J.; Chem. Rev. 1997, 97, 25-52.
(8) Berden, G.; Peeters, R.; Meijer, G. Int. Rev. Phys. Chem. 2000, 19, 565-607.
(9) Pipino, A. C. R.; Hudgens, J. W.; Huie, R. E. Rev. Sci. Instrum. 1997, 68, 2978-2989.
(10) Pipino, A. C. R.; Hudgens, J. W.; Huie, R. E. Chem. Phys. Lett. 1997, 280, 104-112.
(11) Pipino, A. C. R. Phys. Rev. Lett. 1999, 83, 3093-3096. (12) Pipino, A. C. R. Appl. Opt. 2000, 39, 1449-1453.
(13) Pipino, A. C. R.; Hoefnagels, J. P. M.; Watanabe, N. J. Chem. Phys. 2004, 120, 2879-2888.
(14) Li, F.; Zare, R. N. J. Phys. Chem. B 2005, 109, 3330-3333.
(15) Hallock, A. J.; Berman, E. S. F.; Zare, R. N. Anal. Chem. 2002, 74, 1741-1743.
(16) Shaw, A. M.; Hannon, T. E.; Li, F.; Zare, R. N. J. Phys. Chem. B 2003, 107, 7070-7075.
(17) Tarsa, P. B.; Rabinowitz, P.; Lehmann, K. K. Chem. Phys. Lett. 2004, 383, 297-303.
(18) Tarsa, P. B.; Wist, A. D.; Rabinowitz, P.; Lehmann, K. K. Appl. Phys. Lett.
2004, 85, 4523-4525.
(19) Hannon, T. E.; Chah, S.; Zare, R. N. J. Phys. Chem. B 2005, 109, 7435-7442.
(20) Fisk, J. D.; Batten, R.; Jones, G.; O′Reilly, J. P.; Shaw, A. M. J. Phys. Chem. B2005, 109, 14475-14480.
Anal. Chem.2006,78,3583-3590
10.1021/ac0520588 CCC: $33.50 © 2006 American Chemical Society Analytical Chemistry, Vol. 78, No. 11, June 1, 2006 3583
Downloaded by NATIONAL TAIWAN UNIV on September 8, 2009 | http://pubs.acs.org
by Pipino et al. to probe species at the air/solid interface.9 Detection of I2 adsorbed at the gas/silica interface is then demonstrated with a minimum detectable coverage of ∼0.04 monolayer determined.10The evanescent wave formed during the totally internal reflection (TIR) may be absorbed by the sample presented in the media with lower refractive index such that the resultant intensity of reflected radiation is reduced. The evanescent wave-CRDS method is advantageous for the studies of thin-film and surface processes, since the electric field intensity at the TIR surfaces may be enhanced and the interference fringes inherent in the thin film may be concomitantly minimized. This method has been increasingly employed to probe the interfacial phenomena9-22such as adsorption behavior controlled at various conditions,16,20structure of absorbed species,21absolute surface coverage,13 adsorption constants for monolayer and within the layers,22 and molecular orientation at the gas or liquid/solid interface.13,14By using this technique, we aim at the interfacial adsorption of adsorbates with either neutral or charged features to determine the related thermodynamic properties. Similar investigation
has attracted wide attention, especially in the field of chromatography.23-26Research is actively focused on the inter-facial interaction between stationary and mobile phases in order to improve the separation efficiency.
In this work, the evanescent wave-CRDS technique is com-posed of a linear optical cavity, a prism specially designed to allow
for TIR occurrence, and a flow cell in which the flowing adsorbate may absorb the evanescent wave penetrating through the prism base. trans-4-[4-(Dibutylamino)styryl]-1-(3-sulfopropyl)pyridinium (DP) and trans-4-[4-(dibutylamino)styryl]-1-methylpyridinium io-dide (DMP+I-) are adopted as neutral and charged species. Their adsorption behaviors at the silica/CH3CN interface are character-ized. DMPI dissociates completely to release DMP+and I-in the CH3CN solvent. At the low concentration range, the Langmuir isotherm model is applied to determine saturated surface density, equilibrium constant, and free energy of adsorption of DP and DMP+at the interface. The thermodynamic properties depend on the interfacial forces. A triethylamine (TEA) is added simul-taneously for competitive adsorption to help distinguish the individual attractive forces. The coadsorption phenomenon by addition of tetramethylammonium (TMAC, (CH3)4N+Cl-) is also investigated. The results will be compared to those obtained by Xu and co-workers using second harmonic generation (SHG) spectroscopy.24,27
EXPERIMENTAL SECTION
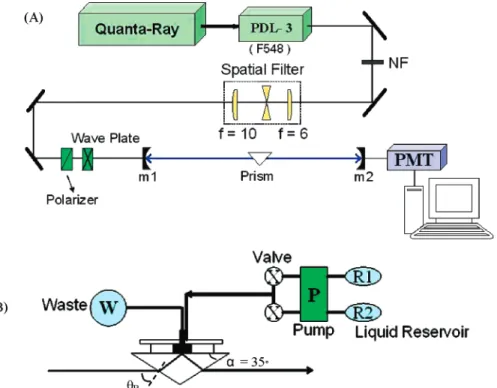
The evanescent wave-CRDS apparatus used in this work is depicted in Figure 1. A tunable dye laser working on fluorescein 548, pumped by a 10-Hz, 5-8-ns pulsed second harmonic of Nd: YAG laser, was used, emitting at 542 nm. To remain mostly TEM00 mode, the pulse beam was guided through a spatial filter made of a pair of lenses of 6- and 10-cm focal lengths and a pinhole with 50-µm diameter. The output pulse energy was at 10-15 mJ. After passing through pieces of the optics, the pulse beam with 2-3 mJ left entered the front mirror of the optical cavity. The beam was p-polarized in parallel to the incident plane with a polarizer and a half-wave plate. Since the beam was injected into a prism assembly inside the cavity at a Brewster angle, the p-polarization of radiation can minimize the scattering losses.
(21) Aarts, I. M. P.; Pipino, A. C. R.; Hoefnagels, J. P. M.; Kessels, W. M. M.; van de Sanden, M. C. M. Phys. Rev. Lett. 2005, 95, 166104-1-166104-4. (22) Martin, W. B.; Mirov, S.; Martyshkin, D.; Venugopalan, R.; Shaw, A. M. J.
Biomed. Opt.2005, 10, 024025-1-024025-7.
(23) Huang, X.; Kovaleski, J. M.; Wirth, M. J. Anal. Chem. 1996, 68, 4119-4123.
(24) Xu, Z.; Dong, Y. J. Phys. Chem. B 2001, 105, 3741-3746.
(25) Cikalo, M. G.; Bartle, K. D.; Myers, P. J. Chromatogr. 1999, 836, 35-51. (26) Ruthven, D. M. Principles of Adsorption and Adsorption Processes; John Wiley
& Sons: New York, 1984. (27) Xu, Zhi, Li, J.; Dong, Y. Langmuir 1998, 14, 1183-1188.
Figure 1. (a) Schematic diagram of the apparatus setup for evanescent wave cavity ring-down absorption spectroscopy. (b) Detailed diagram for the flow cell, which is mounted on the top of an isosceles triangle prism.
Downloaded by NATIONAL TAIWAN UNIV on September 8, 2009 | http://pubs.acs.org
The linear optical cavity was confined between two mirrors with high reflectance, >99.9% at 550 nm, a diameter of 25.4 mm and a radius of curvature of 100 cm. The mirrors were mounted at∼100 cm apart in such a way that their positions may be slightly adjusted to trap a laser pulse by ensuring it bounced back and forth between two mirrors. The p-polarized radiation was guided through the front mirror into a triangular BK7 prism (borosilicate crown glass), an isosceles triangle with the apex 110°specially designed. The pulse beam into the prism was totally reflected with evanescent field penetration through the prism base, polished to a flatness of λ/10 with an rms roughness of∼1.5 nm. A flow cell was mounted on the prism base. The flow rates of sample solution and solvent were regulated at 2.2 mL/min by a peristaltic pump, and their flow pathways were controlled by individual four-channel valve as depicted in the figure. The evanescent wave may be absorbed by the flowing adsorbate at the silica/CH3CN interface. The refracted beam still kept along the original direction into the rear mirror, behind which a photomultiplier tube (PMT), biased at -(300-400) V, was positioned to detect the leaking light intensity on each round trip. The signal intensity was inspected to avoid any optical saturation of the PMT. The temporal profile of the ring-down signal was recorded on a transit digitizer and transferred to a personal computer. The ring-down time may be determined by a best fit of the acquired exponential decay.6,28
While taking into account the round-trip time of 6.6 ns, the ring-down time of 630 ns for a blank solution in the cell, and a relative standard deviation of 0.016 in the ring-down time mea-surements, the minimum detectable absorbance for the current system may be estimated to be 2× 10-4,14,29much better than conventional spectroscopy such as single-point total internal reflection spectroscopy and UV/visible spectroscopy. As compared to the gas-phase CRDS, the smaller ring-down time is caused by the light losses of the system, which are mainly attributed to mirror losses, prism attenuation and scattering, and polarization-dependent losses.10Given the ring-down time of 1.5 µs for the empty cavity, the mirror loss per round trip may be estimated to be∼0.0044 by the formula
where tris the round-trip time. The ring-down time then drops to 630 ns with the prism implemented. The cavity loss is∼0.0061, which has included bulk absorption, surface scattering, and polarization-dependent losses. Among them, the surface-scattering loss is calculated∼0.0055, while the in-plane polarization loss is ∼0.000 15, assuming the prism angle deviates within (5 arc min.10 Sensitivity of the current design may be significantly enhanced with improvement of the mirror reflectivity and the prism roughness. For instance, Aarts et al. have recently designed a near-infrared evanescent wave-CRDS, with a surface reflectivity of >99.998% and an rms roughness of 0.05 nm, for structure determination of an H2O monolayer on hydroxylated silica.21The optical loss per pass of miniature resonator reaches the minimum of 2.0× 10⁻⁵with the relative standard deviation of 1.5× 10⁻³at 1205 nm. The resultant sensitivity is >1000 better than our system.21
In this work, the dye reagents DMP+I-and DP were purchased without further purification. These two molecules have similar structures with the common hemicyanite chromophore. They may be easily dissolved in the organic solvent of acetonitrile (CH3CN) to form a purple-reddish solution. TEA and TMAC, as the competitive adsorbates, were also used directly from the purchase. For concentration-dependence measurements, a concentrated solution was prepared and then diluted to the desired concentra-tions.
KINETIC MODEL
When DP (or DMP+) is adsorbed at the silica/CH3CN interface to form a monolayer under the condition of low concentration, its adsorption behavior may be characterized by the Langmuir adsorption isotherm. The Langmuir equation may be derived, assuming the rate of adsorption on the bare surface is equal to the rate of desorption from the monolayer at equilibrium, and the rate constants of adsorption and desorption are independent of the number of adsorbed molecules already present on the surface. The equation is simplified in the following:
or
where θ is the fraction of surface coverage, K, the adsorption equilibrium constant, and C, the concentration of adsorbate. θ is defined as the ratio of the surface density, N, occupied by the adsorbate to the saturated surface density, No. θ may be related to the absorbance, A, at the silica/CH3CN interface by the following equation,16,30
where F is the surface density of silanol groups, σ, the absorption cross section of the electronic transition, and θi, the incident angle into the silica/CH3CN interface. The 1/cos θiterm accounts for the increased sampling area for oblique incidence.30 Since θ i controlled at 68.3°exceeds the critical angle, the total reflection occurs inside the prism, not at the interface between silica surface and adsorbed species. Thus, the electric field enhancement caused by the thin film on the substrate surface should be negligible.30F can be regarded as the upper limit of the saturated surface density of the adsorbate. When N ) No, θ becomes unity. Thus, Ao)
Noσ/cos θi∼ Fσ/cos θi, assuming each silanol is occupied. Aois the absorbance for the saturated surface density. Substituting eq 4 into eq 2 yields
(28) Hsu, C. Y.; Huang, H. Y.; Lin, K. C. J. Chem. Phys. 2005, 123, 134312-134318.
(29) Romanini, D.; Lehmann, K. J. Chem. Phys. 1993, 99, 6287-6301.
(30) Harrick, N. J. Internal Reflection Spectroscopy; Wiley & Sons: New York, 1967. τ′(v) ) tr/Lmirror (1) θ ) KC/(1 + KC) (2) 1/θ ) 1 + 1/KC (3) A ) Fθσ/cos θi (4) A ) Fσ cosθi
(
KC 1 + KC)
Downloaded by NATIONAL TAIWAN UNIV on September 8, 2009 | http://pubs.acs.org
Given the A and C measurements for DP and DMP+, the corresponding equilibrium constant may be determined by using eq 5. In the evanescent wave-CRDS experiments, the absorption coefficient, R, can be obtained according to the following equation,
where τ and τo are the ring-down time as measured with and without adsorbate involved, respectively; c is the light speed; and
land L denote the penetration depth of evanescent wave and the length of optical cavity, respectively. We simply consider L )100 cm, the distance between two refractive mirrors, but neglect the small additional optical length inside the prism caused by different refractive indexes at the interface. The absorbance is equal to 0.434Rl31and may be further related to the ring-down time as follows:
RESULTS AND DISCUSSION
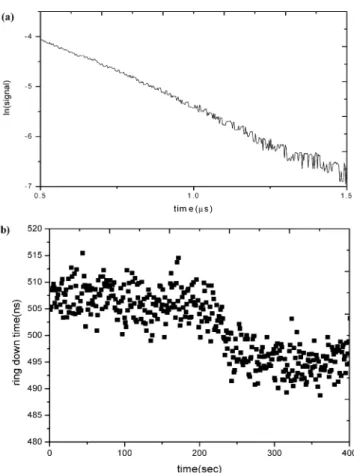
A. Adsorption of DP and DMPI at Silica/CH3CN Interface. As shown in Figure 2, the ring-down time, caused by the absorption of evanescent wave in the flow cell, can be well characterized by an exponential function. The ring-down time lasts ∼630 ns under the optimal condition, when only solvent is flowed through the cell. It remains almost constant, indicating that the system is stable for a long period. The ring-down time then decreases as the evanescent wave is absorbed by the adsorbate injected in the flow cell (Figure 2b). The ring-down time reaches constancy again when the adsorption and desorption processes equilibrate. As shown in Figure 3, when the bulk concentration of DP increases from 10-5up to 10-3M, the absorbance increases rapidly in the early stage and then reaches a plateau at high concentration. The plateau formation is indicative of monolayer coverage of the adsorbate. Herein, the absorbance is evaluated using eq 7, as the ring-down times of the solvent and the sample solution are measured. The behavior of the adsorption isotherm can be well characterized by a simple Langmuir equation. The interfacial interaction between DP and substrate surface should be strong, forming a monolayer with gradual increase of the concentration. The best fit to the experimental findings using eq 5 yields two parameters: one is Ao) (3.1 ( 0.1) × 10-3and the other is K ) (1.3 ( 0.2)× 104M-1. All the uncertainties involved in this work denote one standard deviation, the 68% confidence interval. The free energy of adsorption may be evaluated to be -23.5 ( 0.4 kJ/mol, according to the formula, ∆G ) -RT ln K (R, gas constant; T, absolute temperature). Alternatively, as shown in Figure 3b, the K value is obtained from the slope in the plot of 1/θ versus 1/C, according to eq 3. θ is expressed as the relative absorbance, A/Ao. The results are consistent with each other.
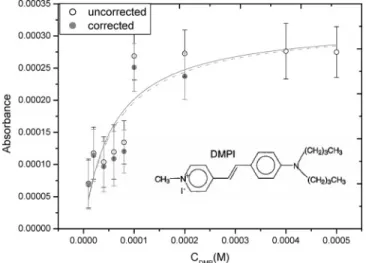
When DMPI is substituted for DP, the concentration depen-dence of absorbance shows a similar behavior in Figure 4. The absorbance rises with the concentration in the early stage and then approaches a plateau. The curve is best fitted using the Langmuir adsorption isotherm, yielding the parameters, Ao) (4.6 ( 0.3) × 10-4and K ) (2.6 ( 0.7)× 104M-1. The free energy of adsorption is thus evaluated of -25.2 ( 0.6 kJ/mol. As compared between Figures 3 and 4, the fitting quality for DMPI is worse, with a square of regression coefficient of∼0.86. It could be caused by two reasons. First, the absorbance measured for DMPI is close to the detection limit, bearing a large uncertainty. Second, cleanup difficulty of the sample is problematic. The DMP+ cation is adsorbed strongly on the silica surface. To clean up the DMP+ residue, the cell should be washed with a flow of acetonitrile solvent, followed by 1 M HCl solution and distilled water. The whole process takes∼20 min to restore the original conditions for the next experiment of concentration dependence. The prolonged cleanup procedure may cause the system to be instable, thereby increasing the data fluctuation and uncertainty. In contrast, the DP residue in the cell is readily cleaned up with a rapid flow of solvent. From comparison of the data of K or ∆G, the DMP+ adsorption at the interface is stronger. The DMP+ cation is expected to adsorb on the SiO-site via electrostatic interaction, while DP is bound to SiOH via van der Waals interaction, especially formation of the hydrogen bond. The obtained ther-modynamic data generally agree with those reported by Xu and co-workers using SHG spectroscopy.27They have obtained K ) 8260 and ∆G ) -22.0 kJ/mol for DP and 32 500 and -25.5 kJ/
(31) Ingle, Jr., J. D.; Crouch, S. R. Spectrochemical Analysis; Prentice Hall: London, 1988. ) Ao KC 1 + KC (5) R ) L cl
(
1 τ- 1τo)
(6) A )0.434L c(
1 τ- 1τo)
(7)Figure 2. (a) Ring-down time of a blank solution on a logarithmic scale. (b) Data acquisition of the ring-down time for the CH3CN solvent
(data points within earlier 200 s) and DMPI solution at 2×10⁻⁵M.
The flow rates are regulated at 2.2 mL/min by a peristaltic pump.
Downloaded by NATIONAL TAIWAN UNIV on September 8, 2009 | http://pubs.acs.org
mol for DMPI at the similar silica/CH3CN interface. A slight discrepancy may be caused by the structure difference of the substrate surfaces. The BK7 glass prism used in this work contains about 5-20% B2O3. The boron oxide might interfere with the adsorption processes. The general agreement of the thermody-namic data may support justification for the effective probe of the monolayer at the interface by the evanescent wave-CRDS tech-nique.
According to the best fit using the Langmuir equation, the absorbance for the saturated surface density of DP and DMPI may be obtained to be 3.1× 10⁻³and 4.6× 10⁻⁴, respectively. Given the absorption cross section, σ, the saturated surface density of adsorbate may then be determined following the formula, No ) cos θiAo/σp. Since the interfacial absorption cross section, σp, associated with the p-polarized radiation may not be obtained directly, the value, σsol, acquired for the solution absorption by an unpolarized radiation is substituted with correction as follows: 13,32,33
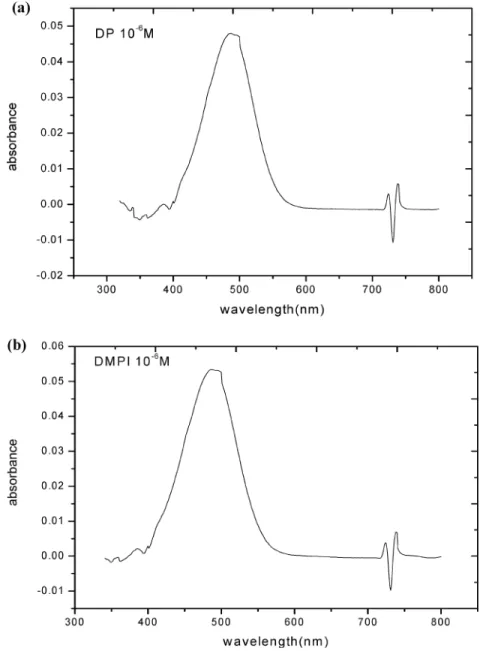
where Ap and As denote the absorbance in terms of p- and s-polarized radiation, respectively. The factor 3/2 is included to correct the orientation freedom of molecules at the surface versus those in the solution.13,32Figure 5 shows UV/visible absorption spectra of DP and DMPI, both prepared at 1.0× 10⁻⁶M with the CH3CN solvent, yielding the corresponding values, σsol, of (1.7 ( 0.2)× 10-17and (2.2 ( 0.2)× 10-17cm2at the wavelength 542 nm. Given the average orientation angles 32° and 37° of the transition dipole moments of DP and DMP+,27respectively, with respect to the surface normal, the fraction of Ap/(Ap + As) is readily determined.14Accordingly, the saturated surface densities of DP and DMP+may be evaluated to be (7.4 ( 0.3)× 1013and (8.3 ( 0.3)× 1012cm-2, respectively.
Xu and co-workers have used crystal violet (CV+) as a nonlinear optical molecular probe to find that there exist two types of isolated silanol groups on the planar silica surface.34The surface density of the first type is∼1.1 × 1013cm-2, including those groups each surrounded by a large empty surface area (>120 Å2). The surface density of the second type is 8.2× 1013cm-2, including the rest of the isolated silanol groups. Assume the total surface density of isolated silanol groups corresponds to the saturated surface density determined with DP. Then, the surface density of silanol groups obtained in this work is consistent with those determined on the fused silica. The reason for only one adsorption equilibrium constant determined for the two binding types is caused by a size effect of the molecular probe. Since DP (or DMP+) has an area of∼50 Å2, much less than the surface area 120 Å2owned by CV+, it may not feel significantly the repulsive
(32) Elking, M. D.; He, G.; Xu, Z. J. Chem. Phys. 1996, 105, 6565-6573.
(33) The ratio Ap/(Ap+ As) has taken into account the molecular orientation,
which is involved in the term cos θ (θ, average orientation angle) of refs 13 and 32. Also, the factor 3/2 is used, since σpdenotes the absorption cross
section. The same symbol is adopted in ref 32, but indicates the surface density.
(34) Dong, Y.; Pappu, S. V.; Xu, Z. Anal. Chem. 1998, 70, 4730-4735.
Figure 3. (a) Concentration dependence of absorbance isotherm of DP at silica/CH3CN interface. The solid curve indicates the best fit
based on the Langmuir adsorption model, yielding the adsorption equilibrium constant of (1.3(0.2)×104M-1and the absorbance of
(3.1( 0.1)×10-3for the saturated surface density. The dashed
curve indicates the best fit after subtraction of the bulk contribution. (b) A linear plot of Langmuir adsorption model based on eq 3 in the text. The relative absorbance is obtained by a ratio ofA/Ao, in which
Aois the absorbance for the saturated surface density.
Figure 4. Concentration dependence of absorbance isotherm of DMPI at silica/CH3CN interface. The solid curve indicates the best fit
based on the Langmuir adsorption model, yielding the adsorption equilibrium constant of (2.6(0.7)×104M-1and the absorbance of
(4.6(0.3)× 10-4for the saturated surface density. The dashed
curve indicates the best fit after subtraction of the bulk contribution.
σp) σsol 3 2
(
Ap
Ap+ As
)
(8)Downloaded by NATIONAL TAIWAN UNIV on September 8, 2009 | http://pubs.acs.org
force from the neighboring silanol groups, separated 3-5 Å apart. Unlike the work by Xu and co-workers,34herein the absorption isotherm may well be characterized by a simple Langmuir eq 2. In contrast, the surface density of SiO-groups determined by DMPI corresponds to∼10% of the total isolated silanol groups. The distinct difference arises from the fact that the prism surface will be washed with hydrochloric acid, followed by flow with distilled water and CH3CN before each measurement. Thus the refreshed surface becomes hydrophilic and readily attracts DP. Despite the proton abstraction tendency by the lone pair of electrons on CH3CN, only a small amount of SiO-is formed. The resultant SiO- repels the DP approach via the SiO--SO
3 -repulsion but attracts DMP+ by the SiO--N+attractive force. Much less SiO-sites available result in a smaller value of saturated surface density formed by DMP+.
B. Effect of TEA Addition. TEA owns a lone pair of electrons on the N atom, capable of removing a proton from the silanol group. Thus, addition of TEA may compete with DP for the SiOH sites, thereby interfering with the adsorption efficiency of DP and DMPI. To characterize the competitive adsorption behavior, the
Langmuir model may be modified. Assuming the adsorption processes of DP and TEA on the substrate surface reach equilibrium independently, their equilibrium constants may be expressed by KDP) NDP/CDPNand KTEA) NTEA/CTEAN, in which
NDP, NTEA, and N indicate the DP-occupied, TEA-occupied, and free silanol groups on the surface, respectively. Given the equation
No) N + NDP+ NTEA, then θDP) NDP/No) NDP/(N + NDP+
NTEA). Substitution of NDPand NTEAyields
Given the fraction of surface coverage without TEA as a reference, i.e.,
θDPo ) KDPCDP/(1 + KDPCDP), then the ratio of θDP to θDP o
becomes
Figure 5. UV/visible absorption spectra for (a) DP and (b) DMPI, each prepared at 1.0×10⁻⁶M.
θDP) KDPCDP 1 + KDPCDP+ KTEACTEA (9) θDP θDP o ) 1 + KDPCDP 1 + KDPCDP+ KTEACTEA (10)
Downloaded by NATIONAL TAIWAN UNIV on September 8, 2009 | http://pubs.acs.org
The above ratio may be measured by the relative absorbance, ADP/
ADPo , in which ADPo is the DP absorbance without TEA involved.
As shown in Figure 6, the relative absorbance of DP at 1.0× 10⁻⁴M decreases as a result of TEA increment from 3.0× 10⁻⁴ to 4.2× 10⁻³M. TEA competes for the SiOH sites to cause decay of the DP absorbance. Given KDP) 1.3 × 10⁴, CDP) 1.0 × 10⁻⁴ M, the theoretical fit by eq 10 to the plot of relative absorbance versus TEA concentration yields KTEA of 646 ( 39 M-1. The subsequent free energy of adsorption is -16.0 ( 0.1 kJ/mol. On the contrary, as shown in Figure 7, the relative absorbance of DMPI is enhanced by 1.5 times prior to leveling off, when the TEA concentration is increased up to 7.0× 10⁻⁴M. Therefore, TEA may cause two effects. First, it competes with DP for the SiOH sites. Second, the pair of TEA...SiOH may further undergo base ionization to form TEAH+ and SiO-. The increased SiO -density results in enhancement of the DMPI absorbance. It is clear that DP and DMPI have different binding sites. DP is adsorbed
on the SiOH site, while DMPI readily dissociates to form the stable ion pair of DMP+...SiO-.
The TEA dependence of the DP and DMPI adsorption agrees with the previous work by the Xu group,27 but with a smaller equilibrium constant and free energy of adsorption on the BK7 glass surface. As reported on the fused-silica substrate,27addition of 1.0× 10⁻⁴M TEA may enhance by four times the binding sites of SiO- for the DMPI adsorption, whereas only 1.3 times enhancement is found in this work. Although the concentration of SiO-increases with TEA, the concomitant increase of TEAH+ competes for the SiO-sites, thereby suppressing the increased rate of the DMP+...SiO-pair. That is why the absorbance reaches a plateau, as TEA exceeds 1.5× 10⁻⁴M.
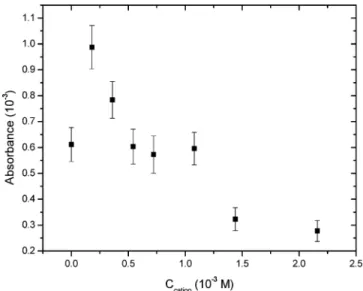
C. Effect of TMAC Addition. Since DMP+attacks the SiO -sites on the surface, addition of cations may compete for the SiO -sites. The increased concentration of the TMAC salt ((CH3)4N+Cl -f (CH3)4N++ Cl-in the CH3CN solution) in a DMPI solution at 5.0 × 10⁻⁴ M surely affects the absorbance of DMPI at the interface. As shown in Figure 8, its absorbance rises in the early stage and then decreases with increasing TMAC concentration. A different behavior in the early stage is found by the SHG method;24the DMPI surface density decreases monotonically with the TMAC concentration. Xu and co-workers demonstrated that the adsorption and coadsorption of cations at the silica/CH3CN interface may be suitably characterized using a site-binding model.24That is, the adsorption and desorption of cations take place independently at different SiO-sites. The probability of each SiO-site being occupied is directly proportional to the concentra-tion of caconcentra-tions in the soluconcentra-tion. TMAC with a smaller size suffers from less steric hindrance, while attacking the SiO-group. Thus, the increased concentration may effectively suppress the DMPI adsorption.
The enhancement of absorbance observed in this work might be caused by the effect of the electrical double layer. Note that the evanescent wave can penetrate through the solution layer for about hundreds of nanometers depth. The dissociated Cl-and I -anions may be adsorbed by the interfacial cations of DMPI and TMAC. The increase of electrolytes in the early stage helps reduce the charge-charge repulsion between the DMP+ cations. The
Figure 6. Relative absorbance of DP as a function of TEA concentration. The relative absorbance is defined as a ratio of the DP absorbance with and without TEA addition. The solid curve fitting is based on a competitive Langmuir eq 10 in the text.
Figure 7. Relative absorbance of DMPI as a function of TEA concentration. The relative absorbance is defined as a ratio of the DMPI absorbance with and without TEA addition.
Figure 8. Absorbance of DMPI as a function of the TMAC concentration. The DMPI concentration is fixed at 5×10⁻⁴M.
Downloaded by NATIONAL TAIWAN UNIV on September 8, 2009 | http://pubs.acs.org
electric potential of a negatively charged surface may attract the DMP+cations in the solution toward the surface. In this manner, the DMP+concentration within the field of the evanescent wave becomes dense such that its absorbance measurement in the early stage may be enhanced. The accumulation of DMP+ into the effective field may also be reflected in a plot similar to Figure 2b, showing that the ring-down time keeps slowly decreasing when TMAC is added. It may otherwise reach a constant rapidly without TMAC involved. When the TMAC concentration increases, its adsorption rate becomes competitive to cause the adsorption decay of the DMP+cation.
Zare and co-workers have observed similar phenomena, while investigating the adsorption of CV+ to a charged silica/water interface by using evanescent wave-CRDS.16The CV+interfacial absorbance exhibits a pronounced maximum as pH increases to about 7-8 at high ionic strength with metal chlorides added. When Ca2+concentration is increased to compete for the SiO -sites, the CV+interfacial absorption is expected to be suppressed, but contrarily, the absorbance is enhanced in the presence of a higher Ca2+concentration. The phenomena may not be simply characterized with a competitive Langmuir adsorption model. It should take into account the adsorbate contribution in the bilayer, which is formed as the ionic strength increases.
D. Absorption Correction for Solution Layer. Given the incidence angle at 68.3°, the radiation wavelength of 542 nm, and the refractive indexes of BK7 (n1) 1.52) and CH3CN (n2) 1.342), the penetration depth, dp, of the evanescent wave may be estimated to be 196 nm, according to the following equation,30
where n21) n2/n1. The thickness of DP or DMPI on the substrate is∼2 nm; thus, the evanescent wave may be absorbed by both adsorbates on the surface and in the solution layer. The molar absorptivity of DP and DMPI are determined to be 1.0× 10⁴and 1.3× 10⁴M-1cm-1, respectively, at 542 nm from the correspond-ing UV/visible absorption spectra. Given the samples at 1.0× 10⁻⁴ M as an example, the corresponding absorbance in the solution alone may be evaluated to be 1.3× 10⁻⁵and 1.8× 10⁻⁵. The result is about a factor of 101-102 smaller than the total absorbance measured. As shown in Figures 3 and 4, subtraction of the bulk contribution leads to only∼6 and ∼0.6% change of the original K and ∆G, respectively. With the SHG technique, the
concentration of adsorbate adsorbed on the surface is similarly estimated to be ∼104 larger than that in the solution with a concentration less than 1.0× 10⁻⁴M.27
The SHG technique has distinct design and principles from the evanescent wave-CRDS. The former method makes use of the symmetry change of molecules at the interface and generates a doubled frequency for detection. The intensity of SHG depends on the molecular surface density and the squared term of nonlinear susceptibility. The silica and bulk solution both belong to centrosymmetric media, yielding a zero nonlinear susceptibility. Thus, SHG is sensitive to the interfacial interaction of molecules and substrate. Nevertheless, molecules adsorbed on the surface should be aligned orderly for effective application of the SHG technique. In contrast, the evanescent wave-CRDS method pro-vides an alternatively sensitive tool to the interface interaction, but free from the above restriction. It can also be applied for molecular orientation measurement.11,13,14
CONCLUSION
An evanescent wave-CRDS technique is applied to detect the silica/CH3CN interfacial interaction by the DP molecule and DMP+ cation. The monolayer adsorption behavior may be characterized using the Langmuir isotherm model, giving rise to the saturated surface density and the related thermodynamic properties. The absorption contribution of the bulk solution is negligible. The DP, adsorbed by forming the hydrogen bonds, shows a smaller equilibrium constant and free energy of adsorp-tion than the DPMI bound by the electrostatic attracadsorp-tion. The interfacial forces may be identified by addition of a TEA adsorbate. The thermodynamic properties probed by the evanescent wave-CRDS are generally consistent with those by the SHG method. Nevertheless, different behavior for the TMAC dependence is found in the DMP+solution. As the co-ions increase, the increased absorbance of DMP+in the bilayer may account for the difference. Such an electrical bilayer effect may not be ignored for fully understanding the electrostatic interaction not only in the aqueous solution but also in the organic solvent.
ACKNOWLEDGMENT
This work is supported by National Science Council of Republic of China under contract NSC93-2113-M-002-026.
Received for review November 21, 2005. Accepted March 16, 2006. AC0520588 dP) λ 2πn1(sin 2 θi- n21 2 )1/2 (11)
Downloaded by NATIONAL TAIWAN UNIV on September 8, 2009 | http://pubs.acs.org