©2005 National Kaohsiung University, ISSN 1813-3851 Accepted for Publication: Sep. 5, 2005
Effect of non-plastic fines on liquefaction resistance based on the
experimental results
D. H. Hsiao
Department of Civil Engineering, National Kaohsiung University of Applied Sciences Corresponding author: [email protected]
Abstract
The objective of the paper is to study how fines content influence the cyclic resistance or liquefaction resistance of the silty sands. In addition, the difference between in the laboratory and in-site situation will also be investigated. For the comprehensive study, two types of sands such as local Kaohsiung river sands and Ottawa sands were performed. The testing results reveal that both of static and cyclic strength of the sandy samples decrease with increasing fines content under same relative density. In order to simulate the standard penetration test N1 value, another set of specimens with similar internal friction angle or stress-strain for static triaxial tests were used to conduct the cyclic triaxial tests. If the internal friction angles of the samples were specified to be similar, the test results showed that their cyclic strengths didn’t decrease with increasing fines content. When transforming the laboratory results into the correlation of liquefaction resistance CSR and SPT N1, we can find obviously the increase of liquefaction resistance with increasing fines
content no matter whether Kaohsiung sands or Ottawa sands. Some arrow paths in the corresponding figures were used to describe the variations of the liquefaction resistance of the specimens accompanied with fines content. In the meantime, the paths can tell how fines content affect the liquefaction resistances based on the specimens under similar peak internal friction angles or same relative densities.
Keywords: Liquefaction, fines content, cyclic resistance, liquefaction resistance
1. Introduction
Several studies in the past indicated the fines content could give a significant influence on the liquefaction potential of silty sand deposits. It is necessarily noted that many geotechnical properties of liquefied areas or non-liquefied areas were collected to provide the engineering experience for other sites. Usually they were used to build up data lots; which can be applicable in the field. Among these useful manners, the empirical chart describing the correlation between cyclic stress ratio CSR causing liquefaction and penetration index, including SPT, CPT or shear velocity was effective to evaluate the liquefaction potential of silt-sandy deposits. In fact the observed data during or post earthquake were also given a conclusion that the liquefaction resistance of silty sands is significantly dependent of fines content. However it is still not clear that the increase of liquefaction resistance or decrease of penetration resistance with increasing fines content (Youd et
al. (2001)). How the fines content affect dynamic characteristics of silty sands has been concerned in the paper. Since it is difficult to study in the field, a series of experimental works were undertaken to seek the actual solution. At the beginning, the static CD tests indicate fines content decrease actually the strength of the soil specimens. Subsequently cyclic triaxial tests were conducted; both parameters of relative density and internal friction angle were adopted in the study.
2. Effect of fines on soil strength in the previous studies
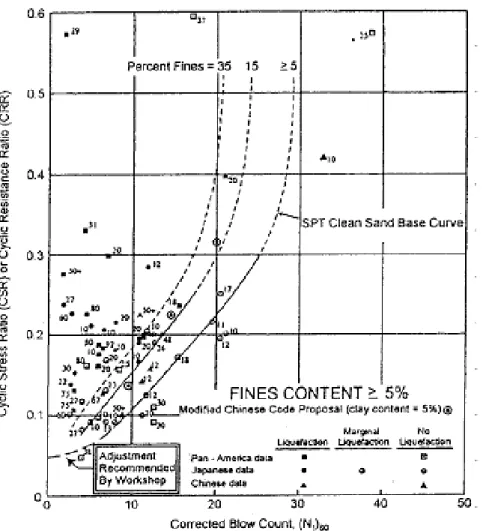
The topic of studying liquefaction has been very attractive for its complexity and uncertainty since 1970’s. Therefore many literatures in the past had focused on the dynamic behavior of clean sands as well as sands with fines content. By collecting valuable data post earthquakes in the field, Seed et al. (1985) also presented an empirical chart as the figure 1 to analyze liquefaction potential. It may evaluate the liquefaction resistance of the sandy soils by using standard penetration test N1,60 during earthquakes. In addition, we can find from figure 1 that the liquefaction resistance will increase with increasing fines content of soils. In the meantime, Tokimatsu and Yoshimi (1983) revealed the similar viewpoints by using mean particle size D50 in stead of fines content. Recently Youd et al. (2001) indicated that it is not clear now that fines increase whether liquefaction resistance increases or penetration resistance decreases. Since studying liquefaction in the field is not easy, the experimental method is appropriate for easy preparation of the specimen as well as experimental performance.
In the past, many researches paid attentions to the liquefaction resistance of silty sands with fines. Xenaki and Athanaspoulos (2003) pointed out that for fines content increases from 0 to 44% the liquefaction resistance of mixtures with constant global void ratio decreases compared to that of the clean sand, whereas this trend is reversed for values of fines content greater than 44%. Polito and Martin (2001) presented that the cyclic resistance of the Monterey sand and silt mixtures decreases as the silt content increases until a minimum cyclic silt content of 0.11 is reached at a silt content of 35%, but the silt content continues to increase above 35%, the cyclic resistance increases. Chien et al. (2002) indicated the liquefaction strength of reclaimed soil in the laboratory decreases as the fines content increases under constant relative density. In order to investigate the effect of fines content on the liquefaction resistance, Bouckovalas et al. (2003) employed a statistical analysis of a large data set of published monotonic triaxial tests. The data show clearly that a fines content, less than 30% by weight, may prove beneficial at relatively small effective stress (p0<50-70kPa), such as the in situ stress prevailing in most liquefaction case studies, and detrimental at larger confining stress, i.e. the stress usually considered in laboratory tests. Thevanayagam (1997, 1998) indicated that a silty sand is considered as a delicate composite matrix containing a sand-grain-matrix and a silt-matrix. At a fine content greater than about 30% for silty sand, silt is expected to behave as a silt sand at an interfine void ratio. After a comprehensive experimental program of performing 150 stress-controlled cyclic triaxial tests, Amini and Qi (2000) showed that the increase in silt content (percent passing the No. 200 sieve) caused the liquefaction resistance of silty sands to increase for both uniform and layered soil conditions. In order to study the feasibility and applicability of various methods evaluating liquefaction potential, Ni and Fang (2002) took advantages of results for Taiwan Chi-Chi earthquake in 1999. They compared two
useful feasible methods, and it may discover T&Y method is better than Seed et al. method for fines more than 35%.
The ratio of (N1)60/Dr2 which was presented by Skempton (1986) should be reduced for silty
sands and should be increased for the course sands. These data were summarized from the results of laboratory and field respectively. Apparently the N value in standard penetration tests will be lower due to presence of fines content. Ishihara et al. (1996) calculated the residual strength determined by back-calculation at three typical cross sections in the 1990 Luzon, and indicated general coincidence with those estimated previously for other data sets. Seed and Harder (1990) had the prior observations, appeasable to be very relevant for several case histories of post-liquefaction failures where very low back-calculated undrained shear strength have been observed. They agreed with the expectation that undrained shear strength decreases with containing fines content of the soils of target cases. After performing a series of triaxial consolidate-drained tests, Thevanayagam (1998) indicated the decrease of internal friction angle when the fines content increase. For the relation between internal friction angle and penetration resistance, Hatanaka and Uchida (1996) showed up their formulas irrespective of fines content. Cubrinovski and Ishihara (1999,2000) completed a series of papers discussing the correlation between (N1)/Dr2 and the difference of
maximum void ration and minimum void ratio. In order to study the fines on emax and emin, a plot
about the values of (emax-emin) as a function of the fines content was drawn for each of the composite
soils for the gape-graded mixtures consisting of the Cambria sand and Nevada fines (2002). It is also noted that the variation of with the fines content closely resembles that of the spherical particles of their developed model. They used (emax-emin) as a measure indicative of the grain size
and grain size composition (1999, 2000). It was found that (N1)/Dr2 is highly dependent on the value of (emax-emin) and that this ratio gradually decrease with increasing void ratio range from a
value of about 100 for gravels to a value of about 10 for silty sands.
Baziar and Dobry (1995) indicate that the soil behaves contractively in shear, and both its density and steady-state strength increase rapidly with consolidation pressure. These trends are verified for field conditions by comparison with available case histories of earthquake-induced flow failure and large lateral deformation of embankments, slopes, and mildly sloping ground. Naeini and Baziar (2004) conducted a series of undrained monotonic and cyclic triaxial compression tests with variation in fines from 0% to 100%, and used sand and silt mixed throughout the specimens and specimens with alternating sand-silt layers. It is found that, as the silt content in both series of samples increases up to 35%, the steady state line moves down ward and normalized shear strength is decreased. However, in layered samples with same amount of silt as the mixed sample, the downward movement of steady-state line is great. Lade and Yamamuro (1997, 1998) showed that the fines appear to create a particle structure in the soil which is highly compressible, enhancing the potential for liquefaction, even though the density of the soil increases. Increasing the fines content of a clean sand can have the effect of increasing the potential for liquefaction up to a certain maximum level at which the behavior of the fines dominate the undrained soil behavior. At this point the potential for liquefaction tends to become constant with respect to relative density. It was found that complete static liquefaction could occur at a relative density greater than 60% at high fines contents. Li and Ming (2000) presented that flow liquefaction and cyclic mobility are two different phenomena, which are encountered during strong earthquake. Flow liquefaction is associated with the contractive behavior of loose granular materials and cyclic mobility is
associated with the dilative response of both loose and dense materials at low confining stresses. These two types of response pertain to the same material and therefore should be modeled in a consistent manner.
Ueng et al. (2004) described the effect of fines is an important factor in the evaluation of the liquefaction potential of a sandy soil. In the recent earthquake, e.g. 1999 Kocaeli earthquake and Chi-Chi earthquake, liquefaction occurred in the soils with very high FC. Huang et al. (2004) also indicated that Chi-Chi earthquake, 1999 in Taiwan induced extensive soil liquefaction in Central Western Taiwan. When performing back analysis of sand liquefaction potential in this region, FC could lead a significant influence, and it would be highly desirable to establish an understanding of undrained behavior of the silty sands with FC in the region.
3. Experimental program
According to the earlier discussion, most experimental results show that cyclic resistances of silty samples are decreasing with increasing fines content for same relative density. While the samples under same relative density didn’t represent that their static shear strength resistances are similar. In the field, (N1)60 may be usually considered to be the static shear strength. In reality it is
difficult in the laboratory to simulate the conditions with same penetration resistance. Mitchell (1993) depicted also the components of the friction angle within the soils and its complication. After a lot of observations in the field, Terzaghi and Peck (1967) and Bowles (1988) described the related characteristics of standard penetration test N value, internal friction angle φ and soil density for sands. Thus we can obtain the relationship between N value and φ angle. In the study we will simulate the penetration condition in site with the internal friction angle. Consequently the results of triaxial CD compression tests were used to simulate and explore variation of the internal friction angles of the soils.
In order to investigate the effects of non-plastic silts, a series of experimental programs were undertaken in the laboratory. The soil samples with same density for cyclic triaxial tests will first be conducted to realize how the soil fines influence their cyclic resistances. In addition influencing the dynamic behavior, the fines content can have effect on the static characteristic of the soils. Hence the static CD triaxial tests were also performed to prove whether static resistance decreases as fines content increase. Since relative density didn’t represent the penetration resistance in the field. By making use of results of static triaxial compression tests, the cyclic triaxial tests with similar internal friction angle will be sequentially completed. As stated before, some soils display same results as in-site situation, but other soils didn’t. In order to achieve a more extent study, two types of soils were prepared and tested in the study.
4. Testing soils and experimental procedure
At the beginning, the soils tested were obtained by boring method from selected place near the riverside of Cheng-Zern River in Kaohsiung city, Taiwan. The collected fines, which were prepared by passing Kaohsiung river sands through No. 200 sieves, were added into the clean sands by the
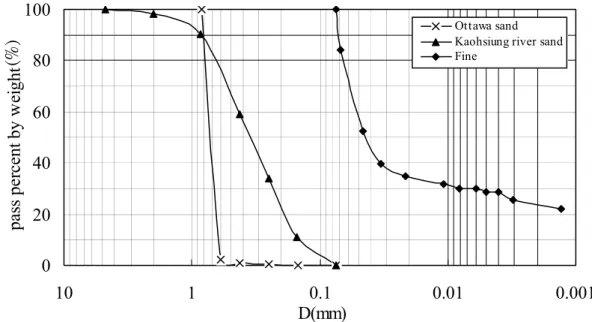
required mixture ratio. In addition Ottawa sands of ASTM-20-30 C778 were adopted for the extensive study. In fact the soil obtained in site contains a few fines particles, which are near 1.3% by weight. Fig. 2 indicates three grain distribution curves including Kaohsiung sands, Ottawa sands and testing fines, which were obtained from Kaohsiung sands under ASTM D452-85 and ASTM D422-85. Since the distribution condition of soil particles for Kaohsiung sands is better than that of Ottawa sands, their dry densities of the specimens will be higher. All the properties in Table 1 were determined carefully according to the ASTM codes. It is noted that both of emax and emin for
Ottawa sands were decided by the method suggested from Amini and Qi (2000). Other physical properties about these soils and soil mixtures were also shown in Table 1. Due to existence of fines particles, the maximum dry densities for the mixture soils increase with increasing fines. On the contrary the variation of minimum dry densities with increasing fines content is less. In Table, it is also found that (emax-emin) will increase with increasing fines content for these two types of sands.
The Ottawa sands depict apparently the variation about (emax-emin) from 0.26 to o.44 when fines
content contained from 0% to 20%.
For the purpose of performing a series of cyclic triaxial tests, equipment of which designed by C. K. Chan was used. Before creating the soil specimen, the amounts of soils have to be calculated and prepared with water content equaling to 8%. Then the moist soil were poured carefully into the sample mould with five layers, the soil by proper tamp may reach gradually to expected height. To reduce saturation time, the gas of CO2 was first flushed into the soil sample from the bottom. Until
the gas bubbles through the entire sample are found, the de-aired water was subsequently permeated slowly into soil sample. The preparation time needed is about 5-6 hours. After the samples were prepared, they were moved carefully to the proper position of the apparatus. In the study all the samples were applied and consolidated under the proper confining pressure (σ3c=100kPa for cyclic
triaxial test). The pore water pressure “B” of 0.96 or more must be reached, the soil sample will be considered as fully saturation.
The procedure of static triaxial test is similar as that of cyclic triaxial test, and the testing apparatus produced by ELE Inc. was used. After static triaxial tests were carried out, the relation curves between stress and strain can be and calculated and plotted. The soil friction angles of φ(peak)
and φ(residual) may then be determined by Mohr-Coulomb theory.
It is noted that all the experimental works were carefully employed by Huang (2003) and Wu (2004) at the Soil Dynamic Laboratory of Department of Civil, KUAS.
5. Test results and discussions
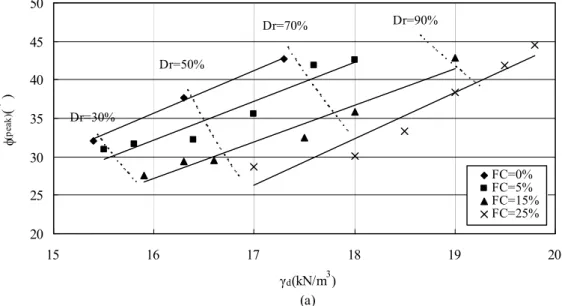
Fig. 3 illustrated the relationship between φ(peak) with respective to soil dry density after
performing the static triaxial tests. Apparently when fines content increase, the curves will move right-side direction. That is to say, the specimen with higher fines has to increase its density, thus it can obtain the similar results as the clean sands. In figures, the dotted lines show up the corresponding relative density for each curve. Since the presence of fine particles apparently separate the sandy particles, increasing fines content will weaken the soil shear strength. Hence high FC specimens must have more sand particles to fill the pores within the solid particles; they can have the similar internal friction angle. Accordingly we may understand that existence of fines will
decrease the static strength of soils. On the whole, the trends in two figures are similar with each other. While φ(peak) of Ottawa sands are lower than those of Kaohsiung sands because their
gradations tend to uniform distribution. In addition, fines content are above 20%, the specimens of Ottawa sands will be difficult to create. Consequently we used 20% in steady of 25% for Kaohsiung sands regarding the maximum mixture ratio. It should be noted from Fig. 3(a) that the difference of φ(peak) between FC=0% and FC=25% will reach 10o-12o for Dr=50% and Dr=70%. Yet the results
for Ottawa sands were lower because of soil gradation.
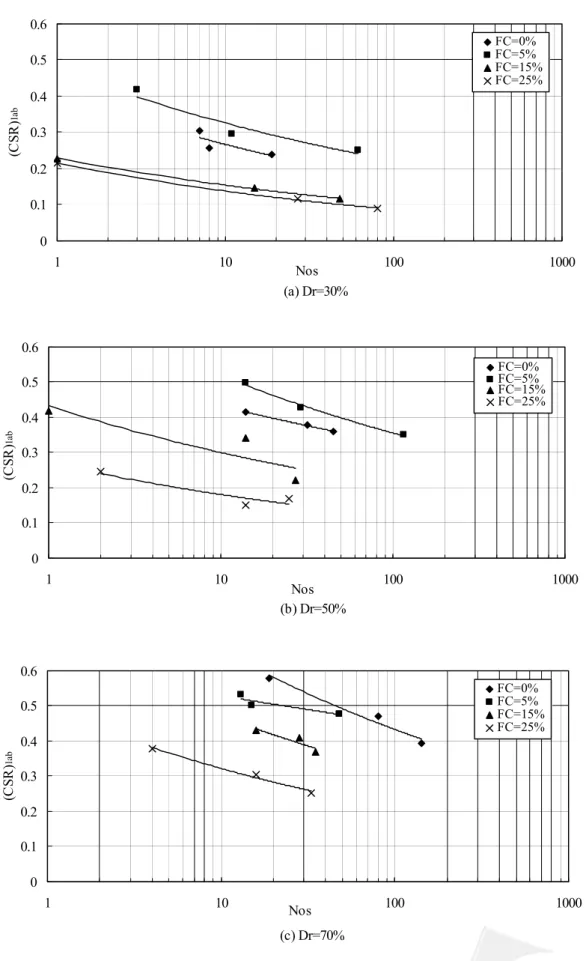
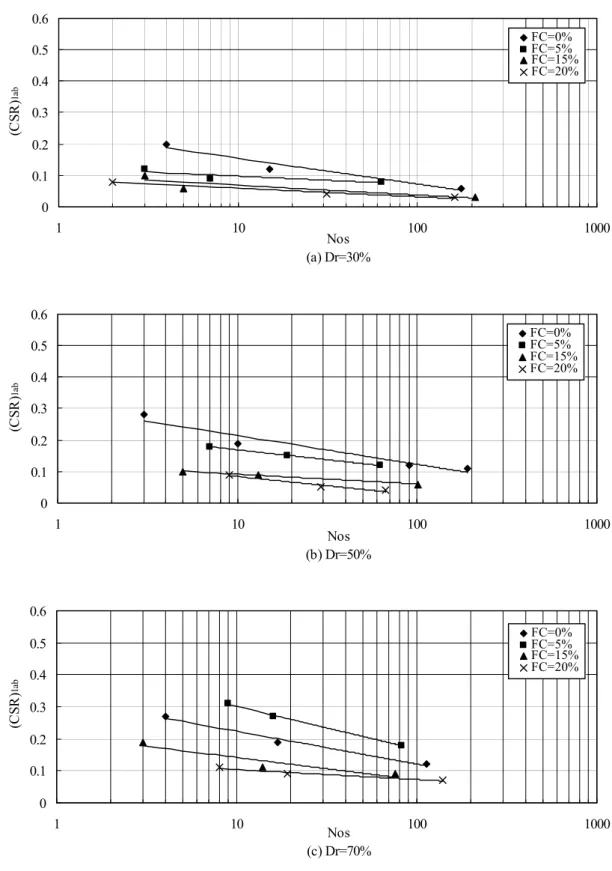
Fig. 4 indicates the results of cyclic triaxial tests under various relative densities for Kaohsiung sands. The value of CSR in y-axis denotes cyclic stress ratio, which is the ratio of maximum shear stress triggering initial liquefaction and effective confining stress. The validation of cyclic numbers in x-axis is limited in the range of 2-200. In order to study the soil from loose to dense situation, the relative density is chosen as 30%, 50% and 70% respectively. Owing to presence of fines particles, all the results are seems to decrease with increasing fines content. Likewise Ottawa sands have the similar results as Kaohsiung sands in Fig. 5. However the experimental results for Ottawa sands have the lower cyclic resistance. In Fig. 5, the cyclic stress ratio causing liquefaction will be very low when fine content reaches 20%. In reality it was found in the laboratory that creating the specimen with higher fines for Ottawa sands is very difficult. Many authors such as Xenaki and Athanasopoulos (2003), Polito and Martin (2001), Chien et al. (2002) and Ni and Han (2002) agreed also with the findings in the present study by using experimental results or field outcome post earthquake. In addition, Cubrinovski and Ishihara (2002) found the values of (emax-emin) as a
function of the fines content, and it can decrease the results of (N1)/Dr2. Thereafter both of cyclic strength and static strength for Ottawa sands will be less due to greater variation of (emax-emin).
Most researchers in the past have used the relative density or soil dry density to study influence of the fines content on the liquefaction resistance. Yet relative density does not fully simulate penetration resistance in the field, similar internal friction angle of soil specimen will be suggested for the following study. For the instance of Ottawa sands with internal friction angle equaling to 32o in Fig. 5, the dry density of the specimen must be equal to 15.7, 16.0, 17.6 and 18.0 kN/m3 for FC=0%, 5%, 15% and 20% respectively.
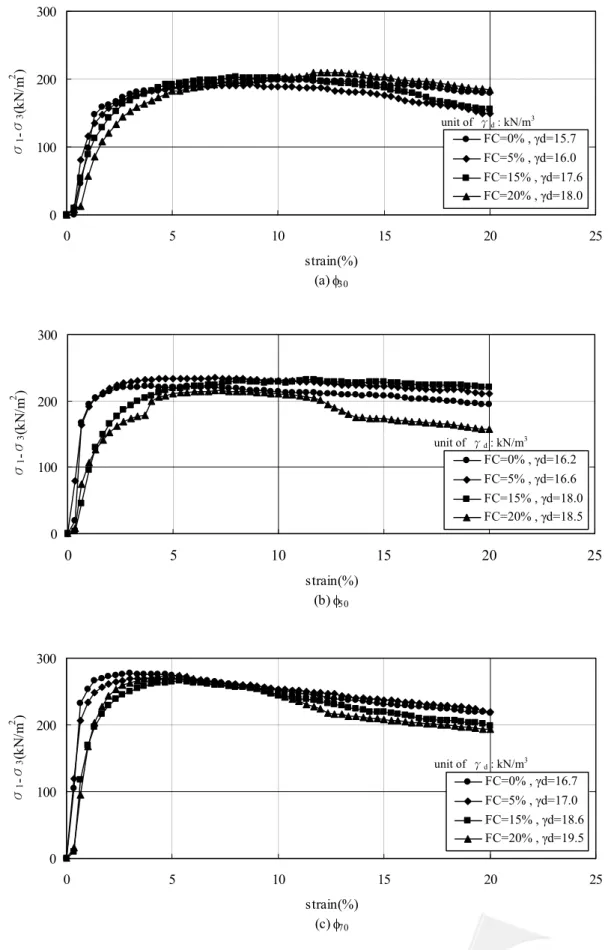
Even though Fig. 3 may understand the dry density needed for different fines content under certain relative density. It is necessary to investigate the results for triaxial CD tests. Figs. 6 and 7 indicate the stress-strain curves for the testing soils. In Fig. 6(a), dry densities of Kaohsiung sands having 15.4, 15.8, 17.5 and 18.5 kN/m3 for FC=0%, 5%, 15% and 25% respectively will show the similar stress-strain relationship. It can also be verified due to same internal friction angle from Fig. 3(a). In Fig. 7(a), we can observe the similar stress-strain relationship for the specimens, dry densities of which equal to 15.7, 16.0, 17.6 and 18.0 kN/m3 for FC=0%, 5%, 15% and 20% respectively. If φ70 is considered, peak stress equaling to 500-600 kPa for Kaohsiung sands will be
greater than that for Ottawa sands.
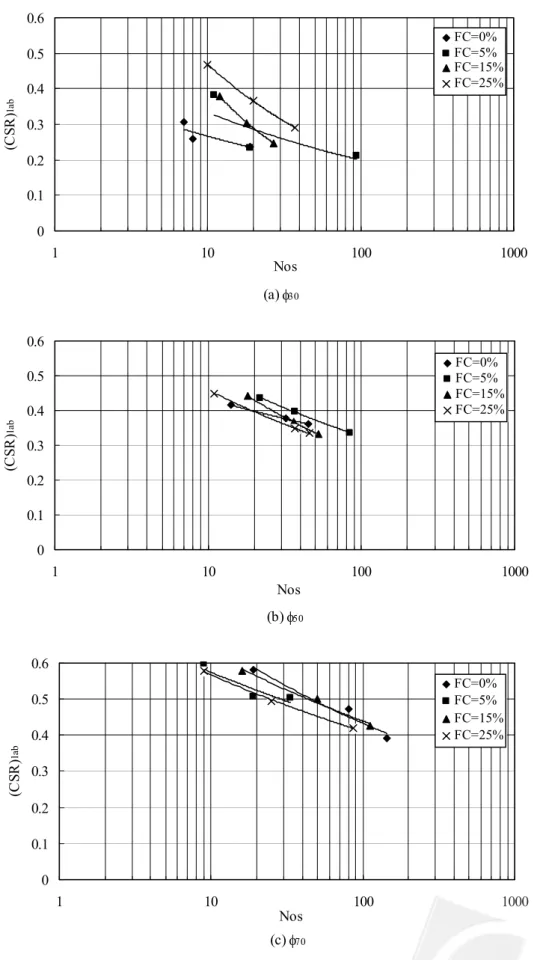
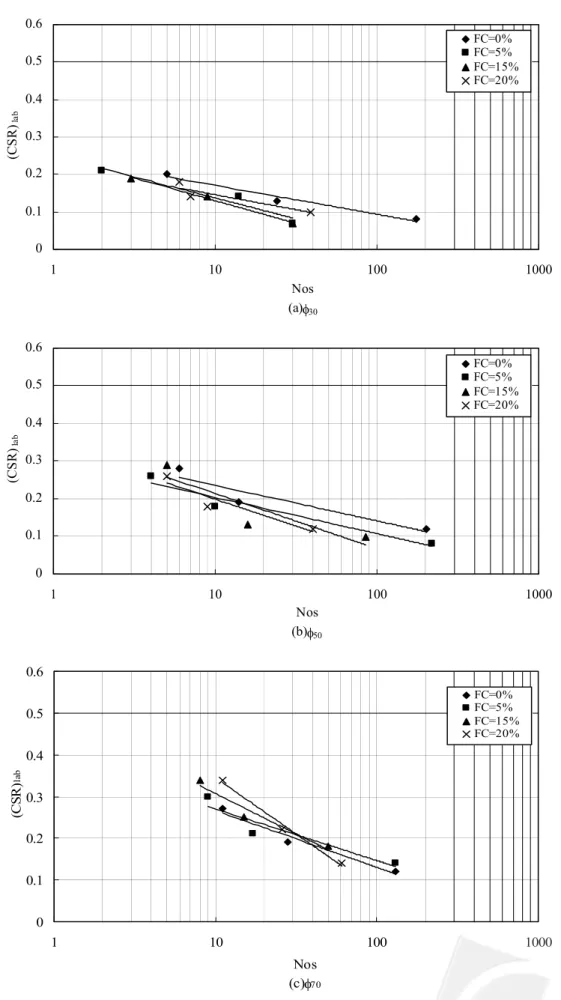
Figs. 8 and 9 showed the results of cyclic triaxial tests of the specimens under similar internal friction angle for Kaohsiung sands and Ottawa sands. φ30, φ50, and φ70 denote internal friction angle
or stress-strain of the silty sandy specimens are similar as those of clean sands under Dr=30%, 50% and 70% respectively. In Figure 8(a), the cyclic resistance of the specimen with FC=25% is more than that of the specimen with FC=0% for Kaohsiung sands. Even though FC=25% in other figures don’t reach a maximum value, increasing fines content will not reflect to decrease the cyclic
resistance. In Fig. 9 for Ottawa sands, the cyclic resistance of FC=0% can be a little larger than the results of other specimens for φ30 and φ50. Hence we consider similar internal friction angle again,
all the experimental results are approximately closer for various FC.
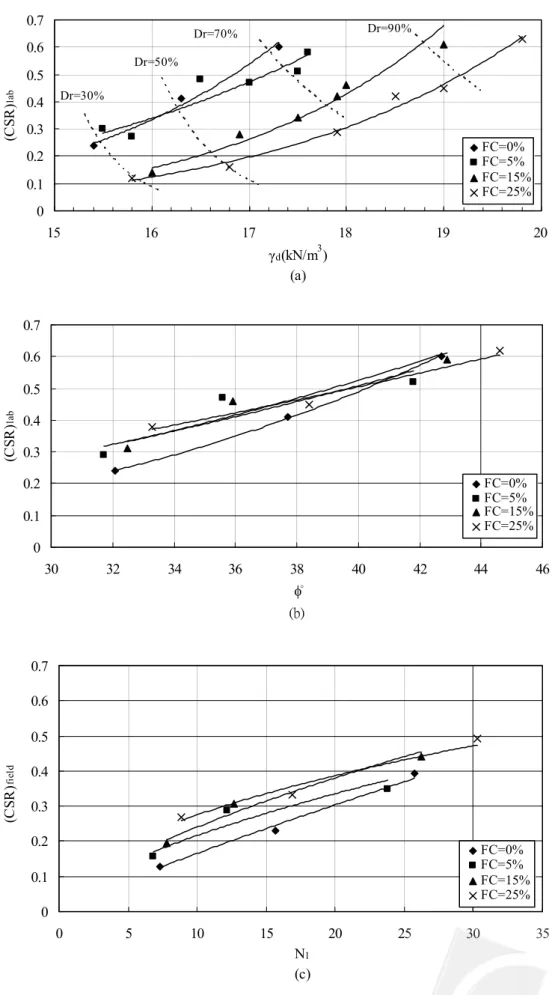
Fig. 10 illustrates the procedure for evaluating in-site liquefaction resistance from cyclic resistance obtained from the laboratory. Seed et al. (1985) suggested that the equivalent number of cycles at 0.65τmax causing initial liquefaction is about 15 for Magnitude 7-1/2 earthquake.
According to above method, all the testing data in Figs. 4 and 8 were collected and analyzed in Fig. 10(a). It can depict all the experimental results with respective of cyclic stress ratio and soil dry density, and the dotted lines represented the corresponding relative density for each curve. Though the results of FC=0% and 5% are approximately closer each other, increasing fines content give a apparent trend of decreasing cyclic resistance when relative density is specified. In comparison with the static triaxial tests shown as Fig. 3(a), the dynamic strength seems to approach nearly the same trend. In addition, by means of correlation between and dry density shown as Fig. 3(a), the x-axis in Fig. 10(a) can be transformed into φ(peak) from γd shown as Fig. 10(b). Cyclic stress ratio of FC=0%
will be larger than that of high fines content for low internal friction angle.
In order to accomplish the data transformation from testing results in the laboratory to field application, the parameters in x-axis and y-axis have to be converted by using the proper relationship. Recently Carraro et al. (2003) and Kramer (1996) reviewed the relationship between cyclic stress ratio causing liquefaction potential in the field and the alternative in the laboratory. The correction coefficient Cr in Eq. (1) may perhaps be adopted for the transformation. In addition, Hatanaka and Uchida (1996) described the internal friction angle is function of penetration ratio as Eq. (2). After these procedure, the relationship between (CSR)field and N1 in Fig. 10(c) indicated
dynamic strength increases with more fines content.
(CSR)field = Cr (CSR)lab (1)
φ = (20N1)0.5+20ο (2)
Fig. 10(c) indicated the relationship between (CSR)field and corrected penetration value N1 in
terms of Eqs.(1) and (2). Thevanayagam (1998) indicated that a silty sand is considered as a delicate composite matrix containing a sand-grain-matrix and a silt-matrix, meantime at a fine content lower than about 30%, silt of a silty sand is expected to behave as a void with inter-granular silt sands. In spite of similar results, the trend of Fig. 11 displayed a little unclear due to low values.
Noted that the results in the Fig. 10(a) are significantly different from findings of the Fig. 10(c). It seems possible to decrease the cyclic resistance in the laboratory and increase liquefaction in the field when the fines content are increased. To explain above phenomena, Fig. 12 illustrates two paths from FC=0% to 25% for each illustration with same relative density and similar internal friction angle for Kaohsiung sands. Results showed that cyclic strength of FC=25% is greater than that of FC=0% in Fig. 12(a). Based on same internal friction angle, path 1 moving upwards indicates the increase of penetration as well as cyclic stress ratio. On the contrary, path 2 having same relative density will move left downwards because of the decrease of static penetration resistance and cyclic stress ratio. Likewise Ottawa sands, the testing results in Fig. 13 showed the similar trends. To select the curves of FC=0% and FC=25% for Fig. 12 and Fig. 13, it may prevent
confusing induced from many data in a figure.
Fig. 14 may demonstrate the liquefaction resistance for all the specimens with various fines content, and they can also display the developing trend of the results. On the whole, the liquefaction resistances increase with increasing FC by means of the indicated direction of the arrow.
To describe briefly the effect of fines again, we may use the results of Fig. 15 to demonstrate the variance in the laboratory and in-site situation. They are the experimental results of all the cyclic triaxial tests for FC=0% and FC=25% of Kaohsiung sands respectively. Fig. 15(a) depicts that the findings in the laboratory is similar as the results in the literatures, and Fig. 15(b) has the opposite outcome. In addition, there are three paths are studied in these figures. In two figures, starting point indicates the specimen with FC=0% and Dr=50%; the ending point represents the specimen with FC=25%. Since path 1 having the similar stress-strain moves in right side and upward direction in Fig. 15(a), it is clearly understood that static strength and cyclic resistance increase with increasing fines content. The path 3 representing same relative density still moves from left side to right-down direction in Fig. 15 (a). However the testing data were transformed into the-site situation, Fig. 15(b) indicated the liquefaction resistance increases with fines content.
6. Conclusions
The present paper is primarily aimed to study the difference of fines content on the liquefaction resistance whether in the laboratory or in the field. Some conclusions are drawn in the followings.
1. The testing results indicate that the cyclic resistances of Kaohsiung sands and Ottawa sands with FC in the range between 0% and 25% or 20% decrease with increasing fines content when considering same relative density. While experimental parameter is the internal friction angle in steady of relative density, fines content don’t reflect the influence on the cyclic resistance.
2. When transforming the laboratory results into the correlation of liquefaction resistance CSR and SPT N1, we can find obviously the increase of liquefaction resistance with increasing fines content no matter whether Kaohsiung sands or Ottawa sands.
3. In the meantime, the arrow paths in Fig. 15 can tell us how fines content affect the liquefaction resistance based on the specimens under similar peak internal friction angles or same relative densities. They can make it clear that the uncertainty between the experiment and site situation exists in the past.
Acknowledgements
The financial supports provided from Ministry of Education and National Science Council, Taiwan, R.O.C. are sincerely appreciated under the contract numbers of DOE-074 and NSC-92-2211-E-151-004 respectively. The experimental assistances of Mr. Wu, S. H. and Hwang, C. H. are also appreciated.
References
[1] Amini, F. and G. Z. Qi “Liquefaction Testing of Stratified Silty Sands,” Journal of Geotechnical and Geoenvironmental Engineering, ASCE, Vol. 126, 2000, pp. 208-217.
[2] Baziar, M. H. and R. Dobry, “Residual Strength and Large-Deformation Potential of Loose Silty Sands,” Journal of Geotechnical Engineering, ASCE, Vol. 121, 1995, pp. 896-906.
[3] Bouckovalas G. D., K. I. Andrianopoulos and A. G. Papadimitriou,” A Critical State Interpretation for the Cyclic Liquefaction Resistance of Silty Sands,” Soil Dynamic and Earthquake Engineering, Vol. 23, 2003, pp. 115-125.
[4] Bowles, J. E., Foundation Analysis and Design, 4th Edition, McGraw-Hill Inc, 1988.
[5] Carraro, J. A. H., P. Bandini, and R. Salgado, “ Liquefaction Resistance of Clean and Nonplastic Silty Sands Based on Cone Penetration Resistance,” Journal of Geotechnical and Geoenvironmental Engineering, ASCE, Vol. 129, 2005, pp. 965-976.
[6] Chien, L. K., C. H. Chang and Y. N. Oh, “Effects of Fines Content on Liquefaction Strength and Dynamic Settlement of Reclaimed Soil,” Canadian Geotech. J., Vol. 39, 2002, pp. 254-265.
[7] Cubrinovski M. and K. Ishihara, “Empirical Correlation between SPT N-Value and Relative Density for Sandy Soils,” Soils and Foundations JSSMFE, Vol. 39, 1999, pp. 61-71.
[8] Cubrinovski M. and K. Ishihara, “Flow Potential of Sandy Soils with Different Grain Compositions,” Soils and Foundations, JSSMFE, Vol. 40, 2000, pp. 103-119.
[9] Cubrinovski M. and K. Ishihara, “Maximum and Minimum Void Ratio Characteristics of Sands,” Soils and Foundations, JSSMFE, Vol. 42, 2002, pp. 65-78.
[10] Hatanaka M. and A. Uchida, “Empirical Correlation between Penetration Resistance and Internal Friction Angle of Sandy Soils,” Soils and Foundations, JSSMFE, Vol. 36, 1996, pp. 1-9.
[11] Hsiao, D. H., S. E. Wu, C. C. Lee, E. V. Cho and W. F. Lin, “ A Study on Fines Content Affect the Static and Dynamic Resistances Based on Inter-Granular Coid Ratio,” Journal of Engineering Technology and Education, Vol. 1, 2004, pp.15-28.
[12] Huang, Y. T., A. B. Huang, Y. C. Kuo and M. D. Tsai,, “A Laboratory Study on the Undrained Strength of a Silty Sands from Central Western Taiwan,” Soil Dynamics and Earthquake Engineering, Vol. 24, 2004, pp. 733-743.
[13] Huang, C. H., Influence of Fine Content and Anisotropic Consolidated on Liquefaction of Riverside Sands of Chen-Zern River in Kaohsiung City, Master Thesis, Institute of Civil Engineering and Disaster Prevention Technology, National Kaohsiung University of Applied Sciences, 2003.
[14] Ishihara, K., A. A. Acacio and I. Towhata, “Liquefaction-Induced Ground Damage in Dagupan in the July 16, 1990 Luzon Earthquake,” Soils and Foundations, JSSMFE, Vol. 36, 1996, pp. 39-50.
[15] Kramer, S. L., Geotechnical Earthquake Engineering. Prentice-Hall, Inc., 1996.
Sands,” Canadian Geotech. J., Vol. 34, 1997, pp. 918-928.
[17] Li, X. S. and H. Y. Ming, “Unified Modeling of Flow Liquefaction and Cyclic Mobility,” Soil Dynamic and Earthquake Engineering, Vol. 19, 2000, pp. 363-369.
[18] Mitchell, J. K., Fundamentals of Soil Behavior, 2nd Edition, Wiley Inc., 1993.
[19] Naeini, S. A. and M. H. Baziar, “Effects of Fines on Steady-State Strength of Mixed and Layered Samples of a Sand,” Soil Dynamic and Earthquake Engineering, Vol. 24, 2004, pp. 181-187.
[20] Ni, S. H and E. S. Han, ”Fines Content Effects on Liquefaction Potential Evaluation for Sites Liquefied during Chi-Chi Earthquake, 1999,” Journal of Chinese Institute of Engineers, Vol. 25, 2002, pp. 533-542.
[21] Polito P. and R. Matrin, “Effects of Nonplastic Fines on the Liquefaction Resistance of Sands,” Journal of Geotechnical and Geoenvironmental Engineering, ASCE, Vol. 127, 2001, pp. 408-415.
[22] Seed H. B., K. Tokimatsu, L. F. Harder and R. M. Chung, “The Influence of SPT Procedures in Soil Liquefaction Resistance Evaluations,” Journal of Geotechnical Engineering, ASCE, Vol. 111, 1985, pp. 1425-1445.
[23] Seed R. B. and L. F. Jr. Harder, “SPT-Based Analysis of Cyclic Pore Pressure Generation and Undrained Residual Strength,” Proceedings Seed Memorial Symposium, Vol. 2, 1990, pp. 351-376.
[24] Skempton A. W., “Standard Penetration Test Procedures and the Effects in Sands of Overburden Pressure Relative Density Particle Size Aging and Overconsolidation,” Geotechnique, Vol. 36, 1986, pp. 425-447.
[25] Terzaghi, K. and R. B. Peck, Soil Mechanics in Engineering Practice, 2nd Edition. Wiley Inc.,
1967.
[26] Thevanayagam, S., “Effect of Fine and Confining Stress on Undrained Shear Strength of Silty Sands,” Journal of Geotechnical and Geoenvironmental Engineering, ASCE, Vol. 124, 1998, pp. 479-491.
[27] Thevanayagam, S., K. Ravishankar and S. Moham, “Effects of Fines on Monotonic Undrained Shear Strength of Sandy Soils,” Geotechnical Testing Journal, GTJODJ, Vol. 20, 1997, pp. 394-406.
[28] Tokimatsu, K. and Y. Yoshimi, “Empirical Correlationship of Soil Liquefaction Based on N SPT Value and Fines Content,” Soils and Foundations, JSSMFE, Vol. 23, 1983, pp. 56-74. [29] Ueng, T. S., C. W. Sun and C. W. Chen, “ Definition of Fines and Liquefaction Resistance of
Maoluo River Soil,” Soil Dynamics and Earthquake Engineering, Vol. 24, 2004, pp. 745-750. [30] Wu, S. H., Influence of Non-Plastic Fines on Liquefaction Resistance of CPT, Master Thesis,
Institute of Civil Engineering and Disaster Prevention Technology, National Kaohsiung University of Applied Sciences, 2004.
[31] Xenaki, V. C. and G. A. Athanasopoulos, “Liquefaction Resistance of Sand-Silt Mixtures: an Experimental Investigation of the Effect of Fines,” Soil Dynamic and Earthquake Engineering, Vol. 23, 2003, pp. 183-194.
[32] Yamamuro, J. A. and P. V. Lade, “Steady State Static Concepts and Static Liquefaction of Silty Sands,” Journal of Geotechnical and Geoenvironmental Engineering, ASCE, Vol. 124, 1998, pp. 868-877.
[33] Youd, T. L. et al., “Liquefaction Resistance of Soils: Summary Report from the 1996 NCEER and 1998 NCEER/NSF Workshops on Evaluation of Liquefaction Resistance of Soils,” Journal of Geotechnical and Geoenvironmental Engineering, ASCE, Vol. 127, 2001, pp. 817-833.
Fig. 1. Empirical chart providing cyclic stress ratio inducing liquefaction for certain corrected blow counts (N1)60
0 20 40 60 80 100 0.001 0.01 0.1 1 10 D(mm) pas s per cent by w ei ght (%
) Ottawa sandKaohsiung river sand
Fine
Fig. 2. Grain distribution curves for testing Kaohsiung sand, Ottawa sand and fines
Table 1. Physical properties of Kaohsiung sands and Ottawa sands for various fines content
Kaohsiung sand
D10(mm) 0.17 Cd 1 γdmax(kN/m3)(FC=0%) 1.91 γdmin(kN/m3)(FC=0%) 1.43 (FC=0%) edmax 0.900 (FC=0%)edmin 0.418 D30(mm) 0.27 Cu 2.5 γdmax(kN/m3)(FC=5%) 1.94 γdmin(kN/m3)(FC=5%) 1.43 (FC=5%) edmax 0.891 (FC=5%)edmin 0.398 D50(mm) 0.37 Gs 2.70 γdmax(kN/m3)(FC=15%) 1.98 γdmin(kN/m3)(FC=15%) 1.46 (FC=15%) edmax 0.849 (FC=15%)edmin 0.365 D60(mm) 0.43 USCS SP γdmax(kN/m3)
(FC=25%) 2.00 γdmin(kN/m3)(FC=25%) 1.43
edmax
(FC=25%) 0.894 (FC=25%)edmin 0.353 Ottawa sand
D10(mm) 0.62 Cd 1.02 γdmax(kN/m3)(FC=0%) 1.76 γdmin(kN/m3)(FC=0%) 1.50 (FC=0%) edmax 0.76 (FC=0%)edmin 0.50 D30(mm) 0.68 Cu 1.18 γdmax(kN/m3) (FC=5%) 1.85 γdmin(kN/m3) (FC=5%) 1.50 edmax (FC=5%) 0.79 (FC=5%)edmin 0.45 D50(mm) 0.71 Gs 2.64 γdmax(kN/m3)(FC=15%) 1.89 γdmin(kN/m3)(FC=15%) 1.47 (FC=15%) edmax 0.82 (FC=15%)edmin 0.42 D60(mm) 0.73 USCS SP γdmax(kN/m3)(FC=20%) 1.91 γdmin(kN/m3)(FC=20%) 1.46 (FC=20%) edmax 0.84 (FC=20%)edmin 0.40
Dr=30% Dr=50% Dr=70% Dr=90% 20 25 30 35 40 45 50 15 16 17 18 19 20 γd(kN/m3) (a) φ (p eak )( 。 ) FC=0% FC=5% FC=15% FC=25%
(a) Kaohsiung sands
Dr=30% Dr=50% Dr=70% Dr=90% 20 25 30 35 40 45 50 15 16 17 18 19 20 γd(kN/m3) (b) φ (p eak ) ( 。 ) FC=0% FC=5% FC=15% FC=20% (b) Ottawa sands
Fig. 3. Relationship between peak internal friction angle and dry density for the testing specimens during triaxial CD tests
(a) Dr=30% 0 0.1 0.2 0.3 0.4 0.5 0.6 1 10 Nos 100 1000 (C SR ) la b FC=0% FC=5% FC=15% FC=25% (b) Dr=50% 0 0.1 0.2 0.3 0.4 0.5 0.6 1 10 100 1000 Nos (C SR ) la b FC=0% FC=5% FC=15% FC=25% (c) Dr=70% 0 0.1 0.2 0.3 0.4 0.5 0.6 1 10 Nos 100 1000 (C SR ) la b FC=0% FC=5% FC=15% FC=25%
0 0.1 0.2 0.3 0.4 0.5 0.6 1 10 100 1000 Nos (a) Dr=30% (C SR ) la b FC=0% FC=5% FC=15% FC=20% 0 0.1 0.2 0.3 0.4 0.5 0.6 1 10 100 1000 Nos (b) Dr=50% (C SR ) la b FC=0% FC=5% FC=15% FC=20% 0 0.1 0.2 0.3 0.4 0.5 0.6 1 10 100 1000 Nos (c) Dr=70% (C SR ) la b FC=0% FC=5% FC=15% FC=20%
(a) φ30 0 100 200 300 400 0 5 10 15 20 25 strain(%) σ1 -σ3 (kN /m 2 ) FC=0% , γd=15.4 FC=5% , γd=15.8 FC=15% , γd=17.5 FC=25% , γd=18.5 unit of γd : kN/m3 (b) φ50 0 100 200 300 400 500 0 5 10 15 20 25 strain(%) σ1 -σ3 (k N /m 2) FC=0% , γd=16.3 FC=5% , γd=17.0 FC=15% , γd=18.0 FC=25% , γd=19.0 unit of γd : kN/m3 (c) φ70 0 100 200 300 400 500 600 0 5 10 15 20 25 strain(%) σ1 -σ3 (kN /m 2 ) FC=0% , γd=17.3 FC=5% , γd=17.6 FC=15% , γd=19.0 FC=25% , γd=19.8 unit of γd : kN/m3
0 100 200 300 0 5 10 15 20 25 strain(%) (a) φ30 σ 1-σ 3(k N/ m 2 ) FC=0% , γd=15.7 FC=5% , γd=16.0 FC=15% , γd=17.6 FC=20% , γd=18.0 0 100 200 300 0 5 10 15 20 25 strain(%) (b) φ50 σ1 -σ 3 (k N/ m 2 ) FC=0% , γd=16.2 FC=5% , γd=16.6 FC=15% , γd=18.0 FC=20% , γd=18.5 0 100 200 300 0 5 10 15 20 25 strain(%) (c) φ70 σ1 -σ 3 (k N/ m 2 ) FC=0% , γd=16.7 FC=5% , γd=17.0 FC=15% , γd=18.6 FC=20% , γd=19.5
Fig. 7. Similar stress-strain curves of Ottawa sands with different fines content for three pure sands
unit of γd : kN/m3
unit of γd : kN/m3
(a) φ30 0 0.1 0.2 0.3 0.4 0.5 0.6 1 10 100 1000 Nos (C SR ) la b FC=0% FC=5% FC=15% FC=25% (b) φ50 0 0.1 0.2 0.3 0.4 0.5 0.6 1 10 100 1000 Nos (C SR ) la b FC=0% FC=5% FC=15% FC=25% (c) φ70 0 0.1 0.2 0.3 0.4 0.5 0.6 1 10 100 1000 Nos (C SR ) la b FC=0% FC=5% FC=15% FC=25%
0 0.1 0.2 0.3 0.4 0.5 0.6 1 10 100 1000 Nos (a)φ30 (C S R ) lab FC=0% FC=5% FC=15% FC=20% 0 0.1 0.2 0.3 0.4 0.5 0.6 1 10 100 1000 Nos (b)φ50 (C S R ) lab FC=0% FC=5% FC=15% FC=20% 0 0.1 0.2 0.3 0.4 0.5 0.6 1 10 100 1000 Nos (c)φ70 (C SR ) la b FC=0% FC=5% FC=15% FC=20%
Dr=70% Dr=30% Dr=50% Dr=90% 0 0.1 0.2 0.3 0.4 0.5 0.6 0.7 15 16 17 18 19 20 γd(kN/m3) (a) (C SR ) la b FC=0% FC=5% FC=15% FC=25% 0 0.1 0.2 0.3 0.4 0.5 0.6 0.7 30 32 34 36 38 40 42 44 46 φ° (b) (C SR ) la b FC=0% FC=5% FC=15% FC=25% 0 0.1 0.2 0.3 0.4 0.5 0.6 0.7 0 5 10 15 20 25 30 35 N1 (c) (C SR ) fi el d FC=0% FC=5% FC=15% FC=25%
Fig. 10. Procedure for evaluating in-site liquefaction resistance from cyclic resistance in the laboratory (Kaohsiung sands)
Dr=50% Dr=30% Dr=70% Dr=90% 0 0.1 0.2 0.3 0.4 0.5 0.6 0.7 15 16 17 18 19 20 γd(kN/m3) (a) (C SR ) la b FC=0% FC=5% FC=15% FC=20% 0 0.1 0.2 0.3 0.4 0.5 0.6 28 30 32 34 36 φ° (b) (C SR ) la b FC=0% FC=5% FC=15% FC=20% 0 0.1 0.2 0.3 0.4 0.5 0.6 0.7 0 5 10 15 N1 (c) (C SR ) fi el d FC=0% FC=5% FC=15% FC=20%
Fig. 11. Procedure for evaluating in-site liquefaction resistance from cyclic resistance in the laboratory (Ottawa sands)
0 0.1 0.2 0.3 0.4 0.5 0.6 0.7 0 5 10 15 20 25 30 N1 (a) Dr=30% , φ30 (C SR ) fi el d FC=0% FC=25% 0 0.1 0.2 0.3 0.4 0.5 0.6 0.7 0 5 10 15 20 25 30 N1 (b) Dr=50% , φ50 (C SR ) fi el d FC=0% FC=25% 0 0.1 0.2 0.3 0.4 0.5 0.6 0.7 0 5 10 15 20 25 30 N1 (c) Dr=70% , φ70 (C SR ) fi el d FC=0% FC=25%
Fig. 12. Various paths from FC=0% to 25% for same relative density or similar internal friction angle (Kaohsiung sands) 1 2 1 2 1 2
0 0.1 0.2 0.3 0 5 10 15 N1 (a) Dr=30% , φ30 (C SR ) fi el d FC=0% FC=20% 0 0.1 0.2 0.3 0 5 10 15 N1 (b) Dr=50% , φ50 (C SR ) fi el d FC=0% FC=20% 0 0.1 0.2 0.3 0 5 10 15 N1 (c) Dr=70% , φ70 (C SR ) fi el d FC=0% FC=20%
Fig.13. Various paths from FC=0% to 25% for same relative density or similar internal friction angle (Ottawa sands) 1 2 1 2 1 2
0 0.1 0.2 0.3 0.4 0.5 0.6 0.7 0 5 10 15 20 25 30 N1 (a) (C SR ) fi el d FC=0% FC=5% FC=15% FC=25%
(a) Kaohsiung sands
0 0.1 0.2 0.3 0 5 10 15 N1 (b) (C SR ) fi el d FC=0% FC=5% FC=15% FC=20% (b) Ottawa sands
Fig.14. Increasing fines content within the specimens increases the liquefaction resistance by means of the experimental results 2 2 2 1 1 1 Dr=70% Dr=50% Dr=30% Dr=30% 2 1 1 1 2 2 Dr=70% Dr=50%
0 0.1 0.2 0.3 0.4 0.5 0.6 0.7 15 16 17 18 19 20 γd(kN/m3) (a) (C SR ) la b FC=0% FC=25% 0 0.1 0.2 0.3 0.4 0.5 0.6 0.7 0 5 10 15 20 25 30 N1 (b) (C SR ) fi el d FC=0% FC=25%
Fig.15. Three paths for Kaohisung sands from FC=0% & Dr=50% to FC=25% in the laboratory and in the field 2 1 3 1 3 2