科技部補助專題研究計畫成果報告
期末報告
利用靜態功能性磁振造影探討大腦活動造成之腦部區域代謝變
化(第2年)
計 畫 類 別 : 個別型計畫 計 畫 編 號 : NSC 103-2420-H-004-003-MY2 執 行 期 間 : 104年01月01日至104年12月31日 執 行 單 位 : 國立政治大學應用物理研究所 計 畫 主 持 人 : 蔡尚岳 計畫參與人員: 碩士級-專任助理人員:蘇芬雅 碩士班研究生-兼任助理人員:黃笠哲 報 告 附 件 : 出席國際會議研究心得報告及發表論文 處 理 方 式 : 1.公開資訊:本計畫可公開查詢 2.「本研究」是否已有嚴重損及公共利益之發現:否 3.「本報告」是否建議提供政府單位施政參考:否中 華 民 國 105 年 02 月 05 日
中 文 摘 要 : 靜態功能性影像可以用來觀察大腦處於靜態時不同區域間的功能性 連結,其中大腦預設網路,是被找到的所有網路中最穩定也最常探 討的,目前已經應用於許多認知功能障礙的疾病研究。基於對靜態 功能性影像的興趣,已有非常多的研究致力於探討大腦預設網路的 基本生理機制,其中針對大腦預設網路中,神經傳導物質系統的調 變,就是一個非常重要的議題。然而要探討大腦預設網路以及大腦 生化代謝機制間的關係,目前限於傳統磁振頻譜影像技術的空間解 析度及掃描時間,相當稀少,而我們目前發展的快速頻譜影像方法 ,面回訊磁共振造影技術,則可以克服傳統技術的限制,非常適合 用在這個目的上。本計畫旨在系統性的探討大腦於靜態時的基礎代 謝情形跟大腦預設網路區域間,以及預設網路區域內腦部活動的關 係,主要探討的代謝物有,腦內主要的神經傳導物質,Glutamate及 Glutamine,合稱Glx,以及大腦神經密度的指標,NAA。目前我們已 利用獨立成分分析法,得到大腦預設網路,比較個別受試者分開處 理和所有受試者一起處理的兩種流程,發現利用獨立成分分析法均 能得到類似的大腦預設網路,我們利用得到的預設網路圖譜,將腦 部區域區分並分析跟代謝物濃度之間的相關性,發現在受試者個別 的分析上,預設網路區的Glx以及NAA較非預設網路區域還要高,另 外透過受試者間的比較也發現大腦的左側前扣帶迴(Anterior
Cingulate cortex, ACC)的Glx濃度與的預設網路活動強度有正相關 ,我們的研究證實了靜態大腦網路除了有功能上的區分外,也會造 成生理代謝上的變化,在靜態網路的大腦區域內會有較高的神經傳 導物質濃度。 中 文 關 鍵 詞 : 回訊頻譜影像技術、靜態功能性影像、磁共振頻譜影像、大腦預設 網路 英 文 摘 要 : 英 文 關 鍵 詞 :
科技部補助專題研究計畫成果報告
(□期中進度報告/■期末報告)
利用靜態功能性磁振造影探討大腦活動造成之腦部區域代謝變畫
計畫類別:■個別型計畫 □整合型計畫
計畫編號:MOST 103- 2420 - H - 004 - 003 - MY2
執行期間: 2014 年 1 月 1 日至 2015 年 12 月 31 日
執行機構及系所:政治大學應用物理研究所
計畫主持人:蔡尚岳
共同主持人:
計畫參與人員:蘇芬雅、黃笠哲
本計畫除繳交成果報告外,另含下列出國報告,共 _1_ 份:
□執行國際合作與移地研究心得報告
■出席國際學術會議心得報告
期末報告處理方式:
1. 公開方式:
■非列管計畫亦不具下列情形,立即公開查詢
□涉及專利或其他智慧財產權,□一年□二年後可公開查詢
2.「本研究」是否已有嚴重損及公共利益之發現:■否 □是
3.「本報告」是否建議提供政府單位施政參考 ■否 □是, (請列舉提
供之單位;本部不經審議,依勾選逕予轉送)
中 華 民 國 105 年 1 月 27 日
目錄 前言---2 研究目的---3 文獻探討---4 研究方法---6 結果與討論---10 參考文獻---16 計畫結果自評---19 與計畫相關著作---19 一、前言
Resting state functional MRI (rsfMRI) reveals information about the functional connectivity among various areas of brain (1). Spontaneous low-frequency signal from blood oxygenation level-dependent (BOLD) contrast show spatial distributions across many brain areas. These areas concordant with known functional areas form specific functional connectivity patterns known as resting state network (RSN) (2-6). The correlation between BOLD signal may reflect fluctuation in ongoing neuronal activity rather than noise. Therefore, seed based connectivity or independent component analysis (ICA) is suggested to extract these spontaneous modulation of BOLD signal while participants are at “rest” (1). Regardless of the technique, There are consistent RSNs found in the brain. These RSNs are commonly modulated during active behavior task (5,7,8). For example, Salience network (SN) is proposed to integrate highly processed sensory data with visceral, autonomic, and hedonic “markers,” so that the organism can decide what to do (or not to do) next. Because the nervous system is continuously bombarded by internal and extrapersonal stimuli, a leading priority is to identify the most homeostatically relevant among these myriad inputs. SN anchored by dorsal anterior cingulate (dACC) and orbital frontoinsular cortices with robust connectivity to subcortical and limbic structures (9). One of the most robustly identified and widely investigated RSN is default mode network (DMN), which shows increased activity during rest state than cognitive task (3,6,10). RSNs have been shown to predict the task-response properties of brain regions (11) and help understand neuro-anatomic models established from fMRI studies based on task-activation basis (7). In addition, previous report also showed that RSNs can be found in animal brain (12) and cerebellum (13). Because the success of rsfMRI, it is possible to probe the brain’s functional architecture in normal subjects. RSNs have been widely used to study various neurological and psychiatric conditions (14-16). Abnormalities in RSNs have been reported in many neuropsychiatric disorders and brain disease (17,18) such as social anxiety disorder (5), Alzheimer’s disease (18), Attention Deficit/Hyperactivity Disorder (19), schizophrenia (20), temporal lobe epilepsy (21). In summary, the theoretical and practical motivations for using rsfMRI for clinical applications can be attributed to following points; cerebral energetics, signal to noise, multi-puspose data sets, expanded patient populations, circumventing task-related confound as addressed by previous paper (16). Among all these issues, cerebral energetics plays the most important role. Human brain represents 2% of total boy rate but consumes 20% of body energy during resting state, which is mostly used to support ongoing neuronal signaling (22,23). Task related increased BOLD signal is usually small (<5%) when compared to energy consumption in resting state. This suggests that difference in signal change between normal and pathological
condition will be small if task related change is used. RSNs accessed by ongoing spontaneous BOLD signal may prove a richer source disease related change.
The finding of DMN is of highly interest to neuroscience field to understand the function of brain. As human brain accounts for only about 2% of the body weight, it consumes nearly 20% of the oxygen we extract from the air we breathe which means 20% of body total energy is consumed (23,24). Depending on the approach used, it is estimated that it takes 60% to 80 % of the energy of the brain to support the communication among neurons and their supporting cells (22). This cost-based analysis implies that intrinsic activity, rsfMRI, may be far more significant than evoked activity, fMRI, in terms of overall brain function. DMN as the most consistent and robust RSNs found in the brain may imply higher resting state activity in the DMN than other RSNs. Therefore, it is very important to understand the relation between resting state activity in DMN and biochemical mechanisms, physiological mechanism (25,26) as well as psychological correlate (27,28). One particularly key issue is that neurotransmitter system, as the main excitatory neurotransmitter in the cortex, is likely to play an essential role in DMN regions. As such, Glutamate (Glu), Glutamine (Gln) and γ-aminobutyric acid (GABA) measured using magnetic resonance spectroscopy (MRS) are expected to be modulated between DMN regions and other brain regions. In the past, using combined fMRI and MRS study, the relationship between the resting state level of glutamate or GABA and resting state- and stimulus-related signal changes on healthy subjects have been investigated (26,29,30). In these studies, only specific region such as perigenual anterior cingulate cortex (pgACC), forms part of the DMN or suprageual cingulate cortex (sgACC), the task-positive region of interest are investigated because the limitation of single voxel spectroscopy (SVS) MRS. Therefore, the investigation of resting biochemical levels through most of DMN regions is desired. Magnetic resonance spectroscopic imaging (MRSI) can be used for this purpose if conventional MRSI technique can be further improved for the spatial coverage and acquisition time. However CSI is very time-consuming. If midline of brain that covering most of DMN is of concern, one acquisition for 32x32 matrix MRSI takes at least 30 minutes, which make CSI technique not impractical. The established PEPSI protocol is actually proposed to measure the Glu level for medial wall which contains key anatomical structures of the limbic system and regions involved in top-down modulatory processes. These regions play a particularly important role in a wide range of pathological conditions including psychiatric disorders and chronic pain. Therefore, the established sagittal PEPSI protocol can be directly and properly used to acquire metabolic information along the medial wall of the brain to access the metabolic information from DMN regions.
二、研究目的
Due to the increasing interest on the rsfMRI, there are a lots of researches focused on the biophysiological mechanism of DMN. However, the biochemical mechanism of DMN has not been thoroughly studied. The major reason is the limitation of spatial and temporal properties on commercial MRSI technique. On the other hand, PEPSI, as a state-of-art MRSI technique, is very suitable for this purpose. Therefore, this project is aimed to systemically investigate the resting metabolic levels in the DMN regions and their relationship to the resting state activity in DMN across subjects. Three metabolites, Glutamate, Glutamine and N-acetyl aspartate (NAA) will be main interest because Glu and Gln are important neuron transmitters in the brain. NAA is located primarily in the central and peripheral nervous system and believed to provide a marker of neuronal density and reflect neuronal dysfunction. Therefore, we
expect the resting level of these three metabolites may vary in DMN region and non-DMN region of the brain. Further the resting level of these metabolites may predict the resting state activity in DMN regions. Although we will focus on three metabolites are of interest, up to six metabolites can be quantified from the PEPSI data and will be investigated together in the project.
In the 1st year of this project, we will set up the analyzing procedures for rsfMRI. ICA will be adopted to extract the DMN from the brain according to the methodologies developed in the previous studies (5,17). DMN acquired from all subjects will be group together and compare the spatial consistency to results reported in the previous studies. For MRSI, sagittal PEPSI will be used to acquire metabolic information along the medial wall. High resolution anatomic images acquired by Magnetization Prepared RApid Gradient Echo (MPRAGE) sequence will be acquired for tissue segmentation and image registration using SPM. MPRAGE is a 3D high resolution MRI protocol designed with optimized GM and WM contrast which is very good in GM and WM segmentation. Image registration between PEPSI slice and MPRAGE segmented tissue probability map for partial volume and relaxation correction have already been developed in the ongoing project. Same procedures can be thus used to map DMN regions from rsfMRI data to metabolic maps from PEPSI data. We will be able to separate DMN region and rest of brain region (non-DMN regions) on the concentrations maps of metabolites.
In the 2nd year of this project, we will start to collect more subjects. The sagittal PEPSI will be collected medial wall of left and right hemispheres. Based on the processing procedures developed in the first year, resting metabolic levels in DMN regions and non DMN regions can be quantified for each metabolite. Two-way ANOVA will be adopted to test the significance of difference in metabolic level between DMN and non-DMN regions and between left and right hemisphere. In order to investigate the relationship of metabolic level and the resting activity in the DMN regions, within group template need to be generated to normalize metabolic maps onto it. Because metabolic maps are acquired in single 2-diemensional slice and are specifically located along the medial wall for each subject, we will develop a 2-diemsnional warping algorithm to generate template for our subject group and normalize metabolic maps onto it. In this way, resting state activity within DMN regions can be correlated with resting metabolic level in voxel based across subject.
三、文獻探討
RSNs have been widely used to study various neurological and psychiatric conditions (14-16). Abnormalities in RSNs have been reported in many neuropsychiatric disorders and brain disease (17,18) such as social anxiety disorder (5), Alzheimer’s disease (18), Attention Deficit/Hyperactivity Disorder (19), schizophrenia (20), temporal lobe epilepsy (21), In summary, the theoretical and practical motivations for using rsfMRI for clinical applications can be attributed to following points; cerebral energetics, signal to noise, multi-puspose data sets, expanded patient populations, circumventing task-related confound as addressed by previous paper (16).
The concept of the DMN was sued to describe a set of brain regions that show greater BOLD signal during rest than during any one of a broad range of experimental tasks have received attention. These areas show active during rest and suspended deactivated when specific goal-directed behavior is needed. Interest in this ‘‘deactivation,’’ phenomenon has been sparked by the finding that particular brain regions, including two midline regions, the posterior cingulate cortex (PCC) and ventral anterior cingulate cortex (vACC),
consistently demonstrate such task-related decreases in activity across a broad range of cognitive tasks (31). The hypothesis for DMN is that this set of brain regions constitutes an organized network, whose activity is ongoing during rest and suspended during performance of externally cued tasks, that supports a ‘‘default mode of brain function’’ (3).
DMN is known to involve PCC, precuneus, bilateral inferior parietal gyrus, angular gyrus, middle temporal gyrus, superior frontal gyrus and medial frontal gyrus. These refions has been found to be negatively or anti-correlated with regions that tend to increase their activity during attention demanding tasks. While strong positive correlations between regions indicate that those regions are typically comodulated during task performance, anti-correlations between networks indicate that the networks are temporally modulated in opposite directions (7,32). Anti-correlations may therefore reveal key aspects of functional organization of the brain, as they are thought to represent the dichotomy between increased brain activity in regions supporting execution of a task and decreased brain activity in regions involved in unrelated processes (6,32). Anterior regions such as medial prefrontal cortex have been associated with self-referential processing (33). Posterior regions of the DMN, particularly the posterior cingulate, are linked to episodic memory (18) and memory consolidation (34). Differences in activity of the DMN have been linked to cognitive deficits in a number of clinical populations. To date, decreased correlation in the DMN have been demonstrated in individuals with Alzheimer’s disease (19), amyotrophic lateral sclerosis (35), autism spectrum disorders (36), A, schizophrenia (20), and ADHD (37). The finding of DMN is of highly interest to neuroscience field to understand the function of brain. As human brain accounts for only about 2% of the body weight, it consumes nearly 20% of the oxygen we extract from the air we breathe which means 20% of body total energy is consumed (23,24). Depending on the approach used, it is estimated that it takes 60% to 80 % of the energy of the brain to support the communication among neurons and their supporting cells (22). This cost-based analysis implies that intrinsic activity, rsfMRI, may be far more significant than evoked activity, fMRI, in terms of overall brain function. DMN as the most consistent and robust RSNs found in the brain may imply higher resting state activity in the DMN than other RSNs. Therefore, it is very important to understand the relation between resting state activity in DMN and biochemical mechanisms, physiological mechanism (25,26) as well as psychological correlate (27,28). One particularly key issue is that neurotransmitter system, as the main excitatory neurotransmitter in the cortex, is likely to play an essential role in DMN regions. As such, Glutamate (Glu), Glutamine (Gln) and γ -aminobutyric acid (GABA) measured using magnetic resonance spectroscopy (MRS) are expected to be modulated between DMN regions and other brain regions. In the past, using combined fMRI and MRS study, the relationship between the resting state level of glutamate or GABA and resting state- and stimulus-related signal changes on healthy subjects have been investigated (26,29,30). In these studies, only specific region such as perigenual anterior cingulate cortex (pgACC), forms part of the DMN or suprageual cingulate cortex (sgACC), the task-positive region of interest are investigated because the limitation of single voxel spectroscopy (SVS) MRS.
To improve the spatial resolution and acquisition of MRSI, Proton Echo Planar Spectroscopic Imaging (PEPSI) is a fast MRSI technique, first proposed by Mansfield (38) and then realized by Posse (39). PEPSI use the spatial encoding gradient during signal acquisition based on EPI sequence. The advantage of this method in acquisition time originates from the fact that an entire K-space plane is sampled within a single excitation. One phase encoding step can be removed and thus the duration of a 3D spatial/spectral space can
be reduced to that of a conventional 2D space. As the example above, scan time of 30 minutes can be reduced to around one minute. The total scan time for MRSI protocol can be ranged from one minute to 10 minutes according to the SNR, which enable the possibility to acquire metabolic information form whole midline of the brain. These high-speed MRSI techniques offer greater than order-of-magnitude acceleration with high spectral resolution, adequate spectral width, feasibility of short echo time and excellent sensitivity per unit time and unit volume. The PEPSI technique has been developed for clinical MR scanners to measure 2D and 3D metabolite distributions in several minutes (40,41) and with high spatial resolution (42). We have been working on PEPSI sequence in clinical system for several year (43) and have successfully integrated it with parallel imaging to further accelerate encoding speed (40,44). In the past, we have already built up a MRSI method to access the six major metabolite concentrations of brain including Glu and Gln. The MRSI protocol based on PEPSI method have following properties; 1) less than 10 minutes acquisition time; 2) whole slice coverage using 2-dimensional MRSI ; 3) at least 32x32 spatial resolution; 4) feasibility for multiple slice orientation; 5) information for inter session and inter subject comparison (45).
四、研究方法
Data acquisitions of rsfMRI and MRSI experiments
Normal volunteers are enrolled in this study. 20 normal subjects at age around 20~25 year old were enrolled for the project of the 1st and 2nd year and a total of 50 subjects are for the aim of 3rd year of this project. All experiments were performed on a 3T MR system (Skyra, SIEMENS Medical Solutions, Erlangen, Germany) with a 32-channel coil array that covers the whole brain circumferentially with eight surface receive-only coils. We use the body coil for RF excitation. For each subject, high resolution T1 MPRAGE (slice thickness=1 mm; TR=8.9 msec.; TE=2.27 msec.; Flip Angle= 7°; TI=1100 msec.; MAT
=256*256; FOV =256*256 mm2; acceleration=GRAPPAx2) will be collected in the first, which takes 6
minutes. Then, rsfMRI experiments will be conducted with gradient echo echo-planar imaging sequence
(slice thickness=4 mm; TR=2 sec.; TE=30 msec.; Flip Angle= 90°; MAT =64*64; FOV=256*256 mm2;
acceleration=GRAPPAx2). 35 transverse slices tilted to cover whole brain area were acquired. A total of 204 measurements will be conducted, yielding a total scan time around 7 minutes. During the rsfMRI experiments, subjects will be instructed to rest with their eyes closed, not to think about anything, and not to fall asleep.
MRSI experiments were conducted subsequently. Self developed PEPSI sequence modified from Siemens CSI pulse sequence were used (45). Two-dimensional MRSI data were acquired with an in-plane resolution of 8 x 8 mm2 with a 256 x 256 mm2 FOV. A 14-mm thick sagittal plane was selected to cover the medial wall. Up to eight slices of outer-volume lipid suppression were applied along the perimeter of the brain to suppress the lipid signal. To reduce the partial volume effect from cerebrospinal fluid, the MRSI plane was placed slightly away from the central line. Experimental parameters were TR = 1.5 sec., TE = 35 msec., and number of excitations (NEX) = 8. A non-water suppressed (NWS) MRSI scan without pre-saturation of the water signal was acquired using a single average for automatic phase correction and calibration of metabolite concentrations. Routine shimming and adjustment for water suppression will be carried out automatically by the MR system. The scan time for two MRSI scans located in left and right hemisphere, respectively will be less than 20 minutes. After the PEPSI scans, multi-slice sagittal T1-weighted images were collected using a gradient echo sequence (TR/TE/FA: 250ms/2.61ms/ 70 degrees; FOV: 256 x256 mm2; MAT: 128 x 128; slice thickness: 2mm). Seven slices, yielding a 14 mm volume, are
located at the same spatial location as the PEPSI slice, which cover the same spatial volume as PEPSI scan. These T1 images will be used as anatomical reference for registration MPRAGE and rsfMRI images to the PEPSI slice. Referenced T1 take around 2 minutes. All imaging protocols can be finished in 40 minutes.
ICA and identification of DMN in rsfMRI (1st year)
Preprocess of rsfMRI data was carried out using SPM8 software (http://www.fil.ion.ucl.ac.uk/spm). The first four measurements will be discarded to ensure steady-state magnetization in longitudinal axis. The remaining 200 functional image volumes will be first corrected for within-scan time differences between slices using bilinear interpolation and realigned to the first volume to correct for head movement using least square minimization. Subjects will be excluded if the estimated head motion exceeds 1.5 mm or rotation exceeds 1.5 degree. To transform realigned functional images to standard space, following steps will be performed: 1) the realigned functional images are all coregistered to structure T1 images; 2) the structural images are segmented into gray mater, white matter, and cerebrospinal fluid using a unified segmentation algorithm. Forward and inverse transformation parameters between standard space and subject space can be estimated; 3) the realigned corrected functional volumes are spatially normalized to Montreal Neurological Institute (MNI) space using the normalized parameters estimated during segmentation, and functional images are then re-sampled into a voxel size of 2-mm3. Then, spatially smoothed will be performed by convolution with an isotropic Gaussian kernel of 4 mm full width half maximum to decrease the spatial noise.
For each subject, the smoothed, normalized fMRI images were concatenated across time to form a single four-dimensional image. ICA and identification of RSNs spatial ICA will be conducted using the GIFT software (http://icatb.sourceforge.net/, version 1.3e) (17,46). The ICA is a statistical technique that separates a set of signals into independent—uncorrelated and non-Gaussian spatiotemporal components. Most recently, ICA has been used to identify low-frequency neural networks during resting-state or cognitively undemanding fMRI scans (18). There is no consensus, as yet, on how to choose the optimal number of independent components (IC), though methods to do so are in development (46). It is possible to determine the number of ICs using minimum description length (MDL) criterion. This is usually adopted when there are many time points in the time course, which is usually encountered in group ICA (5,13). Here, we analysis the ICA in individual space, so we will choose to have the analysis output 20 components. Temporal band-pass filtering (0.01–0.08 Hz) will be performed on the time series of each voxel to reduce the effects of low-frequency drift and high-frequency noise Then, ICs (with time-courses and spatial maps) can be estimated sing the FastICA algorithm from functional images from each subject. For each IC, the time-course corresponds to the waveform of a specific pattern of coherent brain activity, and the intensity of this pattern of brain activity across the voxels is expressed in the associated spatial map (5). The automated process will be then employed to select the component in each subject that most closely matched the default-mode network template (figure 1). To do this, spatial correlation coefficients of ICs to template of specific RSNs template will be calculated. Instead of selecting the IC with largest correlation coefficients as implemented in the previous studies (5,13), we will select ICs with correlation coefficients over a threshold. If two or three ICs have large enough correlation coefficients, these ICs should have similar spatial pattern to the specific RSNs. It is more intuitive to assign these ICs to the RSNs. The threshold will be decided from the subjects collected in the first year. According to spatial correlation coefficients reported the previous
studies, 0.3 will be a good candidate in the first place. In this project, we will focus on two specific RSNs, DMN. For each subject, spatial intensity maps for DMN will be generated by averaging selected ICs. Then, mask of DMN will be generated according to the spatial intensity maps. Voxel’s intensity larger than spatial averaged value will be assigned to DMN region.
To display the DMN for whole subject group, the intensity values in each spatial map can be converted to Z values, removing the average value and dividing by the standard deviation of the intensity distribution across the subjects(8,46). As ICA can intrinsically extract spatial and temporal coherent patterns of neuronal activity on fMRI data, it is commonly accepted that Z values can indirectly provide a measure of functional connectivity within the network (47). Group results can be then used to verify the networks generated in thin project to those reported in the previous studies.
Quantification of metabolites (1st year)
PEPSI data from the different coils and measurements were saved and processed individually. Standard post processing strategies including spatial and temporal filtering, phase correction and even-odd echo editing were performed for the PEPSI data as described previously. The reconstructed spectral width of the PEPSI data after even/odd echo editing was 1086 Hz with 512 complex points yielding a spectral resolution of 2.1 Hz. MRSI data from the different coils were combined after phase correction to avoid possible artifacts caused by partial phase cancelation (40). Frequency adjustment was applied to the different measurements. Finally, data from the eight measurements will be averaged separately. Al the post processing programs are written in MATLAB (Mathworks, Naptick, MA, USA)
LCModel will be used to quantify the metabolites. Six metabolites commonly seen in the brain including NAA, total Creatine (tCr) including creatine and phosphocreatine, Choline (Cho), myo-Inositol
(mI), Glu, Gln. Due the overlapping of Glu and Gln on the 1H MR spectra, Glu and Gln are usually
considered not differentiable in low field strength such as 3T. Therefore, the combination of Glu and Gln (Glx) will be quantified. At first, metabolites maps are generated using water scaling. Subsequently, tprobability maps of GM, WM and CSF can be generated from MPRAGE images using tissue segmentation tool in SPM8. Then, image coregistration tool provided by SPM8 is used to estimate the transformation parameters between the referenced T1 images to the MPRAGE images. These registration parameters can be applied to the probability maps of GM, WM and CSF to generate corresponding tissue probability maps for PEPSI, which is also carried out in SPM8 by reslice tool. Finally, metabolites concentrations maps can be corrected for partial volume and relaxation effect according to the known tissue fraction in each voxel.
To ensure the spectral quality of PEPSI data, we can check the overall spectral quality by the full-width at half maximum (FWHM in parts per million) and the SNR provided by LCModel. If there is significant drop in SNR or increase in FWHM, we will exclude the subject for following analysis. To ensure the reliability of quantified metabolites, the CRLB, as provided by LCModel, was used as the error metric for metabolite quantification. For the calculation of concentrations in region of interest, we use the following thresholds to reject voxels with unsatisfactory LCModel fit: CRLB > 20% for NAA, tCr and Cho, and CRLB > 50% for mI, Glu, Gln and Glx. Therefore, the mean and standard deviation of metabolite concentrations for specific mask can be calculated. Because the tissue fraction maps are known, we can further exclude voxels based on the GM fraction (GM ratio/ (WM ratio + GM ratio + CSF ratio)). Because DMN and SN should reside mostly in GM, voxels with too much WM or CSF should be excluded.
Integration of rsfMRI and MRSI results (2nd year)
To compare DMN and metabolic information, we need to integrate rsfMRI results and MRSI results. We did this by extracting the partition of DMN along the medal wall that match the PEPSI slice. Because the DMN maps extracted from ICA are in standard space, we firstly transform DMN maps back to subject space by the inverse transformation parameters. These parameters are already estimated during rsfMRI preprocess. We can use normalize tool in SPM8. Then, as we used reslice tool in SPM to extract tissue probability maps from MPRAGE images that match PEPSI slice, we can use the same way to transform DMN maps from subject space to PEPSI space. In this way, single slice DMN map and DMN mask that align with PEPSI slice can be extracted from whole brain DMN maps. The work flow is shown in the following figure.
For the voxel based analysis of MRSI results and rsfMRI results, we used a 2-D warping algorithm, which model the transformation between 2D images as locally affine but globally smooth variations in image intensities. The algorithm is built upon a differential multi-scale framework. It can produce the warped image and the transformed matrix. We used the middle slice of reference T1 images to do the group normalization for subjects. For the first 2D warping iteration, we let the first subject’s reference T1 image as target. After 1st warping, we average the warped reference T1 images from all subjects as the final group template. In 2D warping, all T1 images were warped to this group template and the transformed matrixes were generated. Because the reference T1 has the same position with metabolite maps as so as DMN maps, we then used this transformed matrix to normalize metabolite maps and DMN maps into a group template. With this algorithm, it is possible to do voxel based analysis in the subjects group for 2D images. The work flow is shown in the following figure.
To observe the resting level of metabolites concentrations belong to DMN region and non-DMN region of the brain, DMN mask and non-DMN masks are defined. DMN mask can be directly generated according to procedures described above. Non-DMN mask is defined as rest of brain region not included in DMN mask. Voxel with GM less than 50% will be also excluded from the masks to ensure metabolite concentrations are evaluated from GM. Mean and standard deviation of metabolites concentrations will be evaluated in DMN mask and DMN region from each hemisphere. Difference of resting metabolic levels for
each metabolite in each hemisphere can be tested for significance in DMN and non-DMN regions by Pair t-test. Then, two-way ANOVA will be used to examine the difference in metabolic levels between DMN and non-DMN region and between left and right hemisphere.
To observe the correlation between resting level of metabolites and resting state activity in DMN regions, we need to transform metabolite maps and DMN maps to a within group standard space. We can assume that single slice metabolite map and DMN map are located along with the medial wall in each subject if we have carefully located the PEPSI slice during acquisition of MRSI data. Then 2-diemnsional warping algorithm can be applied in following steps; 1) generate a within group template for medial by warping referenced T1 images or tissue probability maps from all subjects; 2) warping metabolite map and DMN map from each subject to this within group template. In this way, resting state activity from DMN maps and metabolite concentrations can be directly compared in voxel base. Here linear regression was be used to evaluate the correlation between resting state activity and resting metabolic level for voxels in the DMN region across subjects. We focus on the Glx, which is the important neurotransmitter of brain. In this project, we used two different methods to represent the DMN intensity of subject. In Method 1, we used the z-score of DMN maps as DMN intensity. In this way, each voxel has its own metabolic level and DMN intensity; In Method 2, we repeated the method reported by D. Kapogiannis et al in 2013 (48). Generalized linear model analysis (GLM) was used to generate the DMN intensity by modeling the resting scan as a single block and time course of DMN component from ICA was used. The design matrix was generated by convolving a canonical hemo-dynamic response function (HRF). Then the beta value was generated from regression between the DMN time course and design matrix as the value of DMN intensity (49). In this way, there is only one DMN intensity that presents the overall DMN activity for a subject. The regression was performed between metabolic level in each voxel and the same DMN intensity.
五、結果與討論
(1st year) Extracting DMN from ICA: comparison between gICA and iICA
For iICA, ICA was performed in each subject. We used one sample t-test to generate the spatial maps for group result. For gICA, data from all subjects were concatenated together and were analyzed after data reduction using principle component analysis. Components for each subject were then be reconstructed by using group components. After ICA process, a mask was generated to exclude pixels outside of the brain for each subject. Correlation coefficient was calculated between spatial maps of twenty independent
components and the template of DMN, and was used for choosing components best fit to DMN template. Component showing highest correlation coefficient was chosen as the best DMN component for each subject. For gICA, we chose the highest correlation coefficient component in group level and then reconstruct the corresponding component for each subject in individual level. Every DMN maps were be warped to a group template generated from T1 images and resized to match the spatial resolution of metabolite maps.
For all subjects, the correlation coefficients of DMN maps from iICA and gICA were shown in following Table. The correlation coefficients range from 0.2 to 0.5. Highest correlation coefficient was found in group level of iICA result. Lowest correlation coefficient was found in subject level in iICA. Comparing between these iICA and gICA, DMN maps shows higher correlation coefficients in iICA than in gICA in 18 subjects. However, both maps shows typical DMN pattern and there is no noticeable difference between DMN maps
from iICA and gICA by visual inspection. There are more DMN regions clustered together on DMN maps from iICA than that from gICA. DMN maps from iICA were then used for following analysis. The following figure showed (Top) the DMN template, (middle) the chosen DMN component for subject #7 using iICA, (Lower) the chosen DMN component for using gICA. The correlation coefficients are 0.48 and 0.32
respectively.
Subject No. iICA gICA Subject No. iICA gICA
1 0.22 0.30 11 0.41 0.26 2 0.42 0.28 12 0.32 0.24 3 0.40 0.31 13 0.39 0.30 4 0.37 0.33 14 0.49 0.30 5 0.15 0.28 15 0.48 0.29 6 0.35 0.32 16 0.36 0.27 7 0.48 0.32 17 0.45 0.31 8 0.32 0.26 18 0.36 0.22 9 0.45 0.29 19 0.27 0.21 10 0.37 0.32 20 0.47 0.16 Group 0.59 0.39
Sagittal metabolite maps and group normalization (1st and 2nd year)
(Left) Here we showed the sagittal metabolite maps along medial wall for five metabolites. The results were the average of metabolite maps normalized to group template for 20 subjects. (Right) With the warping algorithm, we can test the age related metabolic change and hemisphere asymmetric distribution of metabolites. PEPSI can be used to provide important complementary neurochemical information and variations in the distribution related directly to the brain anatomy
Integration of DMN and metabolite maps to group template for voxel based analysis (1st and 2nd year) (Left) The process of 2D warping algorithm was demonstrated for three subjects, where each row represents a subject. 1st column is the original middle slice of reference T1. The 2nd column showed the T1 images after first 2D warping and 3rd column showed T1 images after second 2D warping. We can find that the 2D warping algorithm can successfully applied to align the 2D slice from different subjects into a group template. (Right) Demonstration of how DMM and metabolite maps were transformed to group template, where each row represents a subject. The column images from left to right are T1, metabolite maps (Glx) and DMN maps. After this process, we can perform statistical test for metabolic level and DMN strength for inter-subject correlation and for within subject comparison.
(2nd year) Variation of metabolic level associated with DMN strength: within subject comparison and
inter subject correlation
For within subject comparison, the concentrations of five metabolites defined in DMN and non-DMN regions were shown in the table. The differences in concentrations were found in NAA, Glx for right hemisphere and were found in NAA, tCr for left hemisphere. When both hemispheres were considered, the NAA and Glx have higher concentrations in DMN region than in non-DMN region. The possible
explanation is that the DMN depicts the brain regions having high neuro activity in resting state, which directly lead to more neurotransmitters, Glx, in these areas. Further high NAA concentrations may imply that these regions can have more neuron accumulation because NAA is known to be a neuronal marker in the brain. The tCr showed reverse tendency but there is no explanation to this finding. Due to consistency of physiological state of brain, we don’t expect to find large metabolic variation in the brain regions. We will seek to collect more subjects to confirm the finding. The percentage change of metabolic level can be reported in a better confidence level.
Right hemi. Left hemi Left and Right
DMN non-MDN DMN non-MDN DMN non-MDN
NAA 8.67±0.92* 8.02±0.7* 9.39±0.97* 8.68±0.84* 8.96±0.95* 8.38±0.84* tCr 2.35±0.32 2.44±0.31 2.35±0.34* 2.7±0.39* 2.38±0.37* 2.55±0.36* mI 4.64±0.6 4.56±0.56 4.59±0.56 4.54±0.67 4.59±0.56 4.56±0.61 Cho 2.8±0.46 2.71±0.47 2.79±0.5 2.73±0.52 2.74±0.54 2.73±0.48 Glx 11.09±0.99* 10.46±1.06* 11.44±0.85 11.00±1.27 11.15±1.03* 10.77±1.16* (*: P<0.05)
A
B
C
For inter subject correlation, the regression was performed on the metabolic level and DMN intensity for all subjects. In method 1, voxel wise DMN intensity was used. This is to investigate if the local DMN intensity is correlated to Glx level. In method 2, overall DMN intensity represent the resting state activity of a subject was used. This is to investigate if there is any region having Glx level associated with system resting activity. The regression results for method 1 and 2 were shown in the figures. Beta values with P<0.05 were shown. For method 1, there are two clusters: one in posterior regions of left hemisphere and one in the frontal area of right hemisphere. For method 2, a cluster at frontal area was found in the left hemisphere.
To verify the results, we performed ROI analysis for these three clusters. We defined the region found in method 1 left hemisphere as region A, the region in method 1 right hemisphere as region B, and the region in method 2 left hemisphere as region C as shown in the figure (LEFT). The regression was performed between DMN intensities defined by method1or 2 and averaged Glx level in ROI. For region A, the R2 is 0.3549 with p<0.05. For region B, the R2 is 0.6989 with p<<0.01. For region C, the R2 is 0.3549 with p<<0.01.
According to Automated Anatomical Labeling (AAL), the region A involved in precuneus (No.36 Cingulum_Post_L), the region B and C are a part of anterior cingulate cortex (ACC) (No.31&32
Cingulum_Ant_L/R). Our finding is in accordance to the DMN theory where ACC is usually sued as seed point in the analysis of DMN, which plays a key role in the theory of DMN. Our finding further showed that individual DMN activity can be highly related to the resting Glx level. However, it is not fully understand why only voxel wise DMN intensity and overall DMN intensity were found to correlated Glx level at different hemisphere. This need further investigation.
Left Hemi.
Right Hemi.
Method 1:
voxel wise DMN intensity
Method 2:
Overall DMN intensity
Left Hemi.
六、參考文獻
1. Faria AV, Joel SE, Zhang Y, Oishi K, van Zjil PC, Miller MI, Pekar JJ, Mori S. Atlas-based analysis of resting-state functional connectivity: evaluation for reproducibility and multi-modal
anatomy-function correlation studies. NeuroImage 2012;61(3):613-621.
2. Biswal B, Yetkin FZ, Haughton VM, Hyde JS. Functional connectivity in the motor cortex of resting human brain using echo-planar MRI. Magn Reson Med 1995;34(4):537-541.
3. Greicius MD, Krasnow B, Reiss AL, Menon V. Functional connectivity in the resting brain: a network analysis of the default mode hypothesis. Proc Natl Acad Sci U S A 2003;100(1):253-258.
4. Di Martino A, Scheres A, Margulies DS, Kelly AM, Uddin LQ, Shehzad Z, Biswal B, Walters JR,
Castellanos FX, Milham MP. Functional connectivity of human striatum: a resting state FMRI study. Cereb Cortex 2008;18(12):2735-2747.
5. Liao W, Chen H, Feng Y, Mantini D, Gentili C, Pan Z, Ding J, Duan X, Qiu C, Lui S, Gong Q, Zhang W. Selective aberrant functional connectivity of resting state networks in social anxiety
Method 1: left hemi.
Method 1: right hemi.
disorder. NeuroImage 2010;52(4):1549-1558.
6. Fox MD, Snyder AZ, Vincent JL, Corbetta M, Van Essen DC, Raichle ME. The human brain is
intrinsically organized into dynamic, anticorrelated functional networks. Proc Natl Acad Sci U S A 2005;102(27):9673-9678.
7. Fox MD, Corbetta M, Snyder AZ, Vincent JL, Raichle ME. Spontaneous neuronal activity
distinguishes human dorsal and ventral attention systems. Proc Natl Acad Sci U S A 2006;103(26):10046-10051.
8. Mantini D, Corbetta M, Perrucci MG, Romani GL, Del Gratta C. Large-scale brain networks account
for sustained and transient activity during target detection. NeuroImage 2009;44(1):265-274.
9. Seeley WW, Menon V, Schatzberg AF, Keller J, Glover GH, Kenna H, Reiss AL, Greicius MD.
Dissociable intrinsic connectivity networks for salience processing and executive control. The Journal of neuroscience : the official journal of the Society for Neuroscience 2007;27(9):2349-2356. 10. Raichle ME, Snyder AZ. A default mode of brain function: a brief history of an evolving idea.
NeuroImage 2007;37(4):1083-1090; discussion 1097-1089.
11. Vincent JL, Snyder AZ, Fox MD, Shannon BJ, Andrews JR, Raichle ME, Buckner RL. Coherent
spontaneous activity identifies a hippocampal-parietal memory network. Journal of neurophysiology 2006;96(6):3517-3531.
12. Lu H, Zou Q, Gu H, Raichle ME, Stein EA, Yang Y. Rat brains also have a default mode network. Proc Natl Acad Sci U S A 2012;109(10):3979-3984.
13. Sang L, Qin W, Liu Y, Han W, Zhang Y, Jiang T, Yu C. Resting-state functional connectivity of the vermal and hemispheric subregions of the cerebellum with both the cerebral cortical networks and subcortical structures. NeuroImage 2012;61(4):1213-1225.
14. Greicius M. Resting-state functional connectivity in neuropsychiatric disorders. Current opinion in neurology 2008;21(4):424-430.
15. Zhang D, Raichle ME. Disease and the brain's dark energy. Nature reviews Neurology 2010;6(1):15-28.
16. Fox MD, Greicius M. Clinical applications of resting state functional connectivity. Frontiers in systems neuroscience 2010;4:19.
17. Greicius MD, Flores BH, Menon V, Glover GH, Solvason HB, Kenna H, Reiss AL, Schatzberg AF.
Resting-state functional connectivity in major depression: abnormally increased contributions from subgenual cingulate cortex and thalamus. Biol Psychiatry 2007;62(5):429-437.
18. Greicius MD, Srivastava G, Reiss AL, Menon V. Default-mode network activity distinguishes Alzheimer's disease from healthy aging: evidence from functional MRI. Proc Natl Acad Sci U S A 2004;101(13):4637-4642.
19. Wang L, Zhu C, He Y, Zang Y, Cao Q, Zhang H, Zhong Q, Wang Y. Altered small-world brain
functional networks in children with attention-deficit/hyperactivity disorder. Hum Brain Mapp 2009;30(2):638-649.
20. Liu Y, Liang M, Zhou Y, He Y, Hao Y, Song M, Yu C, Liu H, Liu Z, Jiang T. Disrupted small-world networks in schizophrenia. Brain 2008;131(Pt 4):945-961.
21. Voets NL, Beckmann CF, Cole DM, Hong S, Bernasconi A, Bernasconi N. Structural substrates for resting network disruption in temporal lobe epilepsy. Brain 2012;135(Pt 8):2350-2357.
22. Raichle ME. Neuroscience. The brain's dark energy. Science 2006;314(5803):1249-1250.
23. Shulman RG, Rothman DL, Behar KL, Hyder F. Energetic basis of brain activity: implications for neuroimaging. Trends in neurosciences 2004;27(8):489-495.
24. Raichle ME. Cognitive neuroscience. Bold insights. Nature 2001;412(6843):128-130.
25. Buckner RL, Andrews-Hanna JR, Schacter DL. The brain's default network: anatomy, function, and relevance to disease. Ann N Y Acad Sci 2008;1124:1-38.
26. Northoff G, Walter M, Schulte RF, Beck J, Dydak U, Henning A, Boeker H, Grimm S, Boesiger P. GABA concentrations in the human anterior cingulate cortex predict negative BOLD responses in fMRI. Nature neuroscience 2007;10(12):1515-1517.
27. He BJ, Raichle ME. The fMRI signal, slow cortical potential and consciousness. Trends in cognitive sciences 2009;13(7):302-309.
28. Mason MF, Norton MI, Van Horn JD, Wegner DM, Grafton ST, Macrae CN. Wandering minds: the
default network and stimulus-independent thought. Science 2007;315(5810):393-395.
29. Duncan NW, Enzi B, Wiebking C, Northoff G. Involvement of glutamate in rest-stimulus interaction between perigenual and supragenual anterior cingulate cortex: a combined fMRI-MRS study. Human brain mapping 2011;32(12):2172-2182.
30. Enzi B, Duncan NW, Kaufmann J, Tempelmann C, Wiebking C, Northoff G. Glutamate modulates
resting state activity in the perigenual anterior cingulate cortex - A combined fMRI-MRS study. Neuroscience 2012;227:102-109.
31. Raichle ME, MacLeod AM, Snyder AZ, Powers WJ, Gusnard DA, Shulman GL. A default mode of
brain function. Proc Natl Acad Sci U S A 2001;98(2):676-682.
32. Uddin LQ, Kelly AM, Biswal BB, Xavier Castellanos F, Milham MP. Functional connectivity of
default mode network components: correlation, anticorrelation, and causality. Hum Brain Mapp 2009;30(2):625-637.
33. Buckner RL, Carroll DC. Self-projection and the brain. Trends in cognitive sciences 2007;11(2):49-57.
34. Miall RC, Robertson EM. Functional imaging: is the resting brain resting? Current biology : CB 2006;16(23):R998-1000.
35. Mohammadi B, Kollewe K, Samii A, Krampfl K, Dengler R, Munte TF. Changes of resting state
brain networks in amyotrophic lateral sclerosis. Experimental neurology 2009;217(1):147-153. 36. Kennedy DP, Redcay E, Courchesne E. Failing to deactivate: resting functional abnormalities in
autism. Proc Natl Acad Sci U S A 2006;103(21):8275-8280.
37. Zhu CZ, Zang YF, Cao QJ, Yan CG, He Y, Jiang TZ, Sui MQ, Wang YF. Fisher discriminative
analysis of resting-state brain function for attention-deficit/hyperactivity disorder. NeuroImage 2008;40(1):110-120.
38. Mansfield P. Spatial mapping of the chemical shift in NMR. Magn Reson Med 1984;1(3):370-386.
39. Posse S, Tedeschi G, Risinger R, Ogg R, Le Bihan D. High speed 1H spectroscopic imaging in human brain by echo planar spatial-spectral encoding. Magn Reson Med 1995;33(1):34-40.
40. Tsai SY, Otazo R, Posse S, Lin YR, Chung HW, Wald LL, Wiggins GC, Lin FH. Accelerated proton
echo planar spectroscopic imaging (PEPSI) using GRAPPA with a 32-channel phased-array coil. Magn Reson Med 2008;59(5):989-998.
41. Otazo R, Tsai SY, Lin FH, Posse S. Accelerated short-TE 3D proton echo-planar spectroscopic imaging using 2D-SENSE with a 32-channel array coil. Magn Reson Med 2007;58(6):1107-1116. 42. Chu A, Alger JR, Moore GJ, Posse S. Proton echo-planar spectroscopic imaging with highly
effective outer volume suppression using combined presaturation and spatially selective echo dephasing. Magn Reson Med 2003;49(5):817-821.
43. Tsai SY, Posse S, Lin YR, Ko CW, Otazo R, Chung HW, Lin FH. Fast mapping of the T2 relaxation
time of cerebral metabolites using proton echo-planar spectroscopic imaging (PEPSI). Magn Reson Med 2007;57(5):859-865.
44. Lin FH, Tsai SY, Otazo R, Caprihan A, Wald LL, Belliveau JW, Posse S. Sensitivity-encoded (SENSE) proton echo-planar spectroscopic imaging (PEPSI) in the human brain. Magn Reson Med 2007;57(2):249-257.
45. Tsai SY, Lin YR, Wang WC, Niddam DM. Short- and long-term quantitation reproducibility of brain metabolites in the medial wall using proton echo planar spectroscopic imaging. NeuroImage
2012;63(3):1020-1029.
46. Calhoun VD, Adali T, Pearlson GD, Pekar JJ. A method for making group inferences from functional MRI data using independent component analysis. Hum Brain Mapp 2001;14(3):140-151.
47. Damoiseaux JS, Rombouts SA, Barkhof F, Scheltens P, Stam CJ, Smith SM, Beckmann CF.
Consistent resting-state networks across healthy subjects. Proc Natl Acad Sci U S A 2006;103(37):13848-13853.
48. Kapogiannis D, Reiter DA, Willette AA, Mattson MP. Posteromedial cortex glutamate and GABA
predict intrinsic functional connectivity of the default mode network. NeuroImage 2013;64:112-119. 49. Calhoun VD, Liu J, Adali T. A review of group ICA for fMRI data and ICA for joint inference of
七、計畫成果自評
Overall, we have finished data collection and data analysis including spectral preprocess and LCModel fitting for aim of the 1st year. In the following month, we will integrate quantitative results including ROI analysis for concentrations in whole brain, WM and GM for further statistic analysis, which includes fitting reliability by CRLB and reproducibility by COV. Comparison between TEavg protocol using 8 and 16 steps as well as between TEavg and TEcon protocols on the performance of Glu fitting associate with all other metabolites can be concluded. Our finding should be helpful in establishing optimized MRSI protocol to access Glu in the brain. We schedule to submit these results f to international journal at end of this year.
八、與本計畫相關著作
會議論文
1. Jia-Yang Wu, Chun-Hao Huang, Woan-Chyi Wang, Yi-Ru Lin, Shang-Yueh Tsai, Extraction of Default mode network using ICA: Comparison between individual and group analysis, Proceedings of
Organization of Human Brian Mapping, Honolulu, USA, 2015
2. Yu-Sheng Tseng, Teng-Yi Huang, Fu-Nien Wang, Shang-Yueh Tsai, Yi-Jui Liu, Field-gradient mapping and signal loss in echo planar imaging: a regional analysis, Proceedings of Organization of Human Brian Mapping, Honolulu, USA, 2015
3. Tzai-You Wu, Chun-Hao Fang, Yi-Ru Lin, Shang-Yueh Tsai, Investigating the reproducibility on the quantification of gamma-aminobutyric acid (GABA) in visual cortex, Proceedings of International Society for Magnetic Resonance in Medicine, Milan, Italy, 2014
期刊論文
1. (SCI) Shang-Yueh Tsai, Yi-Cheng Hsu, Ying-Hua Chu, Wen-Jui Kuo, Fa-Hsuan Lin*, Combining parallel detection of proton echo planar spectroscopic imaging (PEPSI) measurements with a data-consistency constraint improves SNR. NMR in Biomed. 2015 Dec;28(12):1678-1687
2. (SCI) David M. Niddam*1, Shang-Yueh Tsai1, Yi-Ru Lin. Statistical Mapping of Metabolites in the Medial Wall of the Brain: A Proton Echo Planar Spectroscopic Imaging Study. Human Brain Mapping. 2015 Mar;36(3):852-861. (1 David M. Niddam and Shang-Yueh Tsaicontributed equally to this work) 3. (SCI) Yu-Sheng Tseng, Teng-Yi Huang*, Shang-Yueh Tsai. Reducing signal loss of the parahippocampal
gyrus improves imaging of the default-mode network in 3.0 T MRI: The effect of susceptibility-induced field gradients. NMR in Biomed. 2015 Dec;28(12):1739-1746
國科會補助專題研究計畫項下出席國際學術會議心得報告
日期:104 年 6 月 23 日計畫編號
NSC 103 - 2420 - H - 004 - 003
- MY2
計畫名稱
利用靜態功能性磁振造影探討大腦活動造成之腦部區域代謝變化
出國人員
姓名
蔡尚岳
服務機構
及職稱
政治大學應用物理研究所 副教授
會議時間
104 年 6 月 14 日
至
104 年 6 月 18 日
會議地點
美國 夏威夷 檀香山
會議名稱
(中文) 大腦拓譜組織 2015 年年會
(英文) OHBM (Organization for Human Brain Mapping) 2015
發表論文
題目
(中文) 利用後處理方法消除磁共振頻譜影像之脂肪假影
(英文) Eliminate Lipid Artifacts in 1H Spectroscopic Imaging by
Post Processing
一、參加會議經過
大腦拓譜組織年會(OHBM)是專注在大腦功能研究的重要會議,許多先進的研究都會先在會議 中發表,後續也會有完整的期刊論文,發表於領域中高水準的期刊,每年參加人數均數千人。今 年會議在美國夏威夷檀香山會議中心進行,本人共有三篇文章發表。
會議於美國檀香山市的 Convention Center 舉行,議程共分五天進行,開始第一天主要是 educational courses,也有一個許多腦功能研究者交換意見和經驗的場合。後續四天內的 Scientific Meetings 總共 涵蓋不同主題的 oral presentations session。每天自早上八點開始一個小時的「Morning workshop」,針 對各領域邀請傑出研究專家學者演講與進行座談,探討各種不同的腦功能研究領域和方法,每天都已 不同主題同時進行,雖然涵蓋很基礎的部分但是也會有很深入的探討。晨間的 session 結束後接下來會 議當中安排了幾場特別的演講,上午下午各一場的(Keynote Lectures,請到領域中相當資深的研究人員 主講,內容涵蓋現今較先進之研究現況,今年有談到大腦連結性與精神疾病的研究,利用高磁場觀察 皮質在構造上及功能上的結構。中間則是安排了 Oral sessions 和 post sessions,內容涵蓋各種腦功能主 題。。
二、與會心得
本人今年主要關注,resting state fMRI 的技術和應用研究,以及 psychiatric disorder 方面的研究 進展,以及跟本人研究有較大相關性的振頻譜以及相關量化分析等議題(MRS of normal and fundamental physiology)。由於世界各地優秀研究人員均會參加,參與此會議最大的收益在於,於 休息時間,可以跟其他國家研究人員交換意見與討論的機會,尤其是有許多相關研究的研究者, 可以在同樣的領域內,討論如何繼續推動研究
三、發表論文全文或摘要
共計發表論文兩篇 僅附上論文摘要。四、建議
無五、攜回資料名稱及內容
在環保考量下,大會所有資料均電子化,可於該網站上下載查詢 。六、其他
無Eliminate Lipid Artifacts in
1
H
Spectroscopic Imaging by Post
Processing
Shin-Yu Lin1 , Yi-Ru Lin1 , Fa-Hsuan Lin4, Shang-Yueh Tsai2,3
1
Department of electronic and computer engineering, National Taiwan University of Science and Technology, Taipei, Taiwan, 2Graduate Institute of Applied Physics, National Chengchi University, Taipei, Taiwan. 3Reasearch Center for Mind, Brain and Learning, National Chengchi University, Taipei, Taiwan. 4Institue of Biomedical
Engineering, National Taiwan University, Taipei, Taiwan.
Introduction
Lipid contamination originating from Gibbs ringing of strong
subcutaneous lipid signal may complicate the quantification of
metabolites in Magnetic Resonance Spectroscopic Image (MRSI).
Suppression of lipid signal can be done during data acquisition either by
placing outer volume saturation bands surrounding the brain or by lipid
nulling with inversion recovery pulses at the cost of increased SAR.
Alternatively, lipid suppression can be implemented by post-processing
methods, such as extrapolating lipid signal to high k-space region to
reduce Fourier construction artifacts using Papoulis-Gerchberg (PG)
algorithm [1], and applying a spatial-spectral filtering technique based on
Signal Space Projection (SSP) method on the assumption that the spatial
patterns of noise (lipid) are uncorrelated with the spatial patterns of signal
(metabolites) [2]. Compared with lipid suppression during data
acquisition, the post processing methods are convenient and practical for
3d MRSI or at high field. In this study, we investigated the potential to
suppress lipid signal using only post-processing methods. The
performance of lipid suppression based on SSP, PG and combined SSP
and PG are examined using in vivo MRSI experiment at 3T.
Methods
MRSI data was acquired on a 3T Siemens MR system with a
32-channel head coil using Proton Echo Planar Spectroscopic Imaging
(PEPSI) sequence [3]. PEPSI data were acquired using following
parameters: matrix size = 32x32, FOV = 220mm, slice thickness= 15 mm,
TE=35 ms, TR=2000 ms, NEX =8). Two PEPSI data sets were acquired
with OVS and without OVS (NOVS), respectively. Standard post
processing strategies were performed for PEPSI as described in previous
works [3]. For lipid suppression by PG method, original MRSI K-space
resized to 128x128 using zero-filling. Lipid signal can be selected on the
spatial domain. Then we update the outer K-space using lipid signal
without changing inner 32x32 k-space. The procedures were iterated until
the difference of each iteration is less than 3x10⁻³ or iteration reach 100
times. For SSP, the MRSI data was expressed as a 2-dimentional
spatial-spectral matrix Dori with dimension of [Nx*Ny, Nf], where Nx *
Ny is the spatial matrix size, and Nf is the spectral vector size. A lipid
data matrix Dori-lipid with the dimension of [Nx*Ny Nlipid] can be
extracted. Singular Value Decomposition of Dori-lipid yields
spatio-spectral characterizations: Dori-lipid= U x S x V. The majority of
the lipid signal can be extracted by the first n-components of U, Un. Lipid
suppressed data (Dsup) can be obtained by multiplying Signal Space
Projection matrix ( I- Un x Un ) and Dori. Here the we used n=3. Lipid
suppressed MRSI data by PG, SSP and combined PG and SSP, were
quantified using LCModel [4]. The quality of spectra is evaluated by
Cramer-Rao Lower Bound (CRLB), which is the lowest bound of the
standard deviation of estimated metabolite concentration expressed in %.
Results and Conclusions
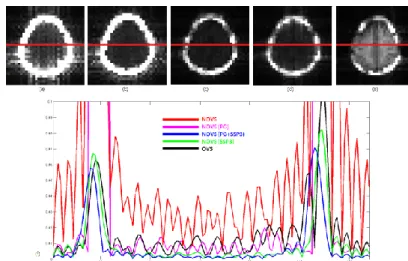
Our results indicate that post processing methods PG and SSP can
effectively lessen lipid comtamination (Figure 1). Both PG and SSP can
suppress the ringing of lipid signal inside the brain region and combined
PG and SSP can minimize lipid contaimation (Figure 1f). Quantification
of three major metabolites in brain shows that concentraions and fitting
relabiloty (CRLB) from NOVS with PG+SSP are close to those from
OVS (Table 1). Sucessful lipid suppresion can be also observed from
decreased quantiifed lipid concentrations and worse fitting (Table 1). In
summary, a combined of PG and SSP method can achieve similiar lipid
Reference
1. Haupt, C., et al., Removal of Lipid Atifacts in 1H Spectroscopic Imaging by Data Extrapolation. Magn Reson Med, 1996. 35: p. 678-87.
2. Tsai, SY., et al., Reduction of lipid contamination in MR spectroscopic imaging using Signal Space Projection ISMRM, 2007.
3. Tsai, SY., et al., Short- and long-term quantitation reproducibility of brain metabolites in the medial wall using proton echo planar spectroscopic imaging. Neuroimage. 2012 Nov;63(3); 1020-1029.
4.S.W.Provencher,"Estimation of metabolite concentrations from localized in vivo proton NMR spectra," Magnetic Resonance in Medicine, vol.30,pp.672-679,1993
supression perforamnce as OVS method. In conclusion we have
deonstrated that the post procesing methods can be applied to suppress
lipid signal and the perforemance can be comparable to routinely used
OVS mehtods, whcih is usually applied during data acquisition. The
proposed lipid sppresion methods can be suitable to be applied in 3D
MRSI or MRSI at high field.
Concentration
(I.U.) OVS NOVS
NOVS +PG+SSP3 NOVS +SSP3 NAA 12.67 15.41 12.42 12.57 tCre 9.33 9.97 10.11 10.27 tCho 2.32 2.81 2.49 2.56 Lip13 0.9 5.22 0.33 0.77 Lip09+13+20 1.09 7.43 0.46 1.12
CRLB (%) OVS NOVS NOVS +PG+SSP3 NOVS +SSP3 NAA 5.35 10.32 4.99 7.80 tCre 4.90 9.83 4.54 6.94 tCho 6.48 12.33 5.80 9.40 Lip13 33.01 14.66 28.66 23.54 Lip09+13+20 33.23 15.64 27.51 21.43
Table1. LCModel quantified concentrations and CRLB of
N-acetyl-l-aspartate (NAA), total creatine (tCre), total Choline (tCho) and lipid from 1.3 ppm (Lip13) and from 0.9, 1.3, 2.0 ppm (lip09+13+20). Results are from OVS data, NOVS data and NOVS data with PG and SSP method.
Fig. 1 Projection images of MRSI data of (a)NOVS (b) NOVS with PG (c) NOVS
with PG+SSP3 (d) NOVS with SSP3) (e) OVS. (f) Signal profile of each projection image along x-axis (red line)
Extraction of Default mode network
using independent component
analysis: Comparison between
individual and group analysis
Jia-Yang Wu , Chun-Hao Huang, Woan-Chyi Wang, Yi-Ru Lin, and Shang-Yueh Tsai
1
Department of electronic and computer engineering, National Taiwan University of Science and Technology, Taipei, Taiwan, 2Graduate Institute of Applied Physics, National Chengchi
University, Taipei, Taiwan. Reasearch Center for Mind, Brain and Learning, National Chengchi University, Taipei, Taiwan.
Introduction
Resting state functional magnetic resonance imaging (rsfMRI) has
been vigorously used to access resting state network. Among them,
default mode network (DMN) is most common network found in brain
1.
To extract the resting state network of interest, independent component
analysis (ICA) method has been used in many researches. Extraction of
the component corresponding to the network of interest by template
matching plays an important role in ICA. Previously, Greicius et al.
proposed “Goodness-of-fit” method based on calculation of intra subject
z-score
2. A potential limitation of this method is that z-score is not
we propose to do template matching using spatial correlation. In this way,
both intra subject comparison and inter subject comparison can be
feasible. Even it has been assumed that ICA performed in group level or
individual level may provide similar result, we apply proposed spatial
correlation method to examine if individual and group ICA could get
consistent results to those from goodness-of-fit score method.
Methods
Ten healthy subjects were scanned using a 3T Siemens MR system
with a 32-channel head coil. rsfMRI Data was collected using EPI
sequence with parameters: TR/TE= 2000/30 ms, slice thickness= 4 mm,
slice number= 31 and time points= 200. Regular pre-processing
procedures used by SPM8. We used GIFT Group ICA v2.0e software to
analyze the rsfMRI data
3. Signal was divided to 20 components, and each
component has its own time course and spatial map. For individual ICA
(iICA), ICA was performed in each subject. We used one sample t-test to
generate the spatial maps for group result. For group ICA (gICA), data
from all subjects were concatenated together and were analyzed after data
reduction using principle component analysis. Components for each
subject were then reconstructed using group components. Correlation
coefficient was calculated between spatial maps of twenty independent
components and the template of DMN. Component showing highest
correlation coefficient was chosen as default mode network.
Results and Discussion
For all subjects, we found that component chosen by correlation
method is the same as the component chosen by goodness-of-fit score
method. The correlation coefficients of DMN maps from iICA and gICA
were shown in Table 1. Overall, highest correlation coefficient was found
in group level gICA result. Lowest correlation coefficient was found in
subject level in for iICA. Comparing between these iICA and gICA,
DMN maps shows higher correlation coefficients in gICA than in iICA in
8 subjects. The spatial DMN maps of subject #1 from gICA and iICA
were shown in Figure 1a.The DMN maps in group level from iICA and
gICA were shown in Figure 1b. The DMN regions extracted by gICA are
more clustered than that extracted by iICA.
Conclusions
Our results indicate that correlation method can successfully extract
the component representing DMN and results are in agreement with
goodness-of-fit score method. Overall gICA provides higher correlation
Reference
1. Biswal B.etal, Functional connectivity in the motor cortex of resting human brain using echo-planar MRI. MRM 1995;34(4):537-541. 2. Greicius MD.etal, Resting-state functional connectivity in major depression: abnormally increased contributions from subgenual cingulate cortex and thalamus. Biological psychiatry 2007;62(5):429-437.
3. Calhoun VD.etal, A method for making group inferences from functional MRI data using independent component analysis. Human brain mapping 2001;14(3):140-151.
than iICA. This is reasonable because gICA merge all the data together
the analysis based on larger data samples can be more stable. Further, the
lower correlation coefficient in iICA may be attributed to the split of
DMN into two components. A possible solution is to combine
components with correlation coefficient over a threshold, such as 0.2. In
this way, iICA could have similar results as gICA. Even DMN maps
extracted in iICA can still have typical DMN pattern with correlation
coefficient as low as 0.279 (figure 1a), group level DMN maps from
gICA seems to be more clustered, which can be considered reliable
(figure 1b). In conclusion, correlation method is a suitable method to
select component from ICA. Compared with iICA, gICA could extract
component close to DMN template and is suggested for future
applications.
Figure1 (a) The best component for one subject using individual ICA (upper) and group ICA (lower). The correlation coefficients are 0.279 and 0.412 respectively.(b) The group result for all subjects using individual ICA (above) and group ICA (below).
![TraditionalMLCalgorithmsmainlytacklethebatchMLCproblem,wheretheinputdataarepresentedinabatch[24,28].Nevertheless,inmanyMLCapplicationssuchase-mailcategorization[22],multi-labelexamplesarriveasastream.Onlineanalysisistherefore dimensionreducermotivatedbyma](data:image/gif;base64,R0lGODlhAQABAIAAAP///wAAACH5BAEAAAAALAAAAAABAAEAAAICRAEAOw==)