摘 要
Cu2.9Mn0.1Al 合金 (Cu-25.0at% Al-2.5at% Mn ; Cu-12.4wt
% Al-2.5wt% Mn)在淬火狀態下的顯微組織為D03相+γ1΄ 麻 田散體。D03相是在淬火過程中經由β → B2 → D03兩階段連 續的有序-無序相變化形成,β→B2 以及B2→D03相變化過程 分別產生了a/4<111>以及a/2<100>反向晶界。淬火後的 Cu2.9Mn0.1Al合金經由 150℃ 到 750℃的時效其相變化順序為 (D03+γ1΄) → (D03+γ1΄+γ2) → (D03+β1΄+γ2) →(B2+β1΄+ γ2) → β相,其中β1΄(18R)麻田散體的形成是因為γ2析出造成基 地成分的改變以及內應力升高的緣故。 比較過去的研究,在不施加外力的情況下,β1΄(18R)麻 田散體由γ1΄(2H)麻田散體轉變而來,是第一次在Cu-Al-Mn合 金中被發現。當時效溫度升到 400℃的時候我們可以看到 γ-brass析出物經長時間時效由圓形變成長條形。另外,當時 效溫度升到 550℃的時候經長時間時效,可以看到γ-brass析 出物量增加的情況下,β1΄麻田散體量相對減少了。值得一提 的是,在x=0.1 的Cu3-xMnxAl 合金中不會有L-J相存在,此 與之前在x≧0.2 的Cu3-xMnxAl合金中所觀察到的不同。
Abstract
The as-quenched microstructure of the Cu2.9Mn0.1Al alloy
(Cu-25.0at% Al-2.5at% Mn ; Cu-12.4wt% Al-2.5wt% Mn)was a mixture of ( D03+γ1΄(2H)martensite ). The D03 phase was
formed by the β → B2 → D03 continuous two-stage order-
disorder transition during quenching. The β→B2 and B2→D03
transitions produced a/4<111> and a/2<100> APBs, respectively. When the as-quenched Cu2.9Mn0.1Al alloy was aged at
temperatures ranging from 150℃ to 750℃,the phase transition sequence was found to be (D03+γ1΄) → (D03+γ1΄+γ2) → (D03
+β1΄+γ2) →(B2+β1΄+γ2) → β where the β1΄(18R) martensite
was transformed due to the chemical composition change and increase of internal stress by γ2 precipitation.
Compared with previous studies, it is found that the β1΄
martensite resulting from γ1΄ martensite without applied stress is
as-quenched alloy was aged at 400℃, the original spherical γ-brass precipitate would change to plate-like. Moreover, the amount of γ-brass precipitate was increased and that of β1΄
martensite was decreased during prolonged aging at 550℃. Finally, it is worthwhile to note that no L-J phase was observed in the present alloy (x=0.1 in Cu3-xMnxAl alloys). This is quite
different with that observed by previous workers in the Cu3-xMnxAl alloys with x≧0.2.
Contents
Abstract (Chinese)……….…..………1 Abstract (English)……….….……….……….2 Contents...…....4 List of Tables…………....…....……….……..5 List of Figures…………....…....……….……6 Introduction……….9 Experimental Procedure……….……12Results and Discussion….…………...………..15
Conclusions………...22
References………...24 .
List of Tables
Table 1 Chemical compositions of the phases revealed by and
List of Figures
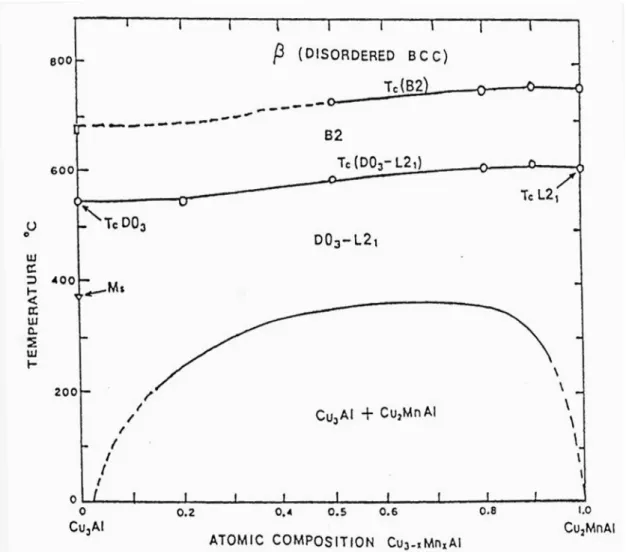
Fig. 1 A schematic drawing of the ordering temperatures Tc(B2) and Tc(D03+L21) and the miscibility gap of the
Cu3-xMnxAl alloy established by M. Bouchard and G.
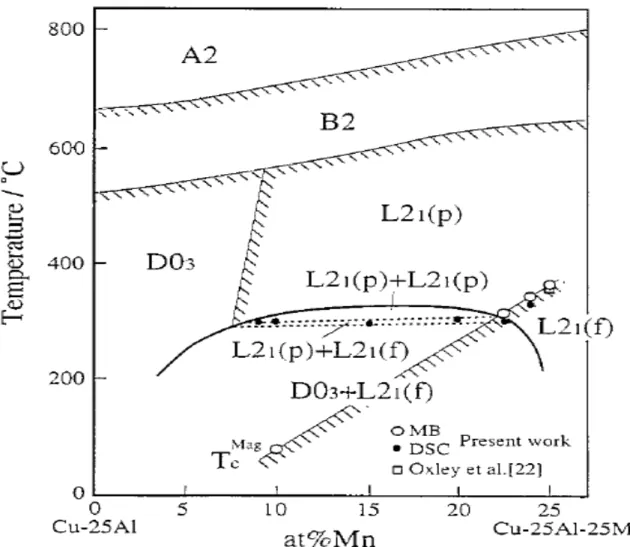
Thomas………28 Fig. 2 A phase diagram of the Cu3-xMnxAl alloy established by
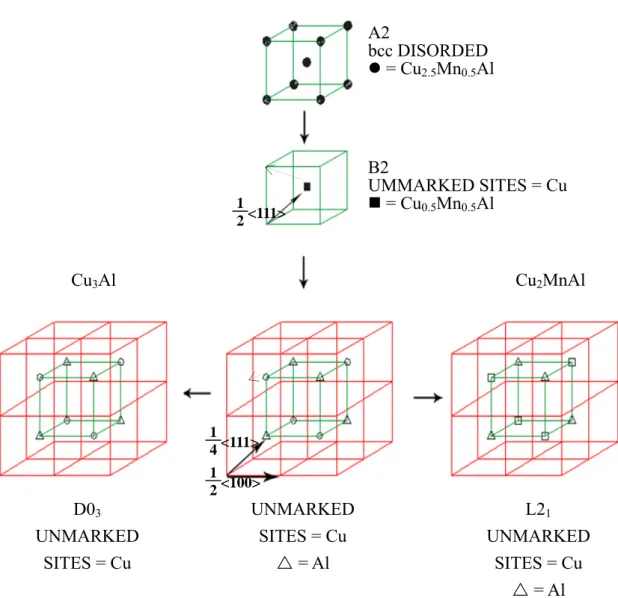
R. Kainuma, N. Satoh, X.J. Liu, I. Ohunuma and K. Ishida………...29 Fig. 3 Schematic representation of the ordering sequence of
the quenched Cu2.5Mn0.5Al alloy (vertically) and its
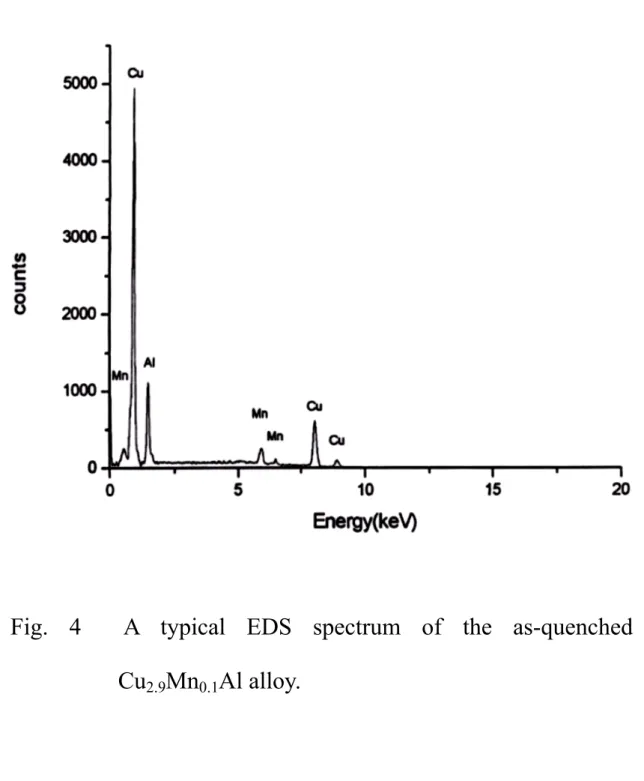
isothermal decomposition (horizontally)………30 Fig. 4 A typical EDS spectrum of the as-quenched Cu2.9Mn0.1Al
alloy………31 Fig. 5 (a) Optical micrograph. (b)-(g) Electron micrographs of
the as-quenched Cu2.9Mn0.1Al alloy: (b) BF, (c) and (d)
two SADPs. The zone axes of the D03 phase, γ1΄
[101], (c) [011], [111] and [100], respectively. (hkl=D03
phase, hkl=γ1΄ martensite, hklT= internal twin). (d) and (e)
(111) and (200) D03 DF, respectively. (g) (12 1) γ1΄
DF...………..…...32 Fig. 6 (a) Optical micrograph. (b)-(c) Electron micrographs of
Cu2.9Mn0.1Al alloy aged at 150℃ for 100 hours. (b) BF
(c) (111) D03 DF.………...36
Fig. 7 (a)-(b) Optical micrographs of the Cu2.9Mn0.1Al alloy
aged at 400℃ for (a) 1 hour and (b) 100 hours, respectively. (c)-(i) Electron micrographs of the Cu2.9Mn0.1Al alloy aged at 400℃ for 100 hours. (c)BF,
(d)-(e) two SADPs taken from the precipitates marked as “R” in (c). The zone axes of the γ2 phase are (d) [001]
and (e)[011], respectively. (f)-(h) three SADPs taken from an area marked as “M” in (c). The zone axes of the β1΄ martensite are (f) [010], (g) [230] and (h) [292],
respectively. (i) (100) γ2 DF………...………38
550℃ for (a) 1 hour and (b) 100 hours, respectively. (c)-(d) Electron micrographs: (c) BF, (d) a SADP of the β1΄ martensite. The zone axis is [010]...…………...…..43
Fig. 9 (a) Optical micrograph. (b)-(d) Electron micrographs of the Cu2.9Mn0.1Al alloy aged at 750℃ for 2 hours: (b) BF,
(c) and (d) (111) and (200) D03 DF, respectively……..45
Fig. 10 A phase diagram containing metastable martensite phases in Cu-Al binary alloy system………….……47 Fig. 11 A diagram of types of martensite with factors of temp-
Introduction
Phase transformations in Cu3-xMnxAl alloys have been
extensively studied by many researchers before[1-6]. Based on those studies, the Cu3-xMnxAl phase diagram with 0.2≦X≦1
was established by M. Bouchard et al. and R. Kainuma et al., respectively. These phase diagrams are shown in Figure 1 and 2. According to their phase diagrams, it is seen that when the Cu3-xMnxAl alloy with 0.2≦X≦1 was solution heat-treated in
single β phase (A2; disordered bcc) region and then quenched rapidly, a β→B2→D03+L21would occur through an order-
disorder transition and a spinodal decomposition[1,2]. It means that the as-quenched microstructure of the Cu3-xMnxAl alloy
with 0.2≦X≦1 was a mixture of (D03+L21) phases. While the
as-quenched microstructure of the Cu3-xMnxAl alloy with x=1
became a single L21 phase. The L21 phase was formed through a
β→B2→L21 transition during quenching. The L21 structure is
very similar to the D03 structure. The only difference between
specific lattice site with eight nearest copper atoms in the D03
structure so as to form a stoichiometric composition of Cu2MnAl[3], as shown in Figure 3[1].
When the as-quenched Cu3-xMnxAl alloys were aged at 700
℃ or below for different times, α-Mn, β-Mn, T3-Cu3Mn2Al and
γ2-Cu9Al4 would be formed within the matrix [2,5-11,29]. The
α-Mn has a cubic structure with lattice parameter a=0.891nm [29]. The β-Mn has an A13(simple cubic)structure with lattice parameter a=0.641nm. The T3 phase has a C15 structure
(ordered fcc) with lattice parameter a=0.691nm. The γ-brass has a D83 (ordered complex body-centered cubic) structure with
lattice parameter a=0.872 nm[12-15]. The orientation relationship between the γ-brass and the matrix is cubic to cubic[16,17].
To date, most of the studies are focused on the Cu3-xMnxAl
alloy with 0.2≦X≦1. Little information concerning the phase transformation in the Cu3-xMnxAl alloy with X<0.2 has been
provided. Therefore, the purpose of the present study is to examine the phase transformation of the Cu2.9Mn0.1Al alloy by
using transmission electron microscopy and energy dispersive X-ray spectrometer analyses (EDS).
Experimental Procedure
(A) Alloy Preparation
The Cu2.9Mn0.1Al alloy was prepared by melting the elements
as 99.99 pct. copper, 99.99 pct. aluminum and 99.99 pct. manganese together in an induction furnace. The melt was chill cast into a 30 × 50 × 200-mm copper mold and subsequently homogenized at 910℃ for 72 hours under a protective argon atmosphere. After homogenization, the ingot was cut and then hot-rolled to a thickness about 2.0 mm. Finally, the specimens were solution heat-treated at 910℃ for 1 hour and rapidly quenched into iced brine (NaCl). The aging processes were performed at the temperatures ranging from 100℃ to 750℃ in a vacuum furnace and then also quenched into iced brine rapidly .
(B) Transmission Electron Microscopy (TEM)
The electron microscopic specimen was first mechanically grinded and polished into thin foil and then chemically polished by means of a double jet electro-polisher with the
electrolyte of 70% methanol and 30% nitric acid. The polishing temperature was kept in the range from -30℃ to -20℃ and the current density was kept in the range from 3.0 ×10⁴ to 4.0 ×10⁴ A/m2. Electron microscopy observations were carried out by a JEOL-2000FX scanning transmission electron microscope (STEM) operating at 200kV. This microscope was equipped with a Link ISIS 300 energy-dispersive X-ray spectrometer (EDS) for chemical analysis. Quantitative analyses of elemental concentrations for Cu, Al and Mn were made with the aid of a Cliff-Lorimer ratio Thin Section method.
(C) Optical Microscopy (OM) / Scanning Electron Microscopy
(SEM)
The preparations of OM and SEM specimens are as the following procedures: Firstly, the surface of the sample sheets was modified by mechanical grinding and polishing. Secondly, the surface-modified sheets were etched in the solution of 80% methanol and 20% nitric acid until the
appearance of grain boundaries. Thirdly, while the etching process is finished washing the surface of the sheets right away in quantities of flowing water. Finally, drying up the sheets with nonfat cotton and then heating them.
Results and Discussion
Figure 4 is a typical EDS spectrum of the alloy in the as-quenched condition. The quantitative analysis of Energy Dispersive Spectrometer(EDS) indicated that the composition was Cu-2.5wt%Mn-12.4wt%Al ( Cu-2.5at%Mn-25.0at%Al ). Figure 5 (a) is an optical micrograph of the as-quenched alloy revealing that a high density of plate-like phase was formed within the matrix. Figure 5 (b) is a bright-field(BF) electron micrograph of the as-quenched alloy indicating the presence of the plate-like phase. Figures 5(c) and 5(d) are two selected-area diffraction patterns (SADPs) taken from a plate-like phase and its surrounding matrix. In these SADPs, it is seen that besides the reflection spots corresponding to D03 phase, some extra
spots could be detected owing to the presence of the plate-like phase. Compared with previous studies[18-21], it is found that the extra spots could be indexed as γ1΄ martensite with internal
twins. The γ1΄ martensite has an orthorhombic structure with
lattice parameters a = 0.455 nm, b = 0.502 nm and c = 0.429 nm[22]. Figure 5(e) is a (111) D03 dark- field (DF) electron
micrograph of the as-quenched alloy clearly showing the presence of the fine D03 domains with a/2<100> anti-phase
boundaries (APBs). Figure 5(f) is a (200) D03 DF electron
micrograph revealing the presence of the small B2 domains with a/4<111> APBs. Since, the sizes of both D03 and B2 domains
are very small. Consequently, it is deduced that the D03 phase in
the as-quenched alloy was formed by a β→B2→D03 continuous
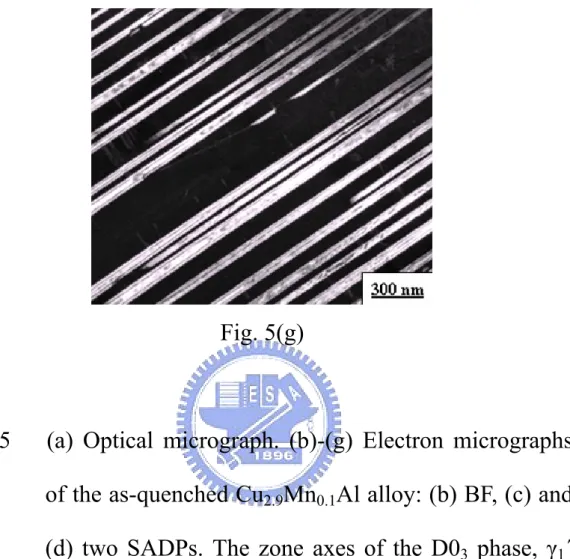
ordering transition during quenching[1-2]. Figure 5(g) is a (121) γ1΄ DF electron micrograph, clearly showing the presence of the
plate-like γ1΄ martenstie. Based on above observations, it is
concluded that the as-quenched microstructure of the Cu2.9Mn0.1Al alloy is a mixture of (D03 + γ1΄ martenstie), where
the D03 phase was formed by a β→B2→D03 continuous
ordering transition during quenching.
Figures 6(a) and 6(b) are an optical micrograph and a BF electron micrograph of the Cu2.9Mn0.1Al alloy aged at 150℃ for
100 hours and then quenched, respectively. Obviously, the morphology is similar to that observed in Figures 4(a) and 4(b). Moreover, electron diffraction demonstrated that the micro-
structure of the Cu2.9Mn0.1Al alloy aged at 150℃ for 100 hours
was still the mixture of (D03 + γ1΄ martenstie). Figure 6(c) is a
(111) D03 DF revealing that the size of D03 domains grew
considerably during aging. It means that the microstructure of the matrix at 150℃ was D03 phase.
Figure 7(a) is an optical micrograph of the Cu2.9Mn0.1Al
alloy aged at 400℃ for 1 hour and then quenched. In this figure, it is clear that a high density of fine precipitates was observed within the matrix or on the grain boundaries and no evidence of the γ1΄ martensite could be detected. Figure 7(b) is an optical
micrograph of the alloy aged at 400℃ for 100 hours. Evidently, some plate-like precipitate started to appear within the matrix. Figure 7(c) is a BF electron micrograph of the alloy aged at 400 ℃ for 100 hours. Figures 7(d) and 7(e) are two SADPs taken from the e precipitate marked as “R” in Figure 7(c). According to the camera length and the measurements of angles as well as d-spacings of the diffraction spots, the crystal structure of the precipitate was determined to be an ordered body-centered cubic structure with lattice parameter a = 0.872 nm, which is
consistent with that of the γ2 phase[1,8,23]. Figure 7(f) through
7(h) are three SADPs taken from an area marked as “M” in Figure 7(c). When compared with previous studies in Cu-based shape memory alloys[24-27], it is found that the positions and streak behaviors of the reflection spots are the same as those of the β1΄ martensite. The β1΄ martensite has a monoclinic structure
with lattice parameters a = 0.446 nm, b = 0.529 nm, c = 3.838 nm and β = 89.4°, respectively[24]. Figure 7(i) is a (001) γ2 DF
electron micrograph, indicating the presence of the γ2
precipitate.
Figures 8(a) and 8(b) are two optical micrographs of the Cu2.9Mn0.1Al alloy aged at 550℃ for 1 hour and 100 hours,
respectively. Compared with these two micrographs, it is found that with increasing the aging time, the amount of γ-brass precipitate increased but that of the β1΄ martensite decreased.
Figure 8(c) is a BF electron micrograph of Figure 8(b). Figure 8(d) is a SADP of the β1΄ martensite. The zone axis is [010]. It is
worthwhile to note that the streak behaviors become weaker. Figure 9(a) is an optical micrograph of the Cu2.9Mn0.1Al
alloy aged at 750℃ for 2 hours revealing that the micro- structure is similar to that observed in the as-quenched alloy. Figure 9(b) is a BF electron micrograph, showing the existence of the plate-like γ1΄ martensite. Figure 9(c) is a (111) D03 DF
electron micrograph of the same area as Figure 9(b), revealing the presence of the D03 domains with a/2<100> APBs. Figure
9(d) is a (200) D03 DF electron micrograph of the same area as
Figure 9(b), revealing the presence of the B2 domains with a/4<111> APBs. This result indicates that the microstructure existing at 750℃ or above is a single disordered β phase.
Based on the above experimental results, it is concluded that with increasing the aging temperature from 100℃ to 750℃, the phase transition sequence in the present alloy is (D03 + γ1΄) →
(D03 + γ2 + γ1΄) → (D03 + γ2 + β1΄) → (B2 + γ2 + β1΄) →
single β . The first transition occurs between 150℃ and 250℃, the second between 250℃ and 400℃, the third between 560℃ and 650℃ and the fourth between 650℃ and 750℃, respec- tively.
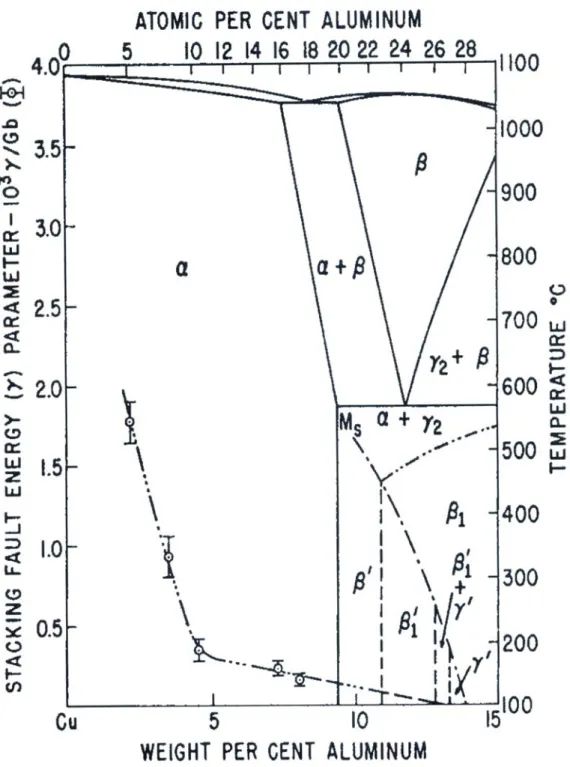
precipitation was noted, which is consistent with the existing phase diagram of Cu-Al binary alloys shown in Figure 10. The γ2 precipitate is an aluminum-rich phase(Cu-16.0wt%Al-
1.9wt%Mn[7]) compared with the present alloy. Thus, the formation of γ2 precipitate cause a decrease of aluminum content
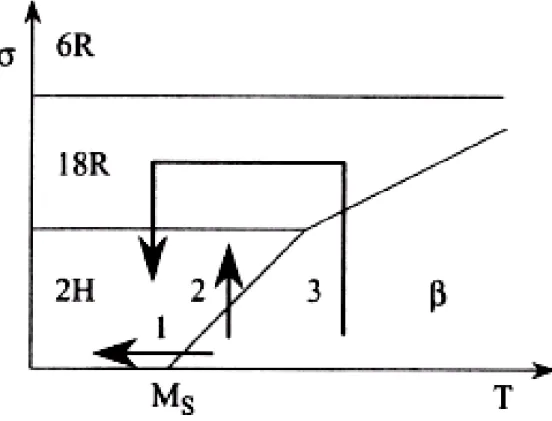
and an increase of manganese content in the matrix. The com- position change of this study during aging is shown in Table 1. It is seen that the change of manganese content is a little. Thus, the change of manganese content can be neglected. According to the change of aluminum content of the present alloy, it is reasonable that the martensite type is changed from γ1΄ to β1΄. Figure 11 is a
diagram of types of martensite with factors of temperature and stress. It is seen that higher stress lead to 18R(β1΄) martensite.
Based on above discussion, it is suggested that the change of martensite type from γ1΄ to β1΄ in the present study is due to the
chemical composition change and increase of internal stress by γ2 precipitation.
Finally, it is worthwhile to note that no L-J phase could be observed in the Cu2.9Mn0.1Al alloy. According to previous
studies on the as-quenched microstructure of Cu3-xMnxAl alloys
with x≧0.2[18], it is found that the L-J phase was always observed. This result suggest that since the L-J phase is a
manganese-rich phase ( Cu-17.52at%Al- 15.3at%Mn ) [23], the manganese content in the present alloy was too low to observe the presence of the L-J phase.
Conclusions
(1) Phase transformations in the Cu2.9Mn0.1Al alloy have been
examined by using transmission electron microscopy. In the as-quenched condition, the microstructure of the
Cu2.9Mn0.1Al alloy was a mixture of (D03+γ1΄ martensite).
The D03 phase was formed through the β → B2 → D03
ordering transition during quenching.
(2) When the as-quenched Cu2.9Mn0.1Al alloy was aged at temp-
eratures ranging from 150℃ to 750℃, the phase transition sequence was formed to be (D03 + γ1΄) → (D03 + γ2 + γ1΄)
→ (D03 + γ2 + β1΄) → (B2 + γ2 + β1΄) → β . The first
transition occurs between 150℃ and 250℃, the second between 250℃ and 400℃, the third between 560℃ and 650℃ and the fourth between 650℃ and 750℃, respec- tively.
(3) It is suggested that the change of martensite type from γ1΄ to
β1΄ in the present study is due to the chemical composition
change and increase of internal stress by γ2 precipitation.
References
[1]M. Bouchard and G. Thomas : Acta Metall., Vol. 23, pp.1485-1500 (1975).
[2]R. Kainuma, N. Satoh, X.J. Liu, I. Ohunuma and K. Ishida : J. Alloys and Compounds, 266 ,pp.191-200 (1998).
[3]Ye.G. Nesterenko and I.A. Osipenko: Fiz. Metal. Metalloved., 36, 1212(1973).
[4]S. C. Jeng and T. F. Liu: Metallurgical and Materials Transactions A, Vol.26A, pp.1353-1365(1995).
[5]D. R. F. West and D. Lloyd Thomas: Journal of the Institute of Metals Vol.85 pp.97-104(1956)
[6]J. Soltys, M. Stefaniak and J. Holender: Philosophical Magazines B, Vol.49, No.2 pp.151-158(1984)
[7]J. Dutkiewicz, J. Pons and E. Cesari: Materials Science and Engineering A158 pp.119-128(1992)
[8]J. Miettinen: Calphad, Vol.27, No.1, pp.103-114(2003)
[9]M. O. Prado and A. Tolley: Materials Science and Engineer- ing A273-275 pp.590-594(1999)
[11]Eduard Obradó, Carlos Frontera, Lluís Mañosa and Antoni Planes: Physical Review B, Vol.58, No.21, pp.14245-14255 (1998)
[12]J. I. Pérez-Landazábal, V. Recarte and V. Sánchez-Alarcos: J. Phys.: Condens. Matter 17, pp.4223-4236(2005)
[13]X. J. Liu, I. Ohnuma, R. Kainuma and K. Ishida: Journal of Alloys and Compounds 264, pp.201-208(1998)
[14]M. A. Dvorack, N. Kuwano, S. Polat, H. Chen and C. M. Wayman: Scripta Metall., Vol.17, pp.1333-1336(1983)
[15]J. Singh, H. Chen and C. M. Wayman: Scripta Metall., Vol.19, pp.887-890(1985)
[16]R. Kozubski and J. Soltys: Journal of Materials Science , 18, 1689(1983)
[17]J. Pons, E. Cesari: Materials Structure, Vol.6, No.2, pp.115- 119(1999)
[18]S. Y. Yang and T. F. Liu: Materials Chemistry and Physics, 98, pp.389-394(2006)
[19]C. H. Chen and T. F. Liu: Materials Chemistry and Physics, 78, pp.464-473(2002)
[20]C. H. Chen, C. C. Yang and T. F. Liu: Materials Science and Engineering A354, pp.377-386(2003)
[21]C. H. Chen and T. F. Liu: Scripta Materialia, Vol.47, pp.515 -520(2002)
[22]I. R. Bubley, Yu. N. Koval, P. V. Titov: Scripta Materialia, Vol.41, No.6, pp.637-641(1999)
[23]S. Y. Yang and T. F. Liu: Scripta Materialia, 54, pp.931-935 (2006)
[24]Renhui Wang, Jianian Gui, Xiaomei Chen, Shusong Tan: Acta Materialia, 50, pp.1835-1847(2002)
[25]H. Y. Peng, Y. D. Yu and D. X. Li: Acta Materialia, Vol.45, No.12, pp.5153-5161(1997)
[26]D. Shi, J. Gui, S.S. Tan, R. Wang: Materials Science and Engineering B56, pp.31-36(1998)
[27]Y. J. Bai, X. G. Xu, Y. X. Liu, L. M. Xiao, G. L. Geng: Materials Science and Engineering A334, pp.49-52(2002)
[28]J. van Humbeeck et al.: Trans. JIM 28, 383(1987)
[29]W. Williams, Jr. and J. L. Stanford: Journal of Magnetism and Magnetic Materials 1 pp.271-285(1976)
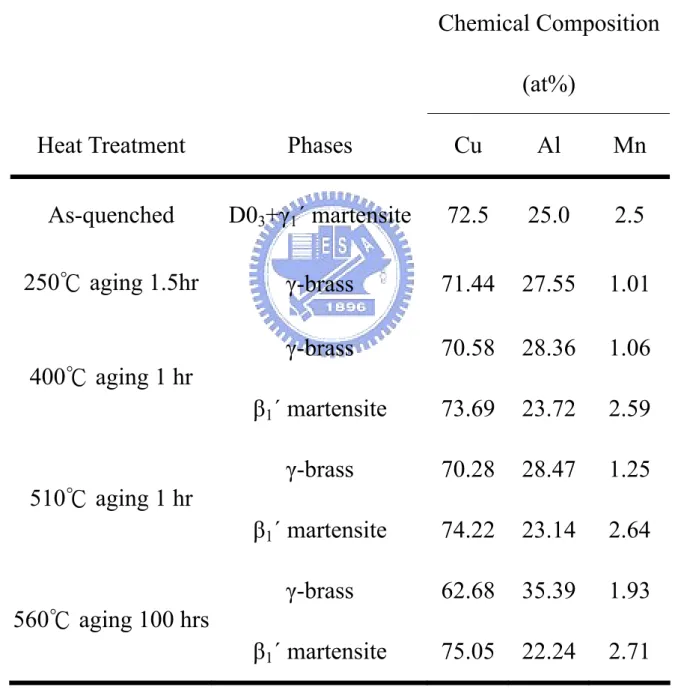
Table 1 Chemical compositions of the phases revealed by and Energy Dispersive Spectrometer(EDS)
Chemical Composition (at%)
Heat Treatment Phases Cu Al Mn
As-quenched D03+γ1΄ martensite 72.5 25.0 2.5 250℃ aging 1.5hr γ-brass 71.44 27.55 1.01 400℃ aging 1 hr γ-brass β1΄ martensite 70.58 73.69 28.36 23.72 1.06 2.59 510℃ aging 1 hr γ-brass β1΄ martensite 70.28 74.22 28.47 23.14 1.25 2.64 560℃ aging 100 hrs γ-brass β1΄ martensite 62.68 75.05 35.39 22.24 1.93 2.71
Fig. 1 A schematic drawing of the ordering temperatures Tc(B2) and Tc(D03+L21) and the miscibility gap of
the Cu3-xMnxAl alloy established by M. Bouchard and
Fig. 2 A phase diagram established by R. Kainuma, N. Satoh, X.J. Liu, I. Ohunuma and K. Ishida.
A2 bcc DISORDED z = Cu2.5Mn0.5Al B2 UMMARKED SITES = Cu = Cu0.5Mn0.5Al 1 2 <111> Cu2MnAl Cu3Al 1 4 <111> 1 2 <100> UNMARKED SITES = Cu U = Al L21 UNMARKED SITES = Cu U = Al D03 UNMARKED SITES = Cu
Fig. 3 Schematic representation of the ordering sequence of the quenched Cu2.5Mn0.5Al alloy (vertically) and its
Fig. 4 A typical EDS spectrum of the as-quenched Cu2.9Mn0.1Al alloy.
Fig. 5(a)
Fig. 5(c)
Fig. 5(e)
Fig. 5(g)
Fig. 5 (a) Optical micrograph. (b)-(g) Electron micrographs of the as-quenched Cu2.9Mn0.1Al alloy: (b) BF, (c) and
(d) two SADPs. The zone axes of the D03 phase, γ1΄
martensite and internal twin are (b) [001], [101] and [101], (c) [011], [11 1] and [100], respectively. (hkl=D03 phase, hkl=γ1΄ martensite, hklT= internal
twin). (d) and (e) (111) and (200) D03 DF, respectively.
Fig. 6 (a)
Fig. 6 (c)
Fig. 6 (a) Optical micrograph. (b)-(c) Electron micrographs of Cu2.9Mn0.1Al alloy aged at 150℃ for 100 hours.
Fig. 7 (a)
Fig. 7 (c)
Fig. 7 (e)
Fig. 7 (g)
Fig. 7 (i)
Fig. 7 (a)-(b) Optical micrographs of the Cu2.9Mn0.1Al alloy
aged at 400℃ for (a) 1 hour and (b) 100 hours, res- pectively. (c)-(i) Electron micrographs of the Cu2.9Mn0.1Al alloy aged at 400℃ for 100 hours (c)BF,
(d)-(e) two SADPs taken from the precipitate marked as “R” in (c). The zone axes of the γ2 phase are (d)
[001] and (e)[011], respectively. (f)-(h) three SADPs taken from an area marked as “M” in (c). The zone axes of the β1΄ martensite are (f) [010], (g) [230] and
Fig. 8 (a)
Fig. 8 (c)
Fig. 8 (d)
Fig. 8 (a)-(b) Optical micrographs of the Cu2.9Mn0.1Al alloy
aged at 550℃ for (a) 1 hour and (b) 100 hours, res- pectively. (c)-(d) Electron micrographs: (c) BF, (d) a SADP of the β1΄ martensite. The zone axis is [010].
Fig. 9 (a)
Fig. 9 (c)
Fig. 9 (d)
Fig. 9 (a) Optical micrograph, (b)-(d) electron micrographs of the Cu2.9Mn0.1Al alloy aged at 750℃ for 2 hours:
(b) BF, (c) and (d) (111) and (200) D03 DF,
Fig. 10 A phase diagram containing metastable martensite phases in Cu-Al binary alloy system
Fig. 11 A diagram of types of martensite with factors of temperature and stress