(Received September 2, 1998) (Accepted in revised form April 15, 1999)
Keywords: Kinetic; Phase transformation; Zn-4A1-3Cu Alloy
1. Introduction
Alloys of Zn-Al containing small amounts of Cu have been of increasing interest as engineering materials over the past decade. The addition of Cu into Zn-Al alloys leads to a dimensional expansion, which occurs during aging at ambient or slightly elevated temperatures. This is due to the complicated phase transformation of the Zn-Al-Cu alloy during aging. A conventional heat treatment may be used to accelerate this expansion before manufacture of components such as automobile parts, handles and body hardware. In order to improve the dimensional stability of this material, a suitable heat treatment must be developed and details of the phase transformation must be established. Precipitation in the ternary Zn-Al-Cu alloy system has been the subject of many investigations Zn alloys with high Al content (1⬃5). In hypereutectic Zn-Al-Cu alloy (Al ⬎ 5 wt%), the⑀ phase (CuZn4, h.c.p. structure, a⫽ 2.74 Å, c⫽ 4.28Å) (6) coexists with the Al-rich phase above the eutectoid temperature of 276°C(3). The⑀ phase will be replaced gradually by a stable T⬘ phase in the long term aging process below 268°C p (4,5). The T⬘ phase, whose composition is 12.7% Zn-31.6% Al-55.7% Cu (3,5), has a rhombohedral structure (Al4Cu3Zn, a⫽ 8.68Å,␣ ⫽ 27.4 ⫽°) and is a superlattice based on CsCl-type cell (7). In a cast-aged Zn-4Al-3Cu alloy, it is found that two kinds of precipitates, ␣ and ⑀, dominated the aging process. The precipitation of⑀ phase produces 0.15% dimensional expansion during the second stage of aging (8). Most of the current literature is concentrated on the heat treatment of high Al content Zn-Al-Cu alloys. Little study on the kinetics of the transformation of low Al Zn-Al-Cu alloys have been undertaken. In this study, the aging behavior and kinetics of a Zn-4Al-3Cu alloy is investigated.
2. Materials and Experimental Procedure
The alloy was melted in vacuum and poured at 450°C into a preheat permanent mold. The ingot was stored at room temperature in excess of six months before heat-treatment. The specimens were cut from the ingot and heat-treated at 240°C for 1 hour in an inert gas atmosphere and then quenched in water. The aging process was carried out in an oil-bath at various temperatures (50, 95,120 and 150°C) after quenching.
The dimensional change was measured by Du Pont 943 Thermomechanical Analyzer. Microhard-ness measurements were conducted using a microhardMicrohard-ness tester equipped with a Vicker’s diamond pyramid indenter. Thin film specimens for transmission electron microscopy (TEM) were prepared by means of a double-jet electropolisher using an electrolyte made up from 30 ml of perchloric acid, 250 ml of 2-butoxyethanel and 700 ml of ethanol. The polishing temperature was kept between⫺15°C and
⫺25°C, with a current density in the range of 0.3–0.7 A/cm2. TEM was performed on a JOEL-2000FX scanning transmission electron microscope operating at 200 kV.
3. Results and Discussion
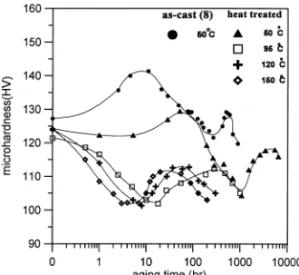
Figure 1 shows the variation of microhardness as a function of aging time for this heat-treated alloy aged at various temperatures. It can be seen that the microhardness of the heat-treated alloy is lower than that for as-cast Zn-4Al-3Cu alloy (8) during 50°C aging. Furthermore, the time reaching to two peaks of microhardness for the heat-treated alloy are longer than that for as-cast alloy. In the as-cast alloy, the first peak of microhardness is contributed by the precipitation of␣ phase, and the second peak is contributed by the precipitation of⑀ phase. (8) The dimensional change for the heat-treated alloy aged at 150°C is shown in Fig. 2. It exhibited gradual shrinkage at the early stage of aging and then expanded until achieving stability. This dimensional expansion is approximately 0.05%, which is lower than that of the as-cast Zn-4Al-3Cu alloy (0.15%). The above observations suggest that a phase other than ⑀ phase (8) has precipitated during the second stage of aging.
Figure 3(a) shows a TEM micrograph, recorded from the specimen aged at 95°C for 670 hours. In addition to the ␣ phase, which had precipitated out during the first stage of aging, another phase of round-shape and 0.3m diameter was observed near the tip of ␣ phase. The accompanying SADPs in Fig. 3 (b) and (c) have identified the phase to be T⬘, of rhombohedral structure having a ⫽ 8.7 Å,␣ ⫽ 27°C. The orientation relationship between the T⬘ phase and matrix was further determined as [1120]//[111]T⬘, (1101)//(110)T⬘. Therefore, it is concluded that␣ phase is the precipitates during the
first stage of aging, as reported previously (8), whereas T⬘ phase is formed during the second stage of aging. The formation of ␣ phase involves dimensional shrinkage during the first stage of aging. According to the Eshelby’s model (9), dimensional shrinkage produces a high stress concentration region in the matrix around the tip of a rod precipitate. As a result, it is favorable for the precipitation of T⬘ phase in order to release the stress in the matrix. Furthermore, the formation of T⬘ phase suffers Figure 1. Microhardness variation as a function of aging time, showing two precipitation hardening in the aging process.
a 0.05% dimensional expansion of the quench-aged Zn-4Al-3Cu alloy. The amount of expansion is only 1/3 of that for the formation of⑀ phase in the cast-aged alloy.
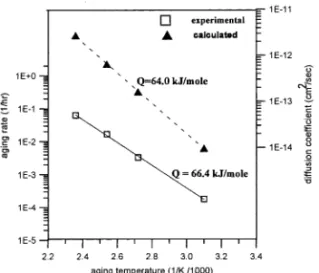
The activation energy for precipitation of T⬘ phase can be calculated from 1/t vs. 1/T plot, t and T being the time needed for the occurrence of the second hardening peak and absolute temperature, respectively. According to Arrhenius equation, the rate of transformation is proportional to exp(-Q/RT). The slope of the straight line in Fig. 4 is the activation energy for the formation of T⬘ phase. The activation energy for the formation of T⬘ phase has been evaluated to be 66.4 kJ/mole, which is lower
Figure 2. The dimensional change of the heat-treated alloy aged at 150°C.
Figure 3. (a) Electron micrography of a thin foil in the specimen quenched from 240°C and aged at 95°C for 670 hours, showing T⬘ phase is precipitated in the matrix (b) SADP of [1120] zone of matrix (c) SADP from [0111] zone of matrix.
than that for the self-diffusion of zinc (91.1 kJ/mole)(10). It is postulated that the lower activation energy is associated with a high-diffusion path, which is believed to be the␣/ interface in the matrix. In a diffusion controlled precipitation process, the apparent diffusion coefficient can be expressed as
Dapp⫽ D1⫹ (Ab/ A1) 䡠 Db (1)
where Dlis the lattice diffusion coefficient, Dbis the grain boundary diffusion coefficient, Aland Ab are the cross-section areas of lattice diffusion and interface diffusion respectively. Assuming a hexagonal close-packed arrangement of the␣ rods of diameter d and inter-rod distance exits in the matrix, as shown in Fig. 5,
Ab⫽[(d/2 ⫹ ␦) 2⫺ (d/2)2 ]⬇d␦ (2) A⫽ Ab⫹ A1⫽ 公 3 2 (3) When ⬎⬎ d, then Al⬇ A, where A is the total diffusion areas including boundary and lattice diffusion. The apparent diffusion coefficient becomes Dapp⫽ D1⫹ ( d ␦/公3 2)䡠 Db, where␦ is the effective thickness of the interface region. Let Dl⫽ 91.1 kJ/mole, Db⫽ 61 kJ/mole (11), d ⫽ 5 䡠10⫺6cm,␦ ⫽ 5 䡠10⫺8 cm (11), ⫽ 5 䡠10⫺5 cm, the results of calculation are plotted in Fig. 4. The calculated Figure 4. Aging rate as a function of absolute temperature for the specimen quenched from 240°C and subsequently aged. The slope is the activation energy of T⬘ phase formation.
Figure 5. Hexagonal close-packed arrangement of the cross section areas of␣ rods of diameter d and interrod spacing in the matrix.
[1120]//[111]T⬘, (1101)//(110)T⬘.
3. It has been shown that the formation of T⬘ phase is primarily contributed by the␣/ phase interface diffusion, whose activation energy is 66.4 kJ/mole䡠 K.
Acknowledgments
The authors would like to thank Dr. Jong-Shing Bow for his assistance in TEM operation. References
1. W. Ko¨ster, Z. Metallkde 33, 289 (1941). 2. E. Gebhardt, Z. Metallkde 33, 297 (1941). 3. S. Murphy, Z. Metallkde 71, 96 (1980).
4. T. Savaskan and S. Murphy, Mater. Sci. Technol. 6, 695 (1990). 5. K. Lo¨hberg, Z. Metallkd. 74, 456 (1983).
6. M. Durman and S. Murphy, Acta. Metall. Mater. 39, 2235 (1991). 7. S. Murphy, Met. Sci. 9, 163 (1975).
8. B. J. Li and C. G. Chao, Metall. Trans. 27A, 809 (1996).
9. T. Mura, Micromechanics of Defect in Solids, p. 118, Martinus Nijhoff, Dordrecht (1987). 10. G. A. Shirn, E. S. Majda, Acta Metall. 1, 513 (1953).