以飛秒級偏振加波鎖模摻鉺光纖雷射產生超連續光譜
51
0
0
全文
(2) 以飛秒級偏振加波鎖模摻鉺光纖雷射產生超連續光譜 Supercontinuum generation based on a Femtosecond Polarization APM Er-doped Fiber Laser. 研究生:吳銘峰 指導教授:賴暎杰. Student: Ming-feng Wu 博士. Advisor: Dr. Yinchieh Lai. 國立交通大學 光電工程研究所 碩士論文. A Thesis Submitted to Department of Photonics & Institute of Electro-Optical Engineering College of Electrical Engineering and Computer Science National Chiao Tung University In Partial Fulfillment of Requirements for the Degree of Master in Electro-Optical Engineering July 2005 Hsinchu, Taiwan, Republic of China 中華民國九十四年七月.
(3) 以飛秒級偏振加波鎖模摻鉺光纖雷射產生超連續光譜. 研究生:吳銘峰. 指導教授:賴暎杰. 博士. 國立交通大學光電工程研究所碩士班. 摘要. 我們架設一飛秒級偏振加波鎖模摻鉺光纖雷射,此雷射可產生脈衝重 複率為 30.9MHz、輸出功率為 3.10mW、脈寬為 339fs 的脈衝輸出。脈衝通 過摻鉺光纖放大器後,輸出變為皮秒級脈衝。我們利用單模光纖來壓縮脈 衝,壓縮後的脈衝脈寬為 229fs、峰值功率為 19.50kW、脈衝能量為 0.6nJ。 最後我們用 8.4 公尺的高非線性色散偏移光纖直接與單模光纖熔接來產生 超連續光譜,可涵蓋從 1.15 µm 到 2.3 µm 的波段。. I.
(4) Supercontinuum generation based on a Femtosecond Polarization APM Er-doped Fiber Laser. Student: Ming-feng Wu. Advisor: Dr. Yinchieh Lai. Department of Photonics & Institute of Electro-Optical Engineering College of Electrical Engineering and Computer Science National Chiao Tung University. Abstract. We set up a femtosecond Polarization APM Er-doped fiber laser that generates 339 femtosecond pulses at a repetition rate of 30.9MHz, with the average power of 3.10 mW. The laser pulses pass through an EDFA and the output become picosecond pulses. These picosecond pulses are compressed by a SMF and the compressed pulses are 229 fs with the peak power of 19.50 kW and the pulse energy of 0.6nJ. A 8.34m of HNLF is fusion spliced directly to the SMF to generate a supercontinuum with the covered wavelengths from 1.15 µm to 2.3 µm... II.
(5) Acknowledgement 於光電所碩士班兩年時光中,能夠順利完成這本論文首先感謝指導教 授賴暎杰老師在專業知識上的細心指導,以及讓我瞭解做學問的態度與方 法。在實驗上感謝博士班項維巍學長的指導,讓我在實驗上很快的進入狀 況,還有感謝祁老師的博士班學生,錢鴻章學長、彭朋群學長、彭煒仁學 長、林俊廷學長、黃明芳學姐在實驗儀器上的商借與指導,讓我實驗能順 利完成。 感謝實驗室同學吳金水、 林倩伃、張淑惠在實驗上的討論及生活與課 業上的照顧跟幫忙,還有感謝祁老師、陳老師、馮老師的學生們及實驗室 的學弟在相處時間所帶來的歡樂。 最後要感謝我的父母跟一些默默在背後支持的好朋友,謝謝你們一直 以來的照顧與關心。在此,把論文獻給你們。. III.
(6) Contents Chinese Abstract………………………………………………………………..Ⅰ English Abstract………………………………………………………………...Ⅱ Acknowledgement……………………………………………………………...Ⅲ Contents………………………………………………………………………...Ⅳ List of Figures…………………………………………………………………..Ⅵ. Chapter 1. Introduction……………………………………………………1 1.1 Overview of Supercontinuum Generation…………………………………..1 1.2 Motivation of the Research………………………………………………….2 1.3 Structure of this Thesis……………………………………………………...2. Chapter 2. Principle of the Experiment………………………………...4 2.1 Principle of Polarization Additive Pulse Mode-Locking …………………...4 2.1.1Nonlinear Polarization Rotation……………………………………….4 2.1.2 Stretched-Pulse Laser…………………………………………………5 2.2 Nonlinear Effects of the Fiber………………………………………………6 2.2.1 Self-Phase Modulation (SPM)………………………………………...7 2.2.2 Cross-Phase Modulation (XPM)……………………………………...8 2.2.3 Four-Wave Mixing (FWM)…………………………………………...9 2.2.4 Stimulated Raman Scattering (SRS)…………………………………11. IV.
(7) 2.2.5 Stimulated Brillouin Scattering (SBS)………………………………12. Chapter 3. Experimental Setup and Results…………………………20 3.1 Experimental Setup………………………………………………………..20 3.2 Experimental Results………………………………………………………23 3.2.1 Result A……………………………………………………………...23 3.2.2 Result B……………………………………………………………...25. Chapter 4. Conclusions and Future Work……………………………38 4.1 Conclusions………………………………………………………………..38 4.2 Future Work………………………………………………………………..39. References……………………………………………………………………40. V.
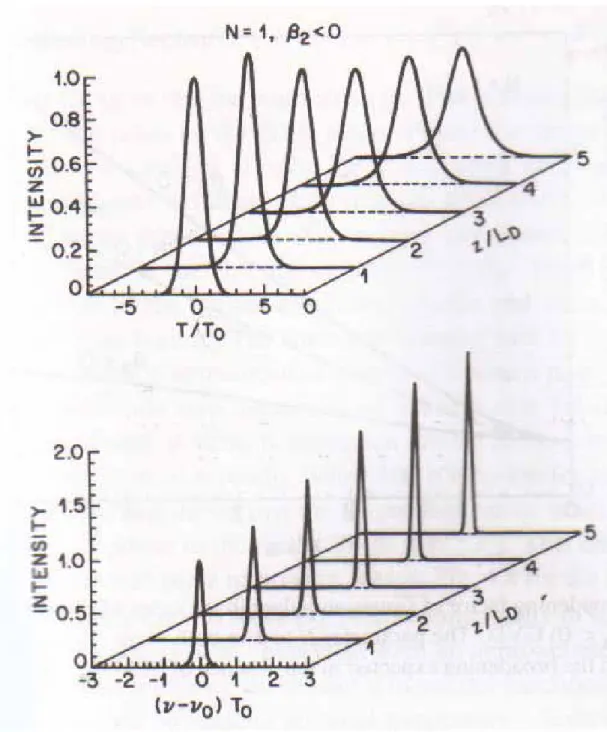
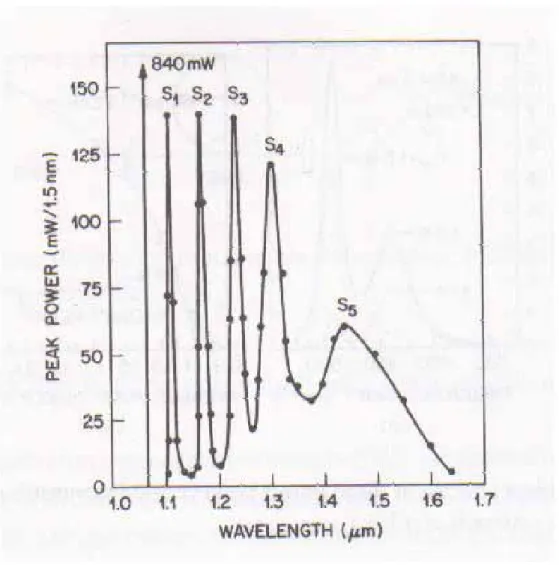
(8) List of Figures & Tables Fig 2-1. Schematic of nonlinear polarization rotation………………………………………15. Fig 2-2. Mechanism of P-APM……………………………………………………………..15. Fig 2-3. Schematic of stretch-pulse laser……………………………………………………16. Fig 2-4. Evolution of pulse shapes (upper plot) and optical spectra (lower plot) over a distance of 5 LD for an initially unchirped Gaussian pulse propagating in the normal-dispersion regime of fiber………………………………………………….17. Fig 2-5. Evolution of pulse shapes (upper plot) and optical spectra (lower plot) under condition identical to those of Fig 2-4 except that the Gaussian pulse propagates in the anomalous-dispersion regime…………………………………………………..18. Fig 2-6. Stimulated Raman Scattering, two incident photons, one representing the signal (υs) and the other representing the pump (υp). At the output the signal is amplified, the energy loss is h(υp- υs)……………………………………………………………...19. Fig 2-7. Five Stokes lines S1 to S5 generated simultaneously using 1.06- µ m pump pulses. Vertical line corresponds to residual pump. Powers were measured through a monochromator with 1.5- nm resolution………………………………………...19. Fig 3-1. Experiment Setup…………………………………………………………………..28. Fig 3-2. The optical spectrum of the laser in result A………………………………………30. Fig 3-3. The RF spectrum of the laser in result A…………………………………………..31. VI.
(9) Fig 3-4. The SHG autocorrelation trace of the laser in result A…………………………….31. Fig 3-5. Measured amplifier output the spectrum with the change of the length of the SMF………………………………………………………………………………...32. Fig 3-6. The SHG autocorrelation trace of the amplified pulse…………………………….32. Fig 3-7. The optical spectrum of the laser in result B………………………………………33. Fig 3-8. The RF spectrum of the laser in result B…………………………………………..34. Fig 3-9. The SHG autocorrelation trace of the laser in result B…………………………….34. Fig 3-10 The optical spectrum of the compressed pulse…………………………………….35 Fig 3-11 The SHG autocorrelation trace of the compressed pulse…………………………..35 Fig 3-12 The optical spectrum of Supercontinuum measured by optical spectrum analyzer..36 Fig.3-13 The LabVIEW for the optical spectral scanning…………………………………...36 Fig 3-14 The. optical. spectrum. of. Supercontinuum. measured. by. a. scanning. Mnochromator……………………………………………………………………...37 Table 3-1 The physical characteristics of HNLF……………………………………………..29 Table 3-2 The optical Specifications at 1550 nm of HNLF…………………………………..29 Table 3-3 The optical parameters of the erbium-doped fiber (Lucent R37005)……………...30 Table 3-4 The optical parameters of the erbium-doped fiber (OFS EDF80)…………………33. VII.
(10) Chapter 1. Introduction. 1.1 Overview of Supercontinuum Generation Supercontinuum generation – a physical phenomenon leading to a dramatic spectral broadening of the laser pulses propagating through a nonlinear medium – was first demonstrated by Alfano and Shapiro in the early 1970s [1]. In recent years, the development of novel optical waveguides with low and flat chromatic dispersion and very small effective area, as well as the continuing improvements in pulsed laser sources have led to the observation of octave spanning (i.e.,containing both f and 2f frequencies) supercontinuum generation in the visible, as well as the infrared. Supercontinua extending to visible wavelengths are typically generated in micron-scale air-silica waveguides pumped by fs Ti-Sapphire lasers near 800 nm [2],[3], whereas infrared supercontinua [4] are frequently produced using erbium-doped femtosecond fiber lasers and germano-silicate highly nonlinear, dispersion-shifted fiber (HNLF) [5], [6]. The octave-spanning spectra generated in these systems have had significant impact on the field of frequency metrology. The supercontinuum is actually a comb of frequencies separated by the repetition rate of the pulsed laser driving the supercontinuum. An octave-spanning comb can then be readily referenced against itself by doubling the low frequency portion and beating against the high frequency portion, as has been demonstrated with bulk-optic solid-state lasers, [7] as well as more recently with fiber lasers [8]. The result is an ultrahigh precision frequency ruler that has enabled vast. 1.
(11) improvements in absolute frequency measurements [9]. In addition to their useful frequency metrology properties, these sources exhibit very large spectral densities over more than an octave of optical spectrum, making them useful in other technologies, such as optical coherence tomography [10], spectral slicing for telecommunication applications [11], swept wavelength Raman pumps [12], broadband spectral interferometry [13], and various other optical test and measurement applications that require intense ultrabroad-bandwidth sources.. 1.2 Motivation of the Research Ultrashort pulse laser sourse is important for a lot of applications, and supercontinuum generation is one of them. The techniques of the femtosecond laser have been developed in many ways, such as mode locking, etc. In our lab, we can generate femtosecond pulses by a polarization APM Er-doped fiber laser. We try to combine a polarization APM Er-doped fiber laser and HNLF to produce supercontinuum generation in optical fibers.. 1.3 Structure of this Thesis The thesis comprises four chapters. Chapter 1 is an introductory chapter which consists of an introduction to supercontinuum generation and the purpose of our research. Chapter 2 describes the principle of our experiment. It contains the principle of polarization additive pulse mode locking and the nonlinear effects in optical fibers. In Chapter 3, the experimental. 2.
(12) setup and results are presented. Finally, we give a conclusion and discuss the future work we can do in Chapter 4.. 3.
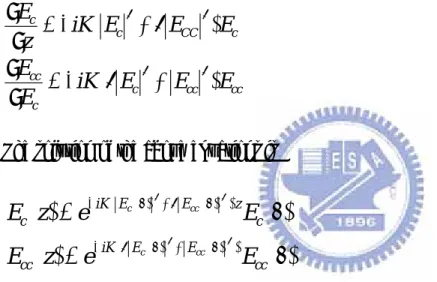
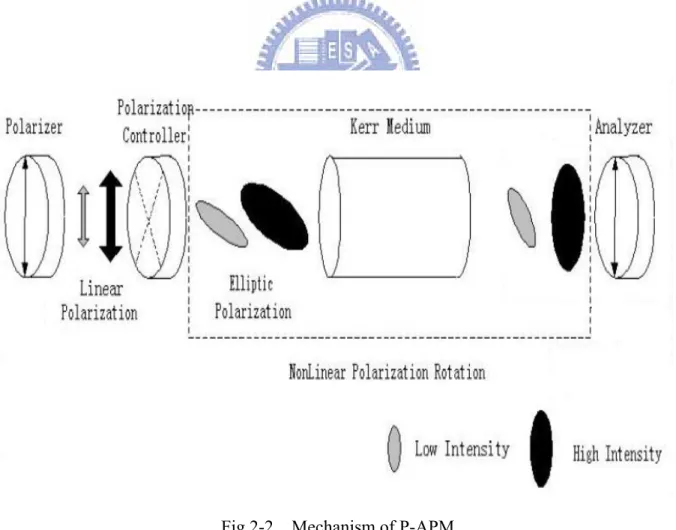
(13) Chapter 2. Principle of the Experiment. 2.1 Principle of Polarization Additive Pulse Mode-Locking 2.1.1 Nonlinear Polarization Rotation Nonlinear polarization rotation [14][15] can occur in an optical fiber when the initial polarization state is elliptical due to the Kerr effect in glass [14][15]. The propagation equation of the CW circular polarized light in the isotropic Kerr medium can be written as:. ∂Ec 2 2 = −iK ( Ec + 2 ECC ) Ec ∂z ∂Ecc 2 2 = −iK (2 Ec + Ecc ) Ecc ∂Ec The solution of the above equations is. Ec ( z ) = e. 2. 2. − iK ( E c ( 0 ) + 2 E cc ( 0 ) ) z. Ecc ( z ) = e. 2. 2. − iK ( 2 E c ( 0 ) + E cc ( 0 ) ). Ec (0) Ecc (0). So the state of an elliptical polarized light ( E c. 2. 2. ≠ E cc ) will be rotated as shown in Fig.2-1.. The rotated angle is proportional to the propagation distance and the intensity difference. Nonlinear polarization rotation relies on the intensity-dependent rotation of an elliptical polarization state in a length of optical fiber. With proper settings of the initial polarization ellipse and the phase bias, pulse shortening can occur with the presence of a polarized element. Fig 2-2 shows how nonlinear polarization rotation can be used in conjunction with bulk polarization optics to obtain an artificial fast saturable absorber [16] and to mode-lock the laser. An initial pulse is linearly polarized and then made elliptically polarizated with a 4.
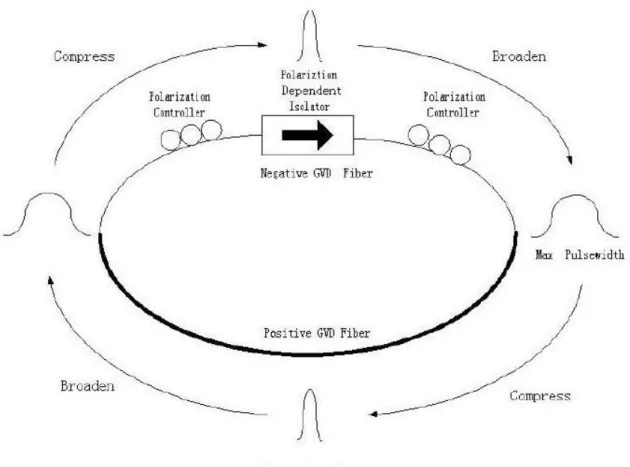
(14) quarter-wave plate. The light then passes through an optical fiber where ellipse rotation occurs and the peak of the pulse rotates more than the pulse wings. At the output of the fiber, the half-wave plate is oriented in such a way that the peak of the pulse passes through the polarizer while the wings of the pulse are extinguished. In this way achieving pulse shortening is achieved.. 2.1.2 Stretched-pulse laser Soliton lasers have inherent practical limits on their pulse width and pulse energy by the area theorem, due to the spectral sideband generation and saturation of the APM effect. Because the energy of a soliton is proportional to the product of the peak power and the pulse width, the energy is thus limited when either the peak power or pulse width is limited. To overcome this difficulty, the stretched-pulse technique was introduced, where an all fiber P-APM ring cavity is comprised of segments of alternately large positive- and negative-dispersion fiber, as shown in Fig 2-3. The single mode fiber has negative dispersion while the Er-fiber has positive dispersion. If the net dispersion is zero, the pulse width is shortest in the middle and is largest at the joints of the positive- and negative- dispersion fibers. Because of the periodic variation of the pulse-width in the cavity, the accumulation of nonlinear phase shift can be reduced and thus the pulse energy can be increased. A mode-locked laser with short pulse-width and high peak power thus can be obtained.. 5.
(15) 2.2 Nonlinear effects of the fiber The effects of the instantaneous nonlinear response of an optical fiber are summarized on the right hand side of the nonlinear Schrödinger (NLS) equation:. ∂A ∂A iβ 2 ∂ 2 A α 2 + β1 + + A = iγ A A . 2 2 ∂t 2 ∂z ∂t. (2.2.1). Where A = A( z , t ) is the slowly varying envelope, v g ≡ 1 / β 1 represents the group. velocity, β 2 is the group velocity dispersion (GVD), α is the absorption coefficient and the nonlinear parameter γ is defined as. γ =. n 2ω 0 cAeff. (2.2.2). Here n 2 is the nonlinear-index coefficient and the effective core area Aeff is defined as. Aeff. ⎛⎜ ∞ F ( x, y ) 2 dxdy ⎞⎟ ∫ ∫−∞ ⎠ =⎝ ∞ 4 ∫ ∫ F ( x, y) dxdy. 2. (2.2.3). −∞. In order to evaluate it, we need to consider the modal distribution F ( x, y ) for the fundamental fiber mode. Aeff depends on the fiber parameters such as the core radius and the core-cladding index difference. If F ( x, y ) is approximated by a Gaussian distribution, Aeff is equal to π w2 , for which the width parameter w depends on the fiber parameter and can be obtained using equation (2.2.4). The width parameter w is determined by fitting the exact distribution to a Gaussian form. 2. 2. V = k 0 a(n1 − n2 )1 / 2. (2.2.4). 6.
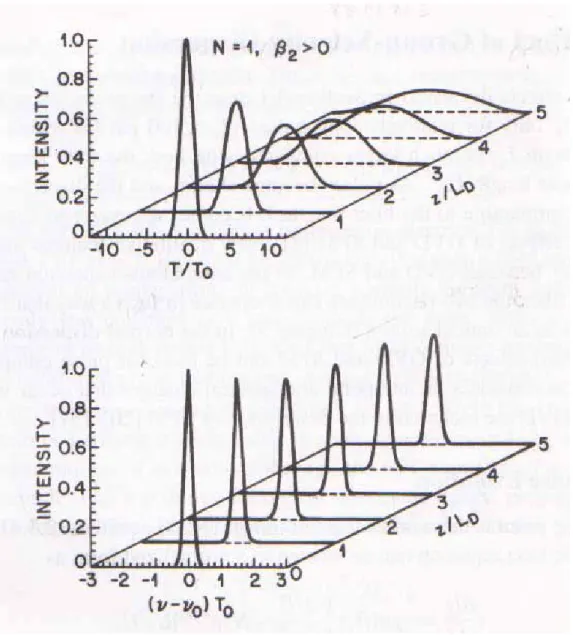
(16) where k 0 = 2π / λ , n1 and n2 are the refractive index of core and cladding, respectively. Typically, Aeff can vary in the range 20-100 µm2 in the 1.5-µm region depending on the fiber design and Aeff can be increased intentionally to reduce the impact of fiber nonlinearity. In this section we are going to give a short description of the possible nonlinear effects, where the first three phenomena (SPM, XPM and FWM) are elastic processes, as no energy is exchanged between the fields and the medium. The last two effects (SRS and SBS) are inelastic, in which the optical field transfers part of its energy to the nonlinear medium.. 2.2.1 Self Phase Modulation (SPM) Self Phase modulation (SPM) refers to the self-induced phase shift experienced by an optical field during its propagation in optical fibers [17]. The intensity-dependent nonlinear phase shift ( φ NL ) can be described by:. φ NL =. 2π. λ. G2 n2 L E. (2.2.5). G2 where L is the fiber length and E is the module of the electrical field at the working. wavelength. The SPM-induced chirp affects the pulse shape through GVD as shown in Fig 2-4 and Fig. 2-5. In the anomalous-dispersion regime of an optical fiber, the two phenomena can cooperate in such a way that the pulse propagates as an optical solution. In the normal-dispersion regime, the combined effects of GVD and SPM can be used for pulse. 7.
(17) compression. Generally SPM brings a broadening of the amplitude spectrum and thus a stretching of the pulse in time domain. The final result depends on the pulse shape and frequency chirp of the original pulse. SPM is responsible for spectral broadening of ultrashort pulses and formation of optical solutions in the anomalous-dispersion regime of fibers.. 2.2.2 Cross Phase Modulation (XPM) When two or more optical fields having different wavelengths propagate simultaneously inside a fiber, they interact with each other through the fiber nonlinearity. In general, such an interaction can generate new waves under appropriate conditions through a variety of nonlinear phenomena such as cross phase modulation, four wave mixing, stimulated Raman scattering and stimulated Brillouin scattering. Cross Phase Modulation (XPM) refers to the nonlinear phase shift induced by other fields, having a different wavelength, direction, or polarization state. Its origin can be understood by noting that the total field E is given by E=. 1 xˆ[ E1 exp( −iω1t ) + E 2 exp( −iω 2 t ) + c.c.] 2. (2.2.6). when two optical fields are frequencies ω1 and ω 2 , polarized along the x axis, propagate simultaneously inside the fiber. (The abbreviation c.c. stands for complex conjugate .) The nonlinear phase shift for the field at ω1 is then given by. φ NL = n 2. 2π. λ. (. 2. L E1 + 2 E 2. 2. ). (2.2.7). Where we have neglected all terms that generate polarization at frequencies other than ω1 and. 8.
(18) ω 2 because of their non-phase-matched character. In this case the term depending on E1 is the SPM as in equation (2.2.6) and E 2 represents the external field. The factor of 2 in equation (2.2.7) has its origin in the form of the nonlinear susceptibility and indicates that XPM is twice as effective as SPM for the same amount of power. XPM is responsible for asymmetric spectral broadening of co-propagating optical pulses.. 2.2.3 Four Wave Mixing (FWM) When several optical signals at different frequencies propagate along the fiber, the total electrical field is equal to the vectorial addition of each individual field. The resulting optical intensity will have new components as a result of the cross products in the module calculation. For example if three optical frequencies ( ω1 , ω 2 and ω 3 ) interact in a nonlinear medium, they will give rise to a fourth frequency ( ω4 ), where:. ω 4 = ω1 + ω 2 − ω3. (2.2.8). Its main features can be understood by considering the third-order polarization given as PNL = ε 0 χ. ( 3). #E E E. (2.2.9). where E is the electric field , PNL is the induced nonlinear polarization, and. ε0. is the. vacuum permittivity. Consider four optical waves oscillating at frequencies ω1 , ω 2 , ω 3 and ω4 and linearly. 9.
(19) polarized along the same axis x . The total electric field can be written as. 1 4 E = xˆ ∑ E j exp[i (k j z − w j t )] + c.c. 2 j =1. (2.2.10). where the propagation constant k j = n j ω j / c , n j is the refractive index, and all four waves are assumed to be propagating in the same direction. If we substitute equation (2.2.10) in equation (2.2.9) and express PNL in the same form as E using PNL =. 1 4 xˆ ∑ Pj exp[i(k j z − w j t )] + c.c. 2 j =1. (2.2.11). We find that Pj ( j = 1 to 4) consists of a large number of terms involving the products of three electric fields. For example, P4 can be expressed as. P4 =. 3ε 0 ( 3) 2 2 2 2 χ xxxx [ E 4 E 4 + 2( E1 + E 2 + E 3 ) E 4 4 + 2 E1 E 2 E 3 exp(iθ + ) + 2 E1 E 2 E 3* exp(iθ − ) + ...]. (2.2.12). where θ + and θ − are defined as. θ + = (k1 + k 2 + k3 − k 4 ) z − (ω1 + ω2 + ω3 − ω4 )t. (2.2.13). θ − = (k1 + k 2 − k 3 − k 4 ) z − (ω1 + ω 2 − ω3 − ω 4 )t. (2.2.14). The first four terms containing E4 in equation (2.2.12) are responsible for the SPM and XPM effects. The remaining terms result from FWM. How many of these are effective in producing a parametric coupling depends on the phase mismatch between E4 and P4 governed by θ + , θ − , or a similar quanity. FWM is responsible for inter-channel crosstalk in a WDM communication system.. 10.
(20) 2.2.4 Stimulated Raman Scattering (SRS) Raman Scattering is an inelastic process where a photon of the incident field (called pump) is absorbed and reemitted again, via an intermediate electron state, in a lower frequency. The excess energy and impulse is dissipated as a phonon (vibrational energy) into the material. This process can be combined with stimulated emission where the new photon has the same frequency and momentum as an incident signal photon. Consequently, through SRS, pump photons are progressively destroyed while new photons, called Stokes photons, are created at a down-shifted frequency that correspond to the signal photon. Fig 2.6 shows the scheme of the process. A less probable phenomenon is the emission of an anti-Stoke photon which has higher energy that the incoming pump. SRS has applications in amplification of optical communication signals and spectroscopy. As a vibrational contribution, the SRS has a delayed response characteristic for each material. The relationship between the pump and the signal power can be described as:. dI s = gRI pIs dz. (2.2.15). Where I p is the pump intensity, I s is the Stokes intensity, and g R is the Raman gain that can be measured experimentally. The Raman gain bandwidth is very wide (around 13THz) and thus the effect is particularly important for large bandwidth signal (very narrow pulses in time domain). Fig 2-7 shows the optical spectrum with five Stokes lines clearly seen. Each 11.
(21) successive Stokes line is broader than the preceding one. This broadening is due to several competing nonlinear processes and limits the total number of Stokes lines. SRS is only visible when the pump power exceeds a certain threshold level (typically Ppth ≈ 1W ).Spontaneous Raman scattering occurs when a Raman photon is generated from a. pump photon but without any relationship with the signal. This effect is normally considered as noise.. 2.2.5 Stimulated Brillouin Scattering (SBS) The process of SBS can be described classically as a nonlinear interaction between the pump and Stokes fields through a acoustic wave. The pump field generates an acoustic wave through the process of electrostriction. The acoustic wave in turn modulates the refractive index of the medium. This pump-induced index grating scatters the pump light through Bragg diffraction. Scattered light is downshifted in frequency because of the Doppler shift associated with a grating moving a the acoustic velocity ν A . The same scattering process can be viewed quantum-mechanically as if annihilation of a pump photon creates a Stokes photon and an acoustic phonon simultaneously. As both the energy and the momentum must be conserved during each scattering event, the frequencies and the wave vectors of the three waves are related by Ω B = ω p − ωs , k A = k p − k s. (2.2.16). 12.
(22) where ω p and ωs are the frequencies, and k p and k s are the wave vectors, of the pump and Stokes waves, respectively. The frequency ΩB and the wave vector k A of the acoustic wave satisfy the standard dispersion relation ΩB = ν A k A ≈ 2ν A k p sin (θ / 2 ) ,. (2.2.17). where θ is the angle between the pump and Stokes fields, and we used k p ≈ k s in equation (2.2.16). Equation (2.2.17) shows that the frequency shift of the Stokes wave depends on the scattering angle. In particular, ΩB is maximum in the backward direction. (θ = π ). and vanishes in the forward direction (θ = 0 ) . In a single-mode optical fiber, only. relevant directions are the forward and backward directions. For this reason, SBS occurs only in the backward direction with the Brillouin shift given by. ν B = ΩB / 2π = 2nν A / λ p ,. (2.2.18). where equation (2.2.17) was used with k p = 2π n / λ p and n is the modal index at the pump wavelength λ p . Even though equation (2.2.17) predicts correctly that SBS should occur only in the backward direction in single-mode fibers, spontaneous Brillouin scattering can occur in the forward direction. This happens because the guided nature of acoustic waves leads to a relaxation of the wave-vector selection rule. As a result, a small amount of Stokes light is generated in the forward direction. This phenomenon is referred to as guided-acoustic-wave Brillouin. 13.
(23) scattering. SBS has higher but narrower gain (less than 100MHz) then SRS. In optical communication systems, SBS will limit the total amount of power in the fiber.. 14.
(24) Fig 2-1 Schematic of nonlinear polarization rotation. Fig 2-2 Mechanism of P-APM. 15.
(25) Fig 2-3 Schematic of stretch-pulse laser. 16.
(26) Fig 2-4 Evolution of pulse shapes (upper plot) and optical spectra (lower plot) over a distance of 5 LD. for an initially unchirped Gaussian pulse propagating in the. normal-dispersion regime of fiber [17].. 17.
(27) Fig 2-5 Evolution of pulse shapes (upper plot) and optical spectra (lower plot) under condition identical to those of Fig 2-4 except that the Gaussian pulse propagates in the anomalous-dispersion regime [17].. 18.
(28) Fig 2-6 Stimulated Raman Scattering, two incident photons, one representing the signal (υs) and the other representing the pump (υp). At the output the signal is amplified, the energy loss is h(υp- υs).. Fig 2-7 Five Stokes lines S1 to S5 generated simultaneously using 1.06- µ m pump pulses. Vertical line corresponds to residual pump. Powers were measured through a monochromator with 1.5- nm resolution.[17]. 19.
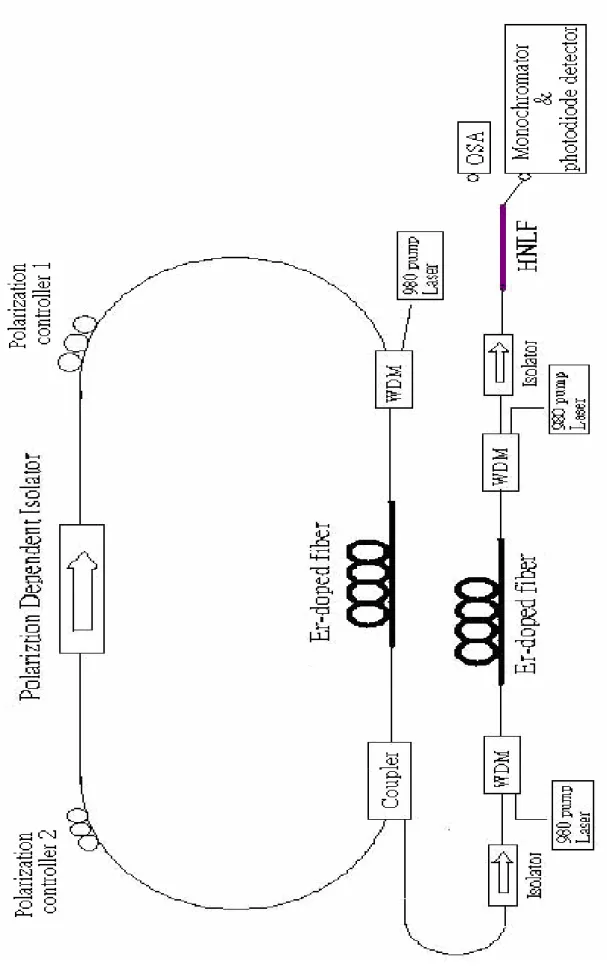
(29) Chapter 3 Experimental Setup and Result 3.1 Experimental Setup The experimental setup consists of three parts, a ring cavity laser, an erbium-doped fiber amplifier and highly nonlinear dispersion shifted fiber. The first step is we set up a ring cavity mode-locked fiber laser. It consists of erbium-doped fiber (EDF), single mode fiber (SMF), a polarization dependent isolator, and polarization controllers. The 980 nm diode laser is used as a pumping source. When the 980 nm pump lights pass through the WDM coupler and are coupled into the Er-doped fiber, for which the Er-doped fiber will converts the 980 nm pump laser lights to amplify the input 1550 nm lights. After that the amplified 1550 nm lights pass through the output coupler of which the coupling ratio is 30 : 70. This means 70% of the lights go back to the ring cavity and 30% of the lights go out of the cavity. The lights which go back to the ring cavity pass through two polarization controllers and one polarization dependent isolator. The polarization dependent isolator is placed between two polarization controllers, which acts as one of the mode-locking elements. It plays the double role of an isolator and a polarizer such that the lights leaving the isolator are linearly polarized. The polarization controller which is placed after the isolator changes the linear polarization state to elliptical one. The polarization state evolves nonlinearly during the propagation of the pulse because of the phase shifts induced by SPM and XPM on the orthogonally polarized components. The state of polarization is nonuniform across the pulse because of the intensity. 20.
(30) dependence of the nonlinear phase shift. The second polarization controller (the one before the isolator) is adjusted such that the polarization in the central part of the pulse can pass through the polarization dependent isolator without loss. In the way the polarizing isolator lets the central intense part of the pulse pass but blocks the low intensity pulse wings. The net result is that the pulse is slightly shortened after one round trip inside the ring cavity, which is an effect identical to that produced by a fast saturable absorber. On the other hand, the mode-locked pulses out of the cavity will go into the erbium-doped fiber amplifier (EDFA). The amplifier is pumped by two 980 nm diode lasers, both forward and backward. That is, the pump and the signal beam inside the EDFA may propagate in the same direction and opposite direction, respectively. The advantage of the backward pump is the high power conversion efficiency in the saturation regime because of the lower amplified spontaneous emission, so that it can improve the gain of the EDFA. The erbium-doped fiber which we use is the R37005 Er-fiber from Lucent. Table 3-3 show some important parameters of the erbium-doped fiber. In our experiment, the maximum power of the forward and the backward are the same, about 280 mW. There is a SMF fused between the 30%–70% coupler and the WDM (which is near to the forward pump source), it is used to control pre-chirp of the pulse before the lights are launched into the erbium-doped fiber. This means that the pulses are chirped appropriately at the beginning to achieve better performance. There is also a SMF between the WDM (which is near to the backward pump source) and the. 21.
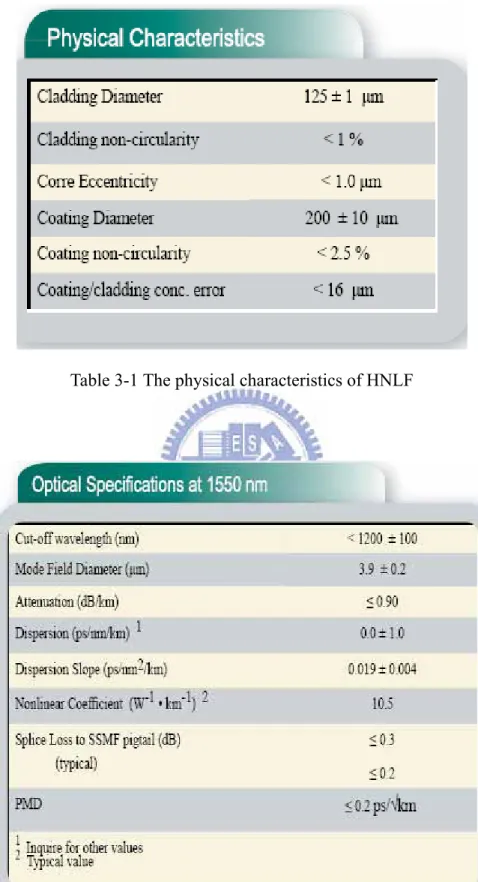
(31) highly nonlinear dispersion shifted fiber (HNLF), which is used for temporal pulse compression. Both of the SMF are made by Corning Company. The dispersion of the SMF is 17 ps/(nm-km) at 1550 nm and the dispersion of the erbium-doped fiber is approximately -45 ps/(nm-km). Because the erbium-doped fiber has a normal dispersion and the SMF has an anomalous dispersion, the net dispersion of the total fiber is decided by their lengths. For the combination of distributed gain, normal dispersion, and SPM, it leads to self-similar propagation, where pulses acquire a parabolic shape in time as well as a linear chirp [18]. A relatively new type of germanium doped silica fiber with low dispersion slope and a small effective area has recently been developed [19]. Careful design of the index profile allows the fiber to achieve a small effective area, low dispersion and dispersion slope, while maintaining low loss. These fibers have nonlinear coefficients several times larger than that of standard transmission fibers, and are often referred to as highly nonlinear, dispersion shifted fibers, or, more simply, HNLF. HNLF is compatible with standard telecom components, and can be easily fusion spliced with low loss to standard single mode fiber (SMF). Typical splice losses for SMF to HNLF are 0.2 dB at 1550 nm in this work, although we have demonstrated splice losses as low as 0.02 dB. The dispersion and dispersion slope of HNLF are 0.0 ps/(nm-km) and 0.0019 ps/(nm-km) at 1550 nm, respectively. The nonlinear coefficient ( γ ) of the HNLF is 10.5 W-1-km-1. The physical characteristics and optical specifications (at 1550 nm) of HNLF are shown in Table 3-1 and Table 3-2, respectively The possible applications of. 22.
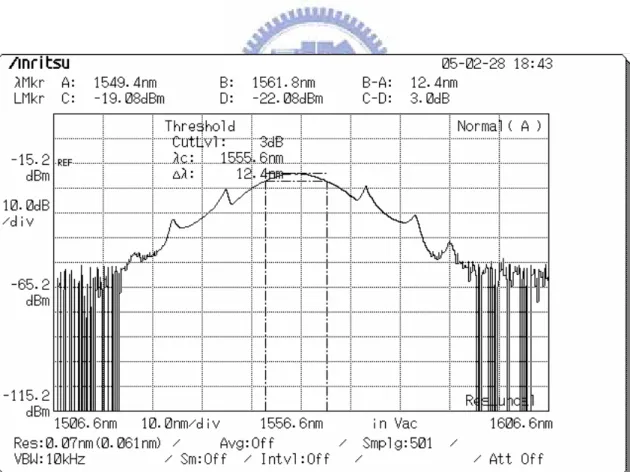
(32) HNLF include the optical regeneration based on SPM, pulse compression, parametric amplification, wavelength conversion by XPM, and supercontinuum generation. In our experiment, after the pulse passing through the EDFA, they will be launched into the HNLF to generate the supercontinuum. Supercontinuum generation involves the whole catalog of classical nonlinear-optical effects, such as self- and cross-phase modulation, four-wave mixing, stimulated Raman scattering, and many others, which add up together to produce emission with extremely broad spectra, sometimes spanning over a couple of octaves.. 3.2 Experimental Result 3.2.1 Result A For the experiment A, we have set up the ring cavity, of which the cavity length is about 7.6 m (erbium-doped fiber 2.88 m and SMF 4.72 m). Because of the erbium-doped fiber has a normal dispersion and the SMF has an anomalous dispersion, the net dispersion of the total fiber in the cavity is anomalous. The pump power of the 980 nm laser in the cavity is 72 mW. After mode-locking, the average output power launched from the cavity is 6.7 mW, and we observe that the pulse of the output light is operated in soliton regime, which agrees with what we expect. Fig 3-2 shows the optical bandwidth of the mode-locked pulses detects by an optical spectrum analyzer. From the figure, we observe that the bandwidth is 12.4 nm and the central frequency is at 1555.6 nm. We also measure the pulse with a RF spectrum analyzer. 23.
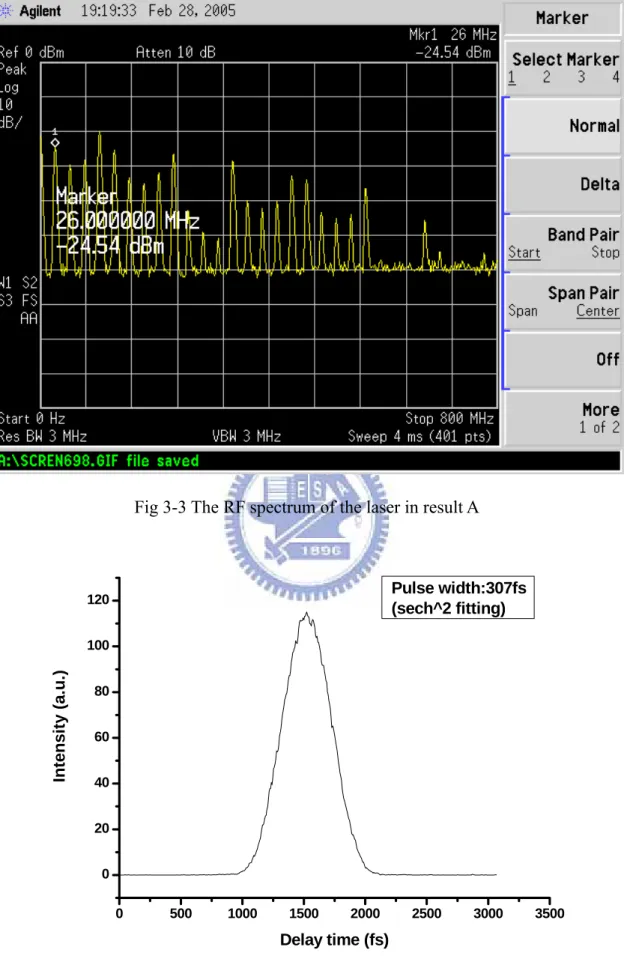
(33) and an autocorrelator. The repetition rate of the mode-locked laser is 26 MHz as shown in Fig 3-3 and from the modulation of RF spectrum we guess the pulse may be close to the state of splitting. On the other hand, after the autocorrelation trace and hyperbolic-secant square fitting, we observe that the pulse width is 307 fs as shown in Fig 3-4, but it is not short enough for our experiment. After the calculation for the time-bandwidth, it is about 0.472, which indicates that the output pulses of the mode-locked laser are not transform-limited. Before the mode-locked laser pulse is launched into the EDFA, we use a SMF to achieve the pre-chirp capability. Because the Self-phase modulation (SPM) due to n2 in optical fibers is normally associated with broadening spectral, for a pulse which chirp is initially negative, after SPM the spectrum will be compressed [20, 21]. In our experiment A, the SMF after the WDM (which is near to the backward pump source) is 0.89-m long and we change the length of the SMF between the coupler and EDFA to achieve pre-chirp. The erbium doped fiber in the EDFA is 4.39 m long. Fig 3-5 shows the spectrum with the change of the length of the SMF. From the figures, we find that the bandwidth of the spectrum is dependent on the pre-chirp of the pulse. Finally, we choose the length of SMF to be 6.2 m, which is the best result for the pre-chirp purpose in our measurement. Fig 3-6 shows the autocorrelation trace of the pulse launched from the EDFA after pre-chirp. From the figure, we observe that the pulse-width of the amplified pulse is 1867 fs and is in an approximately to parabolic shape.. 24.
(34) 3.2.2 Result B From the experiment , we know that the length of the SMF which is used to achieve pre-chirp can affect the bandwidth and the pulse-width of the amplified pulses. In order to improve the pulse-width of the amplified laser pulses, another kind of erbium-doped fiber is used in the mode-locked ring laser cavity. The erbium-doped fiber is EDF80 fiber from OFS company. In the experiment B, the experimental setup is same as the previous one, but the erbium-doped fiber in the mode-locked ring laser cavity is different. The length of the erbium-doped fiber we use here is 2.03 m and the total length of the cavity is 6.47 m. Table 3-4 shows some important parameters of the erbium-doped fiber. As mention before, the erbium-doped fiber has a normal dispersion and the SMF has an anomalous dispersion. The pump power of the 980 nm laser in the cavity is 72 mW. After mode locking, we can get 3.10 mW output power from the cavity and the pulse is operated in the stretched-pulse regime. Fig 3-7 shows the optical bandwidth of the mode-locked pulses detects by an optical spectrum analyzer, it shows that the bandwidth is 18.6 nm and the central frequency is at 1585.8 nm. We also measure the pulses by the use of a RF spectrum analyzer and an autocorrelator. The repetition rate of the mode-locked laser is 30.9 MHz, as shown in Fig 3-8. On the other hand, after the autocorrelation trace and Gaussian fitting, we observe that the pulse width is 339 fs as shown in Fig 3-9, which is better than the previous experiment. The time-bandwidth is. 25.
(35) about 0.749, which indicates that the pulses of the mode-locked laser are not the transform-limited. The erbium doped fiber of the EDFA is 4.27 m long, which is used to amplify the output mode-locked pulses. A 1.6m section of SMF is used to achieve the pre-chirp. The amplified average power is 138 mW. A 2.91 m SMF is fused between the WDM (which is near to the backward pump source) and highly nonlinear dispersion shifted fiber (HNLF), which is used to achieve the pulse compression. Fig 3-10 shows the optical bandwidth of the compressed pulse detects by an optical spectrum. In the figure, we observe that the bandwidth is 69.5 nm. According to its autocorrelation trace and Gaussian fitting, we observe that the pulse width is 229 fs, as shown in Fig 3-11. We also observe that the pulses how have some pedestals from the figure. The length of the HNLF is 8.34 m and the fusion loss between the SMF and the HNLF is about 0.02dB. The pulse energy and the peak power of the compressed pulses are about 0.6 nJ and 19.50 kW respectively. After the pulses passing through the HNLF, the supercontinuum is generated. The spectral is detected by an optical spectrum analyzer and the range of the wavelength is from 0.6µm to 1.75 µm as shown in Fig 3-12. Because the measured range of the optical spectrum analyzer is limited at 1.75 µm, we also replace the optical spectrum analyzer to a monochromator and a photodiode detector for the measurement. A LabVIEW program is used to control the scanning of the monochromator and record the intensity of the. 26.
(36) photodiode detector as shown in Fig 3-13. Fig 3-14 shows optical spectrum from the scanning monochromator and a photodiode detector. From Fig 3-12 and Fig 3-14, we observe that the generated supercontinuum spanned a spectral range of 1.15 µm from the wavelength 1.15 µm to 2.3 µm.. 27.
(37) Fig 3-1 Experiment Setup. 28.
(38) Table 3-1 The physical characteristics of HNLF. Table 3-2 The optical Specifications at 1550 nm of HNLF. 29.
(39) Table 3-3 The optical parameters of the erbium-doped fiber (Lucent R37005). Fig 3-2 The optical spectrum of the laser in result A. 30.
(40) Fig 3-3 The RF spectrum of the laser in result A. Pulse width:307fs (sech^2 fitting). 120. Intensity (a.u.). 100 80 60 40 20 0 0. 500. 1000. 1500. 2000. 2500. 3000. Delay time (fs). Fig 3-4 The SHG autocorrelation trace of the laser in result A 31. 3500.
(41) 45 40. Optical bandwidth (nm). 35 30 25 20 15 10 5 0 0. 2. 4. 6. 8. 10. 12. 14. 16. 18. Pre-chirp fiber length (m). Fig 3-5 Measured amplifier output the spectrum with the change of the length of the SMF. Pulse width:1867fs(sech^2 fitting). Intensity (a.u.). 100. 10. 1. 0. 1000. 2000. 3000. 4000. 5000. 6000. 7000. Delay time (fs). Fig 3-6 The SHG autocorrelation trace of the amplified pulse 32.
(42) Peak Absorption near 1530 nm (db/m). 80. Cut-off wavelength (nm). 1000. Mode field diameter1 ( µ m). 4.9. Numerical aperture. 0.29. Table 3-4 The optical parameters of the erbium-doped fiber (OFS EDF80). Fig 3-7 The optical spectrum of the laser in result B. 33.
(43) Fig 3-8 The RF spectrum of the laser in result B. Pulse width:339 fs (Gaussian fitting). 18. Intensity (a.u.). 16 14 12 10 8 6 4 2 0 0. 1000. 2000. 3000. Delay Time (fs). 4000. 5000. 6000. Fig 3-9 The SHG autocorrelation trace of the laser in result B 34.
(44) Fig 3-10 The optical spectrum of the compressed pulse. 35. Pulse width:229 fs (Gaussian fitting). Intensity (a.u.). 30 25 20 15 10 5 0 0. 2000. 4000. 6000. 8000. Delay Time (fs). Fig 3-11 The SHG autocorrelation trace of the compressed pulse 35. 10000.
(45) Fig 3-12 The optical spectrum of Supercontinuum measured by optical spectrum analyzer. Fig. 3-13 The LabVIEW for the optical spectral scanning. 36.
(46) 0. Power (dBm). -5. -10. -15. -20. -25. 1200 1300 1400 1500 1600 1700 1800 1900 2000 2100 2200 2300 2400 2500 2600 2700. Wavelength (nm). Fig 3-14 The optical spectrum of Supercontinuum measured by a scanning Mnochromator. 37.
(47) Chapter 4 Conclusion and future work 4.1 Conclusion In the thesis, we have demonstrated the supercontinuum generation by a system that includes a femtosecond Polarization APM Er-doped fiber laser, a erbium-doped fiber amplifier and a section of HNLF. The polarization APM Er-doped fiber laser is able to generate 339 femtosecond pulses at a repetition rate of 30.9MHz ,with average power 3.10 mW. The pulses from the mode-locked laser pass through a 1.6m length of SMF for pulse pre-chirp and then are launched an EDFA with a 4.27m Er-fiber. The average power of the amplified pulse is risen to 138mW. The SMF with the length of 2.91m after the EDFA is used for pulse compression. Temporal compression through the SMF generates 229 fs pulses with the pulse energy of 0.6nJ and the peak power of 19.50kW. Then the compressed pulses are then launched into a 8.34m length of HNLF, which is fusion spliced directly to the SMF for supercontinuum generation. The generated supercontinuum spectrum is detected by an optical spectrum analyzer and by the combination of a scanning monochromator and a photodiode detector. The observed supercontinuum spectrum spans about 1.15 µm from the 1.15 µm to wavelength 2.3 µm. These results demonstrate that our femtosecond fiber laser system is capable of acting as the light source for supercontinuum generation.. 38.
(48) 4.2 Future work In principle, the performance of supercontinuum generation can be further improved by the following things: (1) making the input pulse-width shorter (2) making the input pulse energy larger (3) optimally adjusting the length of HNLF. In the future we will continue to perform careful numerical simulation as well as experimental verification to fine-tune our system. Hopefully an efficient supercontinuum generation system can be deployed based on our fiber laser system.. 39.
(49) References [1] R. R. Alfano, Ed., The Supercontinuum Laser Source. New York:Springer-Verlag, 1989. [2] J. K. Ranka, R. S.Windeler, and A. J. Stentz, “Visible continuum generation in air-silica microstructure optical fibers with anomalous dispersion at 800 nm,” Opt. Lett., vol. 25, no. 1, pp. 25–27, Jan. 2000. [3] T. A. Birks, W. J. Wadsworth, and P. St. J. Russell, “Supercontinuum generation in tapered fibers,” Opt. Lett., vol. 25, no. 19, pp. 1415–1417,Oct. 2000. [4] J.W. Nicholson, M. F. Yan, P.Wisk, J. Fleming, F. DiMarcello, E. Monberg, A. Yablon, C. Jørgensen, and T. Veng, “All-fiber, octave-spanning supercontinuum,” Opt. Lett., vol. 28, no. 8, pp. 643–645, Apr. 2003. [5] T. Okuno, M. Onishi, T. Kashiwada, S. Ishikawa, and M. Nichimura, “Silica-based functional fibers with enhanced nonlinearity and their applications,” IEEE J. Sel. Topics Quantum Electron., vol. 5, pp.1385–1391, Sep.–Oct. 1999.. [6] C. G. Jørgensen, T. Veng, L. Gruner-Nielsen, and M. Yan, “Dispersion flattened highly nonlinear fiber,” in Proc. 29th Europ. Conf. Opt.Commun., ECOC ’03, Rimini, Italy, pp. 556–557. [7] D. J. Jones, S. A. Diddams, J. K. Ranka, A. Stentz, R. S.Windeler, J. L.Hall, and S. T. Cundiff, “Carrier-Envelope phase control of femtosecond mode-locked lasers and direct optical frequency synthesis,” Science, vol.288, pp. 635–639, Apr. 2000.. 40.
(50) [8] B. R.Washburn, S. A. Diddams, N. R. Newbury, J.W. Nicholson, M. F.Yan, and C. G. Jorgensen, “Phase-locked erbium-fiber-laser-based frequencycomb in the near infrared,” Opt. Lett., vol. 29, no. 3, pp. 250–252,Feb. 2004.. [9] L. S. Ma, Z. Y. Bi, A. Bartels, L. Robertsson, M. Zucco, R. S.Windeler,G. Wilpers, C. Oates, L. Hollberg, and S. A. Diddams, “Optical frequency synthesis and comparison with uncertainty at the 10 level,”Science, vol. 303, pp. 1843–1845, Mar. 2004. [10] I. Hartl, X. D. Li, C. Chudoba, R. K. Ghanta, T. H. Ko, J. G. Fujimoto, J. K. Ranka, and R. S. Windeler, “Ultrahigh-resolution optical coherence tomography using continuum generation in an air silica microstructure optical fiber,” Opt. Lett., vol. 26, no. 9, pp. 608–610, May 2001. [11] S. Kawanishi, H. Takara, K. Uchiyama, I. Shake, and K. Mori, “3 Tbit/s (160 Gbit/s _19 channel) optical TDM and WDM transmission experiment,”Electron. Lett., vol. 35, no. 10, pp. 826–827, May 1999. [12] J. W. Nicholson, J. M. Fini, J.-C. Bouteiller, J. Bromage, and K. Brar, “Stretched ultrashort pulses for high repetition rate swept-wavelengthRaman pumping,” J. Lightw. Technol., vol. 22, pp. 71–78, Jan. 2004.. [13] J. Jasapara, T. H. Her, R. Bise, R. Windeler, and D. J. DiGiovanni, “Group-velocity dispersion measurements in a photonic bandgap fiber,”J. Opt. Soc. Am. B, vol. 20, no. 8, pp. 1611–1615, Aug. 2003.. 41.
(51) [14] R. H. Stolen, J. Botineau, and A. Ashkin, “Intensity discrimination of optical pulses with birefringent filters”, Opt. Lett. 7, 512 (1982). [15] M. Hofer, M. E. Fermann, F. Haberl, M. H. Ober, and A. J. Schmidt, “Mode locking with cross-phase and self-phase modulation”, Opt. Lett. 16, 502 (1991). [16] H. A. Haus, J. G. Jujimoto, E. P. Ippen, “ Analytic theory of additive pulse and Kerr lens mode locking”, IEEE J. Quant. Electron. QE-28, 2086 (1992) [17]Govind P. Agrawal, Nonlinear Fiber Optics, 3rd edition, Academic Press, 2001 [18] M. E. Fermann, V. I. Kruglov, B. C. Thomsen, J. M. Dudley, and J. D. Harvey. “Self-similar propagation and amplification of parabolic pulses in optical fibers,” Phys. Rev. Lett. 84, 6010, (2000). [19] T. Okuno, M. Onishi, T. Kashiwada, S. Ishikawa, and M. Nichimura. “Silica-based functional fibers with enhanced nonlinearity and their applications,” IEEE J.S.T. Quantum Electron. 5, 1385–1391, (1999). [20] M. Oberthaler and R. A. H¨opfel. “Spectral narrowing of ultrashort laser pulses by self-phase modulation in optical fibers,” Appl. Phys. Lett. 63, 1017–1019, (1993). [21]B. R. Washburn, J. A. Buck, and S. E. Ralph. “Transform-limited spectral compression due to self-phase modulation in fibers,” Opt. Lett. 25, 445–447, (2000).. 42.
(52)
數據
+7
Outline
相關文件
1) Ensure that you have received a password from the Indicators Section. 2) Ensure that the system clock of the ESDA server is properly set up. 3) Ensure that the ESDA server
You shall find it difficult to generate more kinds by varying the inputs, and we will give a formal proof in future lectures.
This thesis applied Q-learning algorithm of reinforcement learning to improve a simple intra-day trading system of Taiwan stock index future. We simulate the performance
Hence, we have shown the S-duality at the Poisson level for a D3-brane in R-R and NS-NS backgrounds.... Hence, we have shown the S-duality at the Poisson level for a D3-brane in R-R
In conclusion, we have shown that the ISHE is accompanied by the intrinsic orbital- angular-momentum Hall effect so that the total angular momenttum spin current is zero in a
17-1 Diffraction and the Wave Theory of Light 17-2 Diffraction by a single slit.. 17-3 Diffraction by a Circular Aperture 17-4
In this work, for a locally optimal solution to the NLSDP (2), we prove that under Robinson’s constraint qualification, the nonsingularity of Clarke’s Jacobian of the FB system
In this work, for a locally optimal solution to the nonlin- ear SOCP (4), under Robinson’s constraint qualification, we show that the strong second-order sufficient condition
