A
Study on Blends of liquid Crystalline Copolyesters with
Polycarbonate.
1.
Compatibility
by
Transesterification
KOE-FU SU and KUNG-HWA WEI”
Institute of Materials Science and Engineering, National Chiao Tung University, Hsinchu, Taiwan, Republic of China
SYNOPSIS
Blends of poly(bispheno1-A carbonate) (PC) and synthesized liquid crystalline poly(oxybenzoate-co-ethylene terephthalate 40/60) (P46) were prepared through melt- mixing in a Brabender mixer. The miscibility of the blends at different compositions and blending time was investigated with differential scanning calorimetry. The corresponding morphology of the blends was analyzed with scanning electron microscopy. It was found that for blends containing more than 20% P46 and mixed at 250°C or above the transes- terification between PC and P46 took place. This transesterification was confirmed at a blend containing 40% P46 by nuclear magnetic resonance spectroscopy. The transesteri- fication happened first between PC and the ester in the poly(ethy1ene terephthalate) (PET) block and then between PC and the ester in the polyoxybenzoate (POB) block. A t 260°C and after 60 min’ blending, the blend containing 30% P46 became an almost compatible system for appearing of a single glass transition temperature. This is also verified by the disappearing of P46 droplets in the PC matrix in the micrographs’ observation. After 60 min’ of blending, the compatibility of the system can be greatly improved even for the blend containing 40% P46 mixed at 260°C by the micrograph’s observation. 0 1995 John Wiley & Sons, Inc.
INTRODUCTION
Blending of polymers has been a major research fo- cus in polymer science. In particular, polyester blends have been studied extensively because of in- dustrial applications and academic interests. The interaction between components was the key factor in determining the miscibility of the blends. Cole- man et al. found that the greater the intermolecular hydrogen bonding interaction the greater is the probability of miscibility.’ Barlow and co-workers carried out a study on the miscibility of bisphenol-
A polycarbonate (PC) in polyester They found that at a n optimum density of ester groups in the polyester chain a maximum interaction be- tween components is achieved. Ester exchange (transesterification) took place for polyester blends near or above their melting points. Kotliar‘ reviewed and discussed the interchange reactions, including
* To whom correspondence should be addressed.
Journal of Applied Polymer Science, Vol. 56, 79-89 (1995)
0 1995 John Wiley & Sons, Inc. CCC 0021-8995/95/010079-11
intermolecular alcoholysis, intermolecular acido- lysis, and transesterification. Porter and Wang provided a n overview on the compatibility and transesterification of various polymer
blend^.^
Blends of liquid crystalline polymers (LCP) with engineering plastics have become recently a major research effort. T h e motivation was t o utilize their characteristics without incurring the high cost. Kiss’ and Weiss et al.’ discussed the major advantages of these LCP blends. The reduction of the matrix polymer viscosity and the reinforcement of the ma- trix polymer are the two benefits. However, ther- modynamically, the enthalpy of mixing of LCPs with a flexible coil polymer was mostly positive, i.e., en- dothermic, and the entropy of mixing was small and positive. The free energy of mixing obtained was therefore mostly p ~ s i t i v e . ~ Consequently, phase separation occurred for the LCP blends during pro- cessing where high temperature and a high-stress environment existed. If there is strong interaction taking place between the L C P and the matrix poly- mer, a more compatible LCP blend will result. Since transesterification can happen in a polyester blend, 79
80 SU AND WE1
it can be utilized to enhance the miscibility of the liquid crystalline polyester blends.
One issue noted in the Porter and Wang's article is that as transesterification continues blends con- vert first to block copolymers and, finally, to random copolymers, whether a t chain ends or a t mid-chain. Therefore, to have some transesterification between the LCP and the matrix polymers without losing the liquid crystalline characteristics becomes very important. To control the extent of the transester- ification, one has to understand the kinetics of the transesterification.
This article is concerned with the compatibility of the blends resulting from the transesterification between PC and liquid crystalline polyesters. The thermal properties of the blends were analyzed with differential scanning calorimetry. The corresponding blends' morphology was observed with scanning electron microscopy. A nuclear magnetic resonance
spectroscopy study was also carried out to verify the transesterification.
MATERIALS
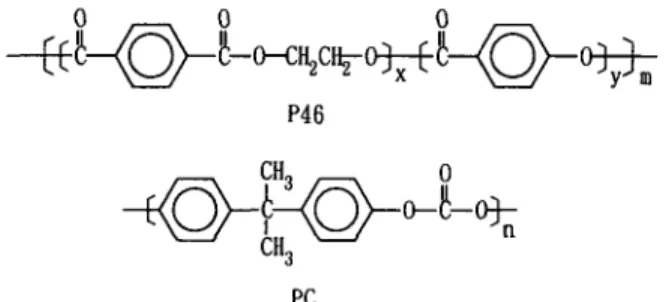
Liquid crystalline poly(oxybenzoate-co-ethylene tere- phthalate) (POB-PET) was synthesized by adding p- acetoxybenzoic acid monomers to poly(ethy1ene tere- phthalate) (PET) following the method described in the literature." The intrinsic viscosity of the P E T used in the synthesis was 0.6 dL/g. The p-acetoxy- benzoic acid monomer was purchased from Shang Hu Corp. The compositions of POB-PET were 401 60, and it was termed P46. P46 exhibited birefrin- gence when it was heated up to 300°C and then cooled down. Polycarbonate (PC) was obtained from the Shin Kwang Corp. The weight-average molec- ular weight of the PC was 17,000. The chemical structures of P46 and PC are shown in Figure 1.
P4 6
PC
Figure 1 The chemical structure of polycarbonate (PC)
and poly(oxybenz0ate-co-ethylene terephthalate) (40/60) (P46).
EXPERIMENTAL Mixing
The powder of the liquid crystalline P46 and PC pellets was dried a t 110°C under vacuum for 8 h prior to the mixing. The mixtures of P46 and PC were put into a Brabender mixer. The speed of the roller blade was 50 rpm. The blends containing 10, 20,30, and 40% P46 were prepared. Three blending temperatures were chosen: 240, 250, and 260°C.
DSC
The thermal analysis of the blends was carried out with a DuPont 2000 differential scanning calorim- eter (DSC). The samples were heated from 30-220°C a t a heating rate of 20°C per min and maintained a t 220°C for 1 min. Then, the samples were air-
cooled down to 30°C. The samples were heated again from 30 to 300°C at the same heating rate. The DSC curves of the samples were taken the second time the samples were heated up a t the heating rate of 20°C per min.
NMR
The blends were dissolved in deuterated chloroform for 4 h; then, the undissolved particles were filtered with a syringe filter. Tetramethylsilane was added to the solution as an internal reference standard, and the liquid mixture was put in a nuclear magnetic resonance (NMR) tube. A Varian Fourier Trans-
formed NMR (unity-300) was used for this study.
S
EMThe blends were put in the DSC and heated up at a heating rate of 40°C per min to 220"C, staying at 220°C for 1 min, and air-cooled to room temperature. The samples were taken out of the DSC and quenched in liquid nitrogen. Then, the samples were fractured and coated with 10 nm-thick gold for scanning electron microscopy (SEM) study.
RESULTS A N D DISCUSSION
The DSC curves of PC, PET (used for synthesis), and P46 are shown in Figure 2. In Figure 2, the glass transition temperatures of PC and P46 are 140.93 and 52.51"C, respectively. There are two melting peaks for P46. The one at 191.56"C represents the diluted melting point of the POB block in P46. The
BLENDS OF LC COPOLYESTER WITH PC. I 81 PC PET P 46 236.73 OC 191.56OC , I I 50 100 150 200 250 300 3 T e m p e r a t u r e ("C) 0 Figure 2 rate of 20°C/min.
The differential scanning calorimetry curve of PC, PET, and P46 a t a heating
other one, a t 236.73"C, is the melting point of the PET block in P46. Therefore, P46 synthesized in our laboratory should be a block copolymer. The DSC curves of the blend containing 30% P46 at dif- ferent blending times are shown in Figure 3. At 240"C, the melting peak of the PET block in P46 disappeared in a 40 min blending time, whereas the melting peak of the POB block did not change even after a 60 min blending time. The glass transition temperatures (T,) of P46 and PC existed for all times. However, the
T,
of P C decreased with the blending time. This indicated that a t 240°C and 60 min, P C and P46 are still incompatible, and the de- crease in theTg
of P C could possibly be caused by the plasticizing effect of P46 on PC." For the blend of the same composition a t a higher temperature, 260"C, the DSC curves are shown in Figure 4. In Figure 4, the melting peak of the PET block dis- appeared in 30 min of blending, and after 60 min of blending, the melting peak of the POB block also disappeared. In the same figure, after the first 10 min of blending, the twoTg's,
59.04 and 123.54"C, are still quite distinctive and far apart. As the blending time increased, the two Tg's shifted towardeach other, and after 60 min of blending, only one
Tg
appeared a t 108.83"C.Based upon the above results, there are two points that can be deduced. First, the reaction between P46
and P C started from the PET block and PC and then continued to the POB block and PC. Second, the blend containing 30% P46 became a compatible system after 60 min of blending at 260°C. Kosfeld et a1.'* carried out solution casting of the P46 and PC mixture and annealed the sample at 270°C for 60 min. He confirmed that there was ester exchange between P46 and P C with the I3C-NMR tech- nique. For this study, a blend consisting of 40% P46 was measured with the 13C - NMR technique. The NMR results are shown in Figure 5(a)-(c). In Figure 5(a), the NMR spectroscopy of PC was used to es- tablish a base-line. Since deuterated chloroform dissolved only P C in the blend, the NMR data in- dicated the chemical structure change of P C during the blending. In Figure 5(b), a blend of a composition of 40% P46 that experienced 10 min of blending a t 260°C showed two major new peaks. T h e first one is a t 165.342 ppm, and it is the ester peak. The sec- ond one is a t 63.072 ppm, and it is the ethylene peak from the PET block in P46. This is direct evidence that the ester group from the PET block in P46 was attached to PC molecules. As the blending time in- creases to 60 min, the two peaks grew much bigger simultaneously. This indicated that the amount of ester exchange increased with time. Therefore, the ester exchange between P46 and P C a t this com- position and in this condition has been confirmed.
82 SU AND WE1 BLENDING TIME BOMIN SOMIN 40MIN 3 0 H I N 20MIN lOMIN 50 100 150 2 0 0 250 300 31 Temperature ("C) Figure 3
after being mixed for different times at 240°C.
The differential scanning calorimetry curves of the blend containing 30% P46
m z U 0 m
2
a7
I BLENDING TIME 6 0 M I N 5 0 M I N 40MIN-
3 0 H I N-
2 0 M I N i O H I N 50 100 150 2 0 0 250 300 3 Temperature ('C) Figure 4after being mixed for different times at 260°C.
84 SU AND WE1 1 2 0 - 1 1 0 - 1 0 0 - 90- 80- 70- l5O
’
A v \ 80- 7 0 - 6 0 - 80‘
I 0 10 20 30 40 50 P46 (wt%)Figure 6 The glass transition temperatures of different P46 compositions in the blends of P46 and P C predicted by the Fox equation and measured after 60 min of blending time.
T P 4 6 3 0 %
PC
= P46
The single Tg of a totally compatible binary poly-
mer blend can be predicted by the Fox equation:
50
‘
0 10 20 30 40 50 60 70
R e a c t i o n Time (min) Figure 7
P C blends mixed a t 24OOC for different times.
The glass transition temperatures of the P46/
l 5 O
r---
140I
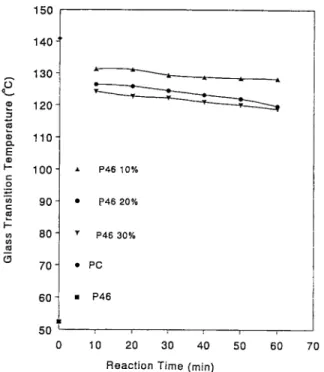
P46 10% P46 20% P46 30% P C 5060”1’6,
, , 0 10 20 30 40 50 60 70 R e a c t i o n T i m e (min) Figure 8P C blends mixed at 250°C for different times.
The glass transition temperatures of the P46/
In eq. (l), W, and W2 are the weight fractions of
polymer 1 and polymer 2, respectively. Tg,l and Tg,2
are the glass transition temperatures of polymer 1
and polymer 2, respectively.
In Figure 6, the Tg‘s of the blends of various P46
compositions after 60 min of blending a t 260°C were
p46300/. 80{ + P4640%
701
pc““1
p46 50 0 10 20 30 40 50 60 70 R e a c t i o n T i m e (min) Figure 9P C blends mixed a t 26OOC for different times.
a
C
BLENDS OF LC COPOLYESTER WITH PC. I 85
b
d
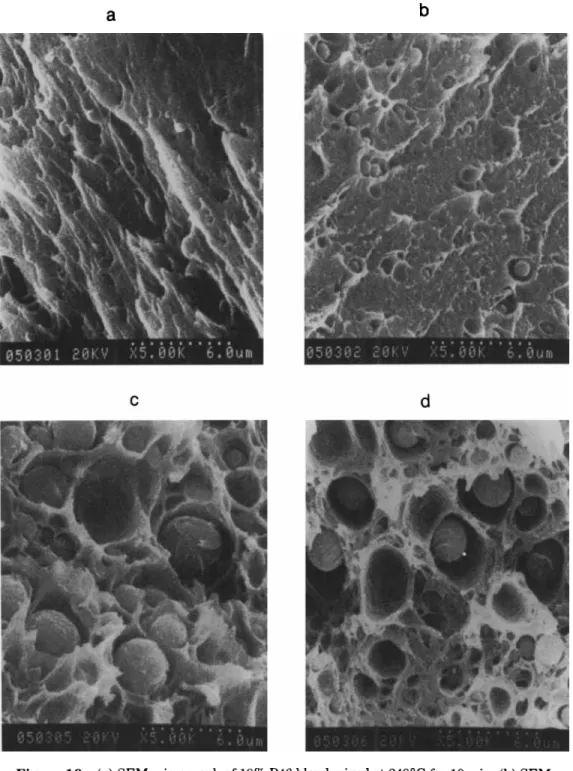
Figure 10 (a) SEM micrograph of 10% P46 blend mixed at 24OOC for 10 min. (b) SEM micrograph of 10% P46 blend mixed at 240°C for 60 min. (c) SEM micrograph of 30% P46 blend mixed at 24OoC for 10 min. (d) SEM micrograph of 30% P46 blend mixed at 240°C for 60 min.
plotted. The predicted T i s were always lower than those of the experimental ones. There are two pos- sible causes: The difference between the experimen- tal and calculated ones is due to the fact that after transesterification the molecules were rearranged. The second one was that it took more time for the
transesterification to be completed at higher P46
concentrations. Sixty minutes of blending was not long enough for the ester exchange reaction to be completed in the 30 and 40% P46 cases.
The Tg of the blends at different blending times is plotted in Figures 7-9. In Figures 7 and 8, at 240
86 SU AND WE1
a
b
C
d
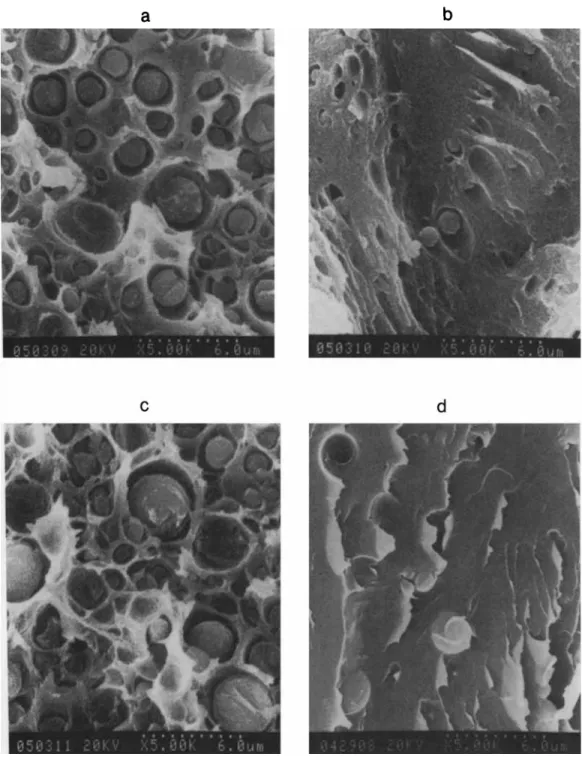
Figure 11 (a) SEM micrograph of 20% P46 blend mixed at 250°C for 10 min. (b) SEM micrograph of 20% P46 blend mixed at 250°C for 60 min. (c) SEM micrograph of 30% P46 blend mixed at 250°C for 10 min. (d) SEM micrograph of 30% P46 blend mixed at 250°C for 60 min.
and 250"C, the decreases in the
Tg
of the blends are due to the plasticization effect of P46 in PC. As the mixing time increases, this effect became more ap- parent. However, when the blending temperature increased to 260°C and P46 composition was more than 20%, the effect of the ester exchange on theTg
took over after 30 min of blending time, as shown in Figure 9.
The micrographs of the blends from the SEM study are shown in Figure 10(a)-(d). From compar- ing the cases of 10 and 30% P46 in the blends at
a
C
BLENDS OF LC COPOLYESTER WITH PC. I 87
b
d
Figure 12 (a) SEM micrograph of 20% P46 blend mixed at 260°C for 10 min. (b) SEM micrograph of 20% P46 blend mixed at 260°C for 60 min. (c) SEM micrograph of 30% P46 blend mixed at 260°C for 10 min. (d) SEM micrograph of 30% P46 blend mixed at 260°C for 60 min.
0.9 micron) and big (about 3 microns) droplets of the change in the blends' morphology between 10 P46 existed in the matrix of PC. When the blending and 60 min of blending is dramatic, as shown in time increased to 60 min, the size of P46 droplets Figure 11. In Figure 11, for the 20% P46 case at reduced somewhat and the number of the smaller 250°C, the size of P46 droplets reduced to about 0.5 droplets increased. This is a result of mixing. micron at 60 min of blending from about 1.5 micron Whereas in the case of 20 and 30% P46 in the blends, at 10 min of blending. Also, after 60 rnin of blending,
88 SU AND WE1
a
b
Figure 13
micrograph of 40% P46 blend mixed at 260°C for 60 min.
(a) SEM micrograph of 40% P46 blend mixed at 260°C for 10 min. (b) SEM
the number of P46 droplets decreased greatly. The
same trend appeared and became almost a single phase for the case of 30% P46 at 260"C, as shown
in Figure 12. To match the NMR spectroscopy of
the blend containing 40% P46, the SEM micro-
graphs of the blend after 10 and 60 min of blending
are shown in Figure 12(a) and (b). In Figure 12(a)
and (b), large P46 droplets (about 1.5 microns) dis-
appeared totally after 60 min of blending at 260°C.
In Figure 13, the same phenomenon appeared for
the case of 40% P46 blend.
CONCLUSIONS
Blends of P46 and PC at various compositions were
studied to understand their compatibility at different blending temperatures and time. Thermal analysis and scanning electron microscopy were used to in- vestigate the physical as well as the transesterifi- cation between the two polymers at different con- ditions.
A t low temperature (240°C) and low P46 com- position (10% or 20%), a progressive shifting of the
glass transition temperature of the PC matrix to
lower temperature was observed. This was attributed to the plasticization of PC by PET-rich P46. How-
ever, as the temperature increased to 250°C or above,
there was a larger drop in the glass transition tem-
perature of the PC matrix. This is due to the ester
exchange reaction between PC and P46. The
transesterification is verified by the NMR in the
case of 40% P46 at 260°C. The drop in the glass
transition temperature of the blend became larger as the blending time was more than 30 min. From
the thermal analysis data, the transesterification took place first between PC and the ester functional
group in the PET block of P46. As the reaction con-
tinued, PC then reacted with the ester group in the
POB block of P46. At 260°C and for the blend con- taining 30% P46, it seemed that the blend became
a compatible system. This is further confirmed through the micrograph observation in the SEM
study. In the SEM micrographs, P46 appeared as droplets in the PC matrix at 240°C. However, at 260°C and after 60 min of blending, almost all P46
droplets disappeared for both the 30 and 40% P46
cases.
The authors appreciated the financial support provided by the National Science Council through Project NSC83- 0405-E009-009. The authors are also deeply indebted to Prof. C. C. Lin for using his synthesis equipment.
REFERENCES
1. M. M. Coleman, C. J. Serman, D. E. Bhagwagar, and D. C. Painter, Polymer, 31, 1188 (1990).
BLENDS OF LC COPOLYESTER WITH PC. I 89
2. A. C. Fernandes, J. W. Barlow, and D. R. Paul, Poly- 3. J. E. Harris, S. H. Goh, D. R. Paul, and J. W. Barlow, 4. A. C. Cruz, J. W. Barlow, and D. R. Paul, Macromol- 5. A. C. Fernandes, J. W. Barlow, and D. R. Paul, J . 6. A. M. Kotliar, J . Polym. Sci. Macromol. Rev., 16, 367 7. R. S. Porter and L. H. Wang, Polymer, 33, 2019
mer, 27, 1799 (1986).
J . Appl. Polym. Sci., 27, 839 (1982). ecules, 12, 726 (1979).
Appl. Polym. Sci., 32, 5357 (1986). (1981).
(1992).
8. G. Kiss, Polym. Eng. Sci., 27, 410 (1987).
9. A. Kohli, N. Chung, and R. A. Weiss, Polym. Eng. 10. T . H . Shinn, J. Y . Chen, and C. C. Lin, J . Appl. Polym. 11. M. K. Nobile, E. Amenderla, and L. Nicolais, Polym. 12. R. Kosfeld, M. Hess, and K. Friedrich, Mater. Chem.
Sci., 29, 573 (1989). Sci., 47, 1233 (1993). Eng. Sci., 29, 244 (1988). Phys., 18, 93 (1987). Received July 6, I994 Accepted September 7, 1994