Structures and properties of fluorinated amorphous carbon films
K. P. Huang, P. Lin, and H. C. Shih
Citation: Journal of Applied Physics 96, 354 (2004); doi: 10.1063/1.1755849
View online: http://dx.doi.org/10.1063/1.1755849
View Table of Contents: http://scitation.aip.org/content/aip/journal/jap/96/1?ver=pdfcov
Published by the AIP Publishing
Articles you may be interested in
Structural, optical, vibrational, and magnetic properties of sol-gel derived Ni doped ZnO nanoparticles
J. Appl. Phys. 114, 033912 (2013); 10.1063/1.4813868
Electronic state modification in laser deposited amorphous carbon films by the inclusion of nitrogen
J. Appl. Phys. 104, 063701 (2008); 10.1063/1.2977718
Comparative study of the effects of thermal treatment on the optical properties of hydrogenated amorphous silicon-oxycarbide
J. Appl. Phys. 102, 024302 (2007); 10.1063/1.2753572
Spectroscopic properties of nitrogen doped hydrogenated amorphous carbon films grown by radio frequency plasma-enhanced chemical vapor deposition
J. Appl. Phys. 89, 7924 (2001); 10.1063/1.1371268
Structural properties of fluorinated amorphous carbon films
J. Appl. Phys. 87, 621 (2000); 10.1063/1.371910
Structures and properties of fluorinated amorphous carbon films
K. P. Huang and P. Lin
Department of Materials Science and Engineering, National Chiao-Tung University, Hsinchu, Taiwan 300, Republic of China
H. C. Shiha)
Department of Materials Science and Engineering, National Tsing-Hua University, Hsinchu, Taiwan 300, Republic of China
共Received 22 September 2003; accepted 5 April 2004兲
Fluorinated amorphous carbon (a-C:F) films were deposited by radio frequency bias assisted microwave plasma electron cyclotron resonance chemical vapor deposition with tetrafluoromethane (CF4) and acetylene (C2H2) as precursors. The deposition process was performed at two flow ratios
R⫽0.90 and R⫽0.97, where R⫽CF4/(CF4⫹C2H2). The samples were annealed at 300 °C for 30 min. in a N2 atmosphere. Both Fourier transform infrared and electron spectroscopy for chemical analyzer were used to characterize the a-C:F film chemical bond and fluorine concentration, respectively. A high resolution electron energy loss spectrometer was applied to detect the electronic structure. The higher CF4 flow ratio (R⫽0.97) produced more sp3linear structure, and it made the a-C:F film smoother and softer. A lifetime of around 0.34s and an energy gap of⬃2.75 eV were observed in both the as-deposited and after annealing conditions. The short carriers lifetime in the
a-C:F film made the photoluminescence peak blueshift. The annealing changed both the structure
and composition of the a-C:F film. The type of fluorocarbon bond and electronic structure characterized the mechanical and physical properties of a-C:F film. © 2004 American Institute of
Physics. 关DOI: 10.1063/1.1755849兴
I. INTRODUCTION
Future semiconductor devices in integrated circuits will soon be developed into a size as small as 0.07 m. There-fore, a lower dielectric material should be used to lessen the degree of RC delay.1,2 Conventional low dielectric共low k兲 materials, like fluorinated silicate glass, methyl silsesquiox-ane, black diamond, etc., will not be able to meet the require-ments of the future semiconductor devices. The new low k materials need to be electrically insulating and to have a low dielectric constant, chemical inertness, low moisture absorp-tion, high thermal stability, high mechanical strength, and good adhesion to the neighboring layers. Recently, a-C:F films deposited at room temperature by plasma-assisted
chemical-vapor-deposition 共CVD兲 showed promising
results.10,11,32 Hence, the a-C:F films have been considered as one potential candidate for intermetal dielectric materials applied in the next generation ultra-large scale integration devices.3–7
The a-C:F film with a low dielectric constant of about 1.5–2.0 can be deposited by various methods of plasma-based chemical vapor deposition.8 –11The microwave plasma electron cyclotron resonance chemical vapor deposition 共ECR-CVD兲 is one of the most promising deposition meth-ods for producing the a-C:F films, because the ECR-CVD can generate a high density as well as a relatively large area of plasma. In addition, the depositing films have a fine sur-face planarity, good gap-filling capability, and uniformity as
well. The microwave plasma ECR-CVD system described in this article was used to produce reactive chemical species, and the rf bias assisted the precursor to impinge on the sub-strate, resulting in the deposition of the film. Both C2H2and CF4 were the precursors used for the synthesis of the a-C:F films. The C2H2gas has a high C/H ratio, and could contrib-ute enough carbon source to support a film network to in-crease the deposition rate.12The CF4gas has a high F/C ratio enough to supply sufficient fluorocarbons to raise the con-centration of fluorine in the a-C:F film. The CF4 plasma contains mainly CF3⫹ ions, F neutrals, CFn radicals, and
negative ion species. Fluorine atoms control not only the concentration of CFn radicals through the gas-phase
reac-tions but also the surface reacreac-tions.13–17
In this article, we report on the chemical and physical properties of the fluorinated amorphous carbon film prepared by ECR-CVD, at two CF4 flow ratios R⫽0.90 and R ⫽0.97, where R is CF4/关CF4⫹C2H2兴. This is to compare the difference between the as-deposited film and the film after annealing at 300 °C for 30 min. For this purpose we used the analytical instruments as follows: Fourier transform infrared absorption spectrophotometer共FTIR兲, electron spec-troscopy for chemical analyzer共ESCA兲, high resolution elec-tron energy loss spectrometer共HREELS兲, electron spin reso-nance spectrometer 共EPR兲, photoluminescence spectrometer 共PL兲, ultraviolet/visible spectrophotometer 共UV/VI兲, field emission scanning electron microscope共FESEM兲, pulse laser spectrometer and atomic force microscope 共AFM兲. The sp2 content and the fluorine concentration would affect the pho-toluminescence lifetime, as well as energy band gap of the
a-C:F films. With the rise of the temperature, the dangling
a兲Author to whom correspondence should be addressed; electronic mail:
354
0021-8979/2004/96(1)/354/7/$22.00 © 2004 American Institute of Physics
bond density increases, resulting from the growing numbers of unpaired spins in the defects in the films.
II. EXPERIMENT
Both CF4 and C2H2 gases were mixed as precursors to deposit a-C:F films on p-type Si wafers by ECR-CVD. The plasma was produced by mixing both microwave共2.45 GHz兲 and radio frequency共13.56 MHz兲. The working pressure was fixed at 20 mtorr. Microwave power and rf bias were fixed at 600 W and ⫺200 V, respectively. The C2H2 flow rate was varied from 3 to 10 sccm while CF4 flow rate was fixed at 100 sccm. The plasma chemistry was examined, by the op-tical emission spectroscopy 共OES兲, the Model ST121 from Princeton Instrument Inc. The a-C:F films were annealed in a pure nitrogen atmosphere at 300 °C. The film thickness was measured by Hitachi 5000 type FESEM. The film morphol-ogy was observed with a Digital Instrument NS3a controller at a D3100 stage AFM while the hardness was measured by a Nano Scope E Hysitron 35 from Digital Instruments. The chemical bonds of the films were identified by FTIR and ESCA. The ESCA spectra were collected with an ESCA spectrometer using a Mg K x-ray anode operating at 400 W and 15 kV. A Gatan GIF 2000 HREELS was used to quantify the mass of s p2 in the films. The dangling bonds of the
a-C:F films were measured by EPR. The fluorescence was
measured by the PL apparatus using a helium-cadmium共He– Cd兲 laser 共⫽325 nm兲 as the excitation source. The optical band gap was characterized by UV/VI共HP 8453兲. An Exci-mer pulse laser 共⫽193 nm兲 was used to evaluate photolu-minescence lifetime.
III. RESULTS AND DISCUSSION
A. Plasma species and mechanical properties
The plasma composition depends on various chemical pathways in the plasma, as well as the plasma parameters, such as electron temperature, electron density, gas flow rate, and degree of ionization. To illustrate how these collisions could result in the radical production, Table I shows a set of reactions which is the possible sheath radical production in the C2H2 and CF4 plasma.18 –21,48Figure 1 shows the optical emission spectra 共OES兲 of the ECR- excited plasma. There are C2, C3, CF2, CH, F2, H2, and HF radical species, and C2⫺, F2⫹, and HF⫹ ionic species in the plasma.22 The C2 radicals will construct the main skeleton of the a-C:F films, while the fluorine atoms will be replaced by hydrocarbons to form fluorocarbon bonds or HF bonds. Figure 2 shows the CF and CF2 species found in the plasma with the spectra at wavelength range 200–300 nm. The F2, F2⫹, CF, CF2, and CF3 radicals are both sinks and sources23 at the same time during the deposition of the a-C:F films. The spectrum of the
R⫽0.97 plasma has higher intensity than that of the R ⫽0.90 plasma. Therefore, it is clearly differentiated by the deposition rates of 55.5 and 5.83 nm/min obtained at R ⫽0.90 and R⫽0.97, respectively. In addition, the higher gas flow ratio will supply more fluorine and fluorocarbon radi-cals, which would etch the weaker bonds and form the stron-ger s p3 fluorocarbon bonds in the a-C:F films.
The topography of a-C:F films can be evaluated by AFM. The surface roughness 共root mean square兲 of the
a-C:F films is less than 0.8 nm, which assists to mechanical
and electric applications. The relevant data is listed in Table II. The higher flow ratio (R⫽0.97) generates more linear fluorocarbon bonds, which will be annihilated after anneal-ing. In contrast, the crosslinking bonds will be increased as the flow ratio is reduced. Consequently, the hardness of the
a-C:F films depend on the fluorine content and the thermal
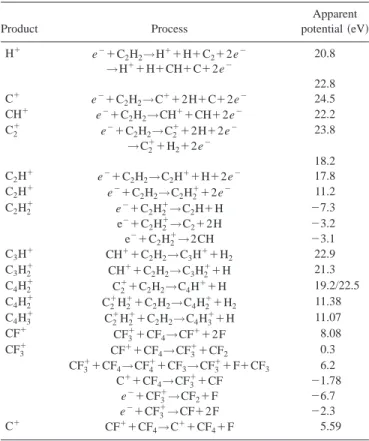
TABLE I. Primary electron collisions.
Product Process Apparent potential共eV兲 H⫹ e⫺⫹C2H2→H⫹⫹H⫹C2⫹2e⫺ →H⫹⫹H⫹CH⫹C⫹2e⫺ 20.8 22.8 C⫹ e⫺⫹C2H2→C⫹⫹2H⫹C⫹2e⫺ 24.5 CH⫹ e⫺⫹C2H2→CH⫹⫹CH⫹2e⫺ 22.2 C2⫹ e⫺⫹C2H2→C2⫹⫹2H⫹2e⫺ →C2⫹⫹H 2⫹2e⫺ 23.8 18.2 C2H⫹ e⫺⫹C2H2→C2H⫹⫹H⫹2e⫺ 17.8 C2H⫹ e⫺⫹C2H2→C2H2⫹⫹2e⫺ 11.2 C2H2⫹ e⫺⫹C2H2⫹→C2H⫹H ⫺7.3 e⫺⫹C2H2⫹→C2⫹2H ⫺3.2 e⫺⫹C2H2⫹→2CH ⫺3.1 C3H⫹ CH⫹⫹C2H2→C3H⫹⫹H2 22.9 C3H2⫹ CH⫹⫹C2H2→C3H2⫹⫹H 21.3 C4H2⫹ C2⫹⫹C2H2→C4H⫹⫹H 19.2/22.5 C4H2⫹ C2⫹H⫹2⫹C2H2→C4H2⫹⫹H2 11.38 C4H3⫹ C2⫹H⫹2⫹C2H2→C4H3⫹⫹H 11.07 CF⫹ CF3⫹⫹CF4→CF⫹⫹2F 8.08 CF3⫹ CF⫹⫹CF4→CF3⫹⫹CF2 0.3 CF3⫹⫹CF4→CF4⫹⫹CF3→CF3⫹⫹F⫹CF3 6.2 C⫹⫹CF4→CF3⫹⫹CF ⫺1.78 e⫺⫹CF3⫹→CF2⫹F ⫺6.7 e⫺⫹CF3⫹→CF⫹2F ⫺2.3 C⫹ CF⫹⫹CF4→C⫹⫹CF4⫹F 5.59
FIG. 1. Optical emission spectra obtained in C2H2 and CF4 mixed gas
discharge at 600 W source power ⫺200 V rf bias, and 20 m Torr in the ECR-CVD.
355
J. Appl. Phys., Vol. 96, No. 1, 1 July 2004 Huang, Lin, and Shih
treatment. Therefore the higher CF4 flow ratio (R⫽0.97) produced more s p3 linear structure, which made the a-C:F films smoother and softer.
B. Chemical bonding
FTIR is a very powerful instrument to detect the chemi-cal structure of the a-C:F film, and it can give information for films as thick as of ⬃1 m. Figure 3 shows the FTIR spectroscopy of the a-C:F films prepared at R⫽0.97 and R ⫽0.90. There are only fluorocarbon bonds present at the vi-brational absorbance peaks, without any hydrocarbon bonds on the spectrum. It indicates that all of the hydrogen atoms reacted with fluorine atoms during the plasma reactions, and consequently resulted in HF species in the plasma. The ab-sorption peaks between carbon and fluorine in the FTIR are summarized in Table III.24 –27 The obvious difference be-tween R⫽0.97 and 0.90 is that the a-C:F films formed at
R⫽0.90 do not have CF3 980 cm⫺1 absorption peak. The major peaks of the a-C:F film (R⫽0.97) are – CFCF3, CF2, and C⫽CF stretches, whereas CF2 and C⫽CF stretches are the main peaks of the a-C:F films (R⫽0.90). The peak in-tensity of each as-deposited a-C:F film is stronger than that of each film after annealing 共at 300 °C兲. Moreover, Fig. 3 shows that the intensity of the peaks for after annealing
a-C:F films is lower than that of the as-deposited film from
730 to 1350 cm⫺1, which implies that there are plenty of CF2, CF3, and CF–CF3bonds that will be broken in the film after annealing. However, the spectra of the a-C:F films
pre-pared at R⫽0.90 are almost the same in both conditions: as-deposited and after annealing. Hence the structure of the
R⫽0.90 film is more stable than the one prepared at R ⫽0.97.
C. ESCA analysis
ESCA is another powerful instrument for detecting the chemical structure of the a-C:F films, and is also a surface sensitive instrument providing the local chemical bonds of only the first ⬃50 Å of the thin film. The C 1s spectrum of
a-C:F film could be deconvoluted into five Gaussian peaks
corresponding to CF3 共293.2 eV兲, CF2 共290.95 eV兲, CF 共288.8 eV兲, C–CFx 共286.5 eV兲, and C–C or C–H 共284.9
eV兲, as shown in Fig. 4. The absolute binding energies of CF3, CF2, CF, C–CFx and C–C fall within the range, as
listed in the published literature,28 –34valuing from 292.6 to 294, 290.3 to 292, 287.8 to 289.3, 285.5 to 287.3, and 283.4 to 285 eV, respectively. From the deconvolution of the C 1s
FIG. 2. Comparisons of the plasma optical emission spectra for R⫽0.97 and
R⫽0.90.
TABLE II. Comparisons of the properties of R⫽0.90 and 0.97 amorphous fluorinated carbon films as-deposited and after being annealed at 300 °C.
sp2% 共%兲 Lifetime 共s兲 Eg 共eV兲 Roughness 共nm兲 Hardness 共GPa兲 R⫽0.90 after annealed 41.5 0.46 2.48 0.79 0.59 R⫽0.90 as-deposited 39.3 0.43 2.51 0.78 0.74 R⫽0.97 after annealed 32.4 0.36 2.68 0.47 0.35 R⫽0.97 as-deposited 27.3 0.34 2.75 0.57 0.44
FIG. 3. FTIR spectroscopy of the a-C:F film,共a兲 as-deposited at R⫽0.97,
共b兲 after being annealed at R⫽0.97, 共c兲 as-deposited at R⫽0.90, 共d兲 after
being annealed at R⫽0.90.
TABLE III. Summary of FT-IR absorption peaks.
Wave number共cm⫺1兲 Assignment
505 CF2rocking 553 CF2bending 635 CF2wagging 730–745 CF–CF3 980 CF3 1030 and 1070 CF 1120–1350 CF3group 1160 CF2symmetric stretch
1220 and 1450 CF2asymmetric stretch
1300–1340 CF⫽CF2 1325–1365 CF3CF2 1340 CF stretch 1608 –1700 C⫽CF stretch 1700 C⫽C stretch 1720 F2C⫽C⬍ 1860 F2C⫽CF
spectrum, fluorine-to-carbon ratios共F/C兲 can easily be calcu-lated by the integrated intensity of the various components of the C 1s spectrum,35according to
F/C⫽共3ICF3⫹2ICF2⫹1ICF兲/IC 1s
where Ibond is the photoemission intensity 共i.e., area under each Gaussian curve兲 originating from a specific bond. Fig-ure 5 and Table IV show the results from the C 1s spectrum deconvolution. The fluorine concentration of the R ⫽0.97 a-C:F film is higher than that of the R⫽0.90 film, and the main peak of the R⫽0.97 a-C:F film is the CF2bond in both as-deposited and after annealing conditions. In con-trast to the CF2 bond of the R⫽0.97 a-C:F film, the C–CFx
bond of the R⫽0.90 film is the main peak in the as-deposited condition and the C–C bond is the main peak after anneal-ing. The mass of the C–C bond falls as the CF4 flow ratio rises. When we increase the flow ratio R, the CF2 concentra-tion will grow significantly. Evidently, the C 1s deconvolu-tion varies in both R⫽0.97 and 0.90 films in as-deposited
and after-annealed conditions. The peak areas for C–CFx,
CF, CF2, and CF3shrink with the R⫽0.90 a-C:F film being annealed, but the amount of the C–C peak area increases relatively. The peak areas for CF, CF2, and CF3 decrease when the R⫽0.97 a-C:F film is annealed, but the C–C and C–CFx peak areas increase relatively. This is because the a-C:F film will break a lot of weaker bonds in the a-C:F
film, and release fluorocarbon molecules during annealing. Consequently, the fluorine concentration will decrease after the a-C:F film is annealed.
D. HREELS analysis
The HREELS is the most reliable method for quantify-ing the s p2 bond fraction. The a-C:F films often comprise a combination of two types of bonding: s p3 and s p2 type hy-bridizations. The bonding types can be analyzed by studying the K-shell electron-energy-loss 共EELS兲 spectrum of C 1s. Figure 6 shows the HREELS spectra in the carbon K-edge region after the background is removed. The steep rise at 287.4 eV in the diamond spectrum of the 100% s p3 bonds corresponds to the onset of the 1s→* transitions, and the peak position at about 285 eV corresponds to the dangling bonds on the surface and/or to the defects in the crystal. The graphite spectrum, which is 100% s p2 bonds structure, shows a clear peak at 285 eV and a steep rise at 289.4 eV
FIG. 4. Deconvoluted C 1s spectrum of a-C:F film at R⫽0.97 as-deposited obtained by ESCA analysis.
FIG. 5. Deconvolution result of the a-C:F film C 1s spectrum for R
⫽0.97 and R⫽0.90 at as-deposited and after being annealed obtained by
ESCA analysis.
TABLE IV. ESCA chemical composition 共at. %兲 of the a-C:F films as-deposited and after being annealed at 300 °C.
CF4 Flow ratio C–C C–CFx C–F1 CF2 CF3 F% R⫽0.97 共as-deposited兲 6.3 20.9 25.3 32.9 14.5 57.4 R⫽0.97 共after annealed兲 9.4 25.4 23.1 28.8 13.3 54.7 R⫽0.90 共as-deposited兲 22.7 31.0 21.3 16.5 8.5 44.4 R⫽0.90 共after annealed兲 37.5 27.6 19.3 10.8 4.8 35.6
FIG. 6. Comparisons of the HREELS spectra in the carbon K-edge region.
357
J. Appl. Phys., Vol. 96, No. 1, 1 July 2004 Huang, Lin, and Shih
corresponding to the 1s→* and to the onset of 1s→* transitions, respectively.36,37The a-C:F film spectrum almost matches a diamondlike carbon (a-C or a-C:H) one.36 –38 Moreover, both the fluorinated amorphous carbon and dia-mondlike carbon films are s p3 and s p2 mixed structures.
The method for qualifying the s p2 bonding fraction in the a-C:F films from the electron-energy-loss spectra is de-scribed by Berger et al.36 Here, the area under the 1s→* peak of the a-C:F film is normalized to a energy window, referring to an equivalent ratio for graphite, which has 100% s p2bonding. The mathematical principle for quantify-ing the edge is to obtain a ratio of the two areas, one of which is the standard, as shown in the following formula:
f⫽Ig*Iu共⌬E兲 Iu*Ig共⌬E兲
共1兲 where f is the ratio between the two * peaks, I* is the integral 1s→*transition of graphite, and I(⌬E) is the in-tegrated counts for normalizing the energy windows. The superscripts g and u denote the graphite and unknown spec-tra respectively.
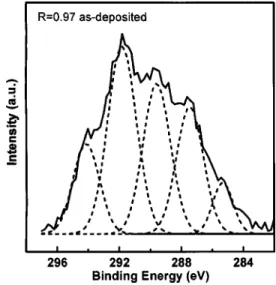
Figure 7 shows the carbon K-edge fitting of the R ⫽0.97 as-deposited amorphous carbon films. There are three Gaussian peaks in the spectra which are centered at 285, 287, and 293 eV, and these peaks indicate the 1s→*transition, the molecular transition, and 1s→* transitions respectively.36,39– 41 The quantity of the s p2 bonds in the a-C:F film, estimated according to Eq.共1兲, is listed in Table
II. The s p2 fraction decreases with an increasing CF4 flow ratio. At a higher CF4 flow ratio, more fluorine atoms are supplied, each of which in turn can be bonded with carbon. This reaction is similar to the H atom with its ability to stabilize the dangling bond in amorphous carbons.42 It is generally believed that the fluorine atom helps to the increase of the s p3 bonding components in the a-C:F film. Further-more, the s p3 fraction decreases when the a-C:F film is an-nealed. The s p3bonds of the diamondlike carbon belong to a metastable phase,43– 45so the magnitude of s p2 bonds of the
a-C:F film will be enlarged after annealing.
When comparing the mechanical properties, we find that the R⫽0.97 films are smoother and softer than the R⫽0.90 films. Therefore we believe that the s p3 bonds in the film must be in a linear form rather than in the network one found in the a-C:F films. With such large quantities of s p3 bonds in diamondlike films, the hardness is usually over 20 GPa.47– 49
E. Dangling bond
The dangling bond defects, which give rise to states around the Fermi level, are important in electronic materials as they usually control the recombination of carriers. The states can be either diamagnetic or paramagnetic.41The den-sity of paramagnetic defects can be easily measured by EPR. The range of dangling bond densities of a-C:F films at R ⫽0.97 and R⫽0.90 as-deposited is ⬃2⫻1019– 5 ⫻1020spins/cm3 from 4 to 423 K. However, after being nor-malized by the Curie’s law, the range of dangling bond den-sities is⬃5.5⫻1018– 5.5⫻1019as shown in Fig. 8. The hop-ping rate of a dangling bond electron is lower at a low temperature.46 As the temperature rises, the unpaired spins will increase considerably due to the electron hopping from the defects. Furthermore, numerous nanovoids exist in the
a-C:F film.11These nanovoids are supposed to enhance dan-gling bond density with the rise of temperature. The higher fluorine concentration has lower dangling bond density in the
a-C:F film, which means that the fluorine atoms and ions can
easily react with the dangling bonds of the carbon frame during the CVD deposition. In addition, after annealing the
a-C:F films, the leakage current at a higher flow ratio of a-C:F films would be less than that at a lower flow ratio.11
F. Optical characteristics
The a-C:F film has a broadband luminescence character-istic of an amorphous semiconductor with broad band tails. Figure 9 shows PL spectra for R⫽0.97 and R⫽0.90 a-C:F films in both as-deposited and after annealing conditions. The PL peak band is like rough Gaussian peak, and changes
FIG. 7. Carbon K-ionization edge spectra obtained from R⫽0.97 as-deposited. The fit obtained when using three Gaussian peaks centered at
285, 287, and 293 eV. FIG. 8. Dangling bond density of the a-C:F films at R⫽0.97 and R
⫽0.90 as-deposited.
with the CF4 flow ratio. The PL peak site tends to be blue-shifted as the fluorine concentration increases. It is also no-ticed that annealing helps to reduce the full width at half maximum of the PL spectra. The broad spectrum results from structural disorder of the a-C:F film. Fluorinated amor-phous carbon films after the annealing treatment will be structurally relaxed because the disappearance of electron-hole pairs lower the probability of the radiative recombination.41The higher fluorine concentration enhances a higher s p3 content in the film, so the as-deposited R ⫽0.97 film tends to blueshifted.
The spectrophotometry of the UV/VI bands of the a-C:F films is plotted in Fig. 10. The optical band gap listed in Table II was determined by the Tauc mode.50Since the C–F bond energy 共102 kcal/mole兲 is higher than the C–C bond energy 共80 kcal/mole兲, the greater number of fluorocarbon bonds in the a-C:F film produced at higher CF4 flow ratios gives rise to a higher optical band gap. In addition, the C⫽C bonds or graphitelike s p2 structures will lower the optical
band gap,51 so the optical band gap of the as-deposited
a-C:F film is larger than the one after annealing. This is also
the reason why the R⫽0.97 film has less blueshift than the
R⫽0.90 film. The optical properties are closely correlated to
the amount of fluorine incorporated into the films. The in-crease in the optical band gap energy indicates that the fluo-rine incorporated into the a-C:F film has modified the chemical structure of the film towards the higher s p3 bond-ing fraction.51These properties are similar to those of hydro-genated amorphous carbon.48,52,53
Excimer pulse laser spectrometer was used to measure the lifetime共兲. The results are listed in Table II. The photo-luminescence lifetime is directly proportional to both fluo-rine concentration and s p2% for as-deposited films and after annealing. The lifetime is longer in a-C:F(10⫺7s) than in
a-C:H(10⫺8s),54,55 but is much shorter than in
a-Si:H(10⫺3s).56,57 The short lifetime of carriers reduces their energy relaxation into lower energy states and then in-creases the average energy of carriers in the band tail state.58 The short photoluminescence lifetime causes a blueshift of the lowest energy accessible to carriers for radiative recom-bination in the band tail state.59 Therefore, we can observe the pronounced blueshift of the PL peak in a-C:F film, be-cause of the short carrier lifetime.
IV. CONCLUSIONS
The s p3 bond ratio can be increased by the fluorine con-centration through an increase in the fluorocarbon flow ratio. The FTIR and ESCA results reveal that the structure of the
a-C:F films prepared at various CF4flow ratios are different. Furthermore, the result of EELS reveals that annealing the films can increase the carbon double bond structure in the
a-C:F films. The higher CF4 flow ratios produce more s p3 linear structure, and make the a-C:F film smoother and softer. There is a lot of structural variation after annealing; therefore, the electrical and optical properties of the a-C:F films are different from these of the as-deposited films. The higher fluorine concentration will promote a greater number of fluorine carbon bonds in the film and therefore produce a higher energy band gap. Furthermore, annealing will induce the s p2 structure in the a-C:F film, which will extend the photoluminescence lifetime. The short carriers lifetime in the
a-C:F film makes PL peak blue-shift.
ACKNOWLEDGMENTS
This work is supported by Dr. S. Roth, Max-Planck In-stitute Stuttgart, and the National Science Council of the Re-public of China under No. NSC 91-2219-E009-028.
1M. T. Bohr, Solid State Technol. 39, 105共1996兲.
2Y. Matsubara, K. Kishimoto, K. Endo, M. Iguchi, T. Tasumi, H. Gomi, T.
Horiuchi, E. Tzou, M. Xi, L. Y. Cheng, D. Tribula, and F. Moghadam, IEEE IEDM 31, 841共1998兲.
3J. A. Theil, F. Mertz, M. Yairi, K. Seaward, G. Ray, and G. Kooi, in
Low-Dielectric Constant Materials, edited by C. Case, P. Kohl, T.
Kikkawa, and W. W. Lee, Mater. Res. Soc. Symp. Proc. No. 476 共Mate-rials Research Society, Pittsburgh, 1997兲, p. 31.
4
T. W. Mountsier, J. A. Saqmuels, and R. S. Swope, in Low-Dielectric
Constant Materials, edited by C. Chiang, P. S. Ho, T. M. Lu, and J. T.
FIG. 9. PL spectra produced at R⫽0.97 and at R⫽0.90 of a-C:F films for both as-deposited and after being annealed at 300 °C.
FIG. 10. UV/VI spectra of both R⫽0.97 and R⫽0.90 of the a-C:F films as-deposited and after being annealed at 300 °C.
359
J. Appl. Phys., Vol. 96, No. 1, 1 July 2004 Huang, Lin, and Shih
Wetzel, Mater. Res. Soc. Symp. Proc. No. 511共Materials Research Soci-ety, Pittsburgh, 1998兲, p. 259.
5K. Endo, T. Tatsumi, Y. Matsubara, and T. Horiuchi, Jpn. J. Appl. Phys.,
Part 1 37, 1809共1998兲.
6N. H. Hendricks, Mater. Res. Soc. Symp. Proc. 443, 3共1997兲. 7
T. W. Mountsier and D. Kumar, in Low-Dielectric Constant Materials, edited by A. Lagendijk, H. Treichel, K. J. Uram, and A. C. Jones, Mater. Res. Soc. Symp. Proc. No. 443共Materials Research Society, Pittsburgh, 1998兲, p. 41.
8K. Endo and T. Tatsumi, J. Appl. Phys. 78, 1370共1995兲. 9
K. Endo, T. Tatsumi, Y. Matsubara, and T. Horiuchi, Jpn. J. Appl. Phys., Part 1 37, 1809共1998兲.
10H. Yokomichi, T. Hayashi, T. Amano, and A. Masuda, J. Non-Cryst. Solids 227–230, 641共1998兲.
11K. P. Huang, P. Lin, and H. C. Shih, Jpn. J. Appl. Phys., Part 1 42, 3598
共2003兲.
12P. S. Andry, P. W. Pastel, and W. J. Varhue, J. Mater. Res. 11, 221共1996兲. 13G. Chuge and J. P. Booth, J. Appl. Phys. 85, 3952共1999兲.
14W. Schwarzenbach, G. Cunge, and J. P. Booth, J. Appl. Phys. 85, 7562
共1999兲.
15
K. Teii, M. Hori, M. Ito, T. Goto, and N. Ishii, J. Vac. Sci. Technol. A 18, 1共2000兲.
16L. G. Jacobsohn, D. F. Franceschini, M. E. H. Maia da Costa, and F. L.
Freire, Jr., J. Vac. Sci. Technol. A 18, 2230共2000兲.
17
K. Sasaki, H. Furukawa, K. Kadota, and C. Suzuki, J. Appl. Phys. 88, 5585共2000兲.
18M. Stacey, Advances in Fluorine Chemistry共Butterworths, Washington,
1965兲.
19
F. H. Field and J. L. Franklin, Electron Impact Phenomena and the
Prop-erties of Gaseous Ions共Academic Press, New York, 1970兲.
20R. J. M. N. Snijkers, Ph.D. Thesis, Eindhoven University of Technology,
The Netherlands, 1993.
21J. W. A. M. Gielen, M. C. M. van de Sanden, and D. C. Schram, Thin
Solid Films 271, 56共1995兲.
22R. W. B. Pearse and A. G. Gaydon, The Identification of Molecular
Spec-tra, 4th Ed.共Wiley, New York, 1976兲.
23Da Zhang and M. J. Kushner, J. Vac. Sci. Technol. A 18, 2661共2000兲. 24
Norman B. Colthup, Lawrence H. Daly, and Stephen E. Wiberley,
Intro-duction to Infrared and Raman Spectroscopy, 3rd Ed.共Academic Press,
Boston, 1990兲, Chap. 12.
25M. Inayoshi, M. Hori, T. Goto, M. Hiramatsu, M. Nawata, and S. Hattori,
J. Vac. Sci. Technol. A 14, 1981共1996兲.
26
D. C. Marra and E. S. Aydil, J. Vac. Sci. Technol. A 15, 2508共1997兲.
27H. Yokomichi and A. Masuda, Vacuum 59, 771共2000兲.
28M. A. Butler, R. J. Buss, and A. Galuska, J. Appl. Phys. 70, 2326共1991兲. 29K. Endo and T. Tatsumi, J. Appl. Phys. 78, 1370共1995兲.
30A. M. Hynes, M. J. Shenton, and J. P. S. Badyal, Macromolecules 29,
4220共1996兲.
31S. F. Durrant, S. G. C. Castro, L. E. Bolı´var-Marinez, D. S. Galva˜o, and
M. A. B. de Moraes, Thin Solid Films 304, 149共1997兲.
32Y. Ma, H. Yang, J. Guo, C. Sathe, A. Agui, and J. Nordgren, Appl. Phys.
Lett. 72, 3353共1998兲.
33M. Schaepkens, T. E. F. M. Standaert, N. R. Rueger, P. G. M. Sebel, G. S.
Oehrlein, and J. M. Cook, J. Vac. Sci. Technol. A 17, 26共1999兲.
34S. Agraharam, D. W. Hess, P. A. Kohl, and S. A. Bidstrup, J. Vac. Sci.
Technol. A 17, 3265共1999兲.
35
R. d’Agostino, editor, Plasma Deposition, Treatment, and Etching of
Poly-mers共Academic Press, Boston, 1990兲, p. 146.
36
S. D. Berger, D. R. McKenzie, and P. J. Martin, Philos. Mag. Lett. 57, 285
共1988兲.
37
R. G. Pregliasco, G. Zampieri, H. Huck, E. B. Halac, M. A. R. de Ben-yacar, and R. Righini, Appl. Surf. Sci. 103, 261共1996兲.
38
P. J. Fallon, V. S. Veerasamy, C. A. Davis, J. Robertson, G. A. J. Amara-tunga, W. I. Milne, and J. Koskinen, Phys. Rev. B 48, 4777共1993兲.
39
A. P. Hitchcock, D. C. Newbury, I. Ishii, J. Sto¨hr, J. A. Horsley, R. D. Redwing, A. L. Johnson, and F. Sette, J. Chem. Phys. 85, 4849共1986兲.
40
R. McLaren, S. A. C. Clark, I. Ishii, and A. P. Hitchcock, Phys. Rev. A 36, 1683共1987兲.
41
S. R. P. Silva, J. Robertson, Rulsli, G. A. J. Amaratunga, and J. Schwan, Philos. Mag. B 74, 369共1996兲.
42
H. Efstathiadis, Z. Akkerman, and F. W. Smith, J. Appl. Phys. 79, 2954
共1996兲.
43
D. R. McKenzie, D. Muller, and B. A. Pailthorpe, Phys. Rev. Lett. 67, 773
共1991兲.
44
D. R. McKenzie, J. Vac. Sci. Technol. B 11, 1928共1993兲.
45J. Robertson, Diamond Relat. Mater. 3, 361共1994兲.
46H. Yokomichi and K. Morigaki, J. Non-Cryst. Solids 266–269, 797
共2000兲.
47M. Weiler, J. Roberson, S. Sattel, V. S. Veerasamy, K. Jung, and H.
Ehrhardt, Diamond Relat. Mater. 4, 304共1995兲.
48M. Weiler, S. Sattel, T. Giessen, K. Jung, H. Ehrhardt, V. S. Veerasamy,
and J. Robertson, Phys. Rev. B 53, 1594共1996兲.
49R. G. Lacerda, F. C. Marques, and Freire, Jr., Diamond Relat. Mater. 8,
495共1999兲.
50Richard Zallen, The Physics of Amorphous Solids, 2nd Ed.共Wiley, New
York, 1998兲.
51A. Weber, R. Po¨ckelmann, and C.-P. Klages, J. Vac. Sci. Technol. A 16,
2120共1998兲.
52Th. Frauenheim, G. Jungnickel, U. Stephan, P. Blaudeck, S. Deutschmann,
M. Weriler, S. Sattel, K. Jung, and H. Ehrhardt, Phys. Rev. B 50, 7940
共1994兲.
53
M. Hakovirta, X. M. He, and M. Nastasi, J. Appl. Phys. 88, 1456共2000兲.
54Rusli, Gehan A. J. Amaratunga, and J. Roberson, Phys. Rev. B 53, 16 306
共1996兲.
55W. Lormes, M. Hundhausen, and L. Ley, J. Non-Cryst. Solids 227–230,
570共1998兲.
56W. Siebert, R. Carius, W. Fuhs, and K. Jahn, Phys. Status Solidi B 140,
311共1987兲.
57S. Liedtke, K. Lips, M. Bort, K. Jahn, and W. Fuhs, J. Non-Cryst. Solids 114, 522共1989兲.
58
Y. Kanemitsu, M. Liboshi, and T. Kushida, Appl. Phys. Lett. 76, 2200
共2000兲.
59
M. J. Estes and G. Moddel, Appl. Phys. Lett. 68, 1814共1996兲.