國立交通大學
機械工程學系
碩士論文
利用沼氣發電供應養猪場用電之需求實驗研究
A Research for Electricity Generation by Using Biogas
from Swine Manure for a Farm Power Requirement
研 究 生:林瑋琮
指導教授:陳俊勳 教授
利用沼氣發電供應養猪場用電之需求實驗研究
A Research for Electricity Generation by Using Biogas from Swine Manure for a Farm Power Requirement
研究生 :林瑋琮 Student:Wei-Tsung Lin 指導教授:陳俊勳 Advisor:Chiun-Hsun Chen 國 立 交 通 大 學 機 械 工 程 學 系 碩 士 論 文 A Thesis
Submitted to Department of Mechanical Engineering College of Engineering
National Chiao Tung University In Partial Fulfillment of the Requirements
For the Degree of Master of Science In Mechanical Engineering
June 2010
Hsinchu, Taiwan, Republic of China
I
利用沼氣發電供應養猪場用電之需求
實驗研究
學生:林 瑋 琮 指導教授:陳 俊 勳
國立交通大學機械工程學系
摘要
本論文在小型養猪場測試 30kW 沼氣發電機,收集資料以供未來 設置 300kW 之大型養猪場沼氣發電之先導性研究。本論文共分三部 份,第一部分,測試引擎在不同沼氣供給量與空燃比的影響;第二部 分,測試富氧燃燒對引擎的影響;第三部分,利用熱交換器回收引擎 尾氣的廢熱,以提高能源的使用率。實驗結果顯示,引擎最佳沼氣供 給量為240 和 260L/min,在沼氣供給量為 260L/min 時,可測得最佳 發電量、效率和甲烷使用率分別為 26.8kW、28.7%和 95.4%。在加入 3%富氧空氣後,引擎最大發電量、效率及甲烷使用率可增加至 28.2kW、 30.2%和趨近約 100%,而且引擎可在更低的沼氣量(220L/min)下正常 運轉。熱交換器可以回收引擎廢熱達 923kJ/min,使總體的能源使用 效率提升至 47.3%。利用本論文的數據估算全台灣規模在 1000 頭猪 隻以上的養猪場,其使用沼氣發電的經濟效益如下:每年產生電力為 2 億 6 千多萬度,大約等於 8 億元的電費,每年約可節省 2 億 6 千萬 的瓦斯費,還可達到17 萬噸的年減碳量。 關鍵字:沼氣、沼氣發電、富氧空氣、廢熱回收II
A Research for Electricity Generation by Using Biogas
from Swine Manure for a Farm Power Requirement
Student: Wei-Tsung Lin Advisor: Prof.Chiun-Hsun Chen
Department of Mechanical Engineering National Chiao Tung University
ABSTRACT
This study carried out the 30kW-generator experiments on a small biogas plant in a swine farm to collect data to serve as a preliminary study for constructing a 300-KW power plant of a bigger scale biogas plant in the near future. Firstly, the effects of fuel supply rate together with corresponding different excess air ratio on power generation were studied. Secondly, the effect of oxygen-enriched combustion for engine was tested. Finally, a heat exchanger was installed to recover waste heat from the engine exhaust gas to increase the usage of the energy. The economic benefits were also estimated by the data obtained by this research.
The experimental results showed that the optimum biogas flow rate to the present engine is around 240 to 260L/min, and the maximum power generation, the corresponding thermal efficiency and the percentage of consumed CH4 is 26.8kW, 28.7% and 95.4%, respectively, at biogas
supply rate of 260L/min. With 3% oxygen-enriched air, the maximum power generation, thermal efficiency and the percentage of consumed CH4 are increased up to 28.2kW, 30.2% and 100% approximately for 260
III
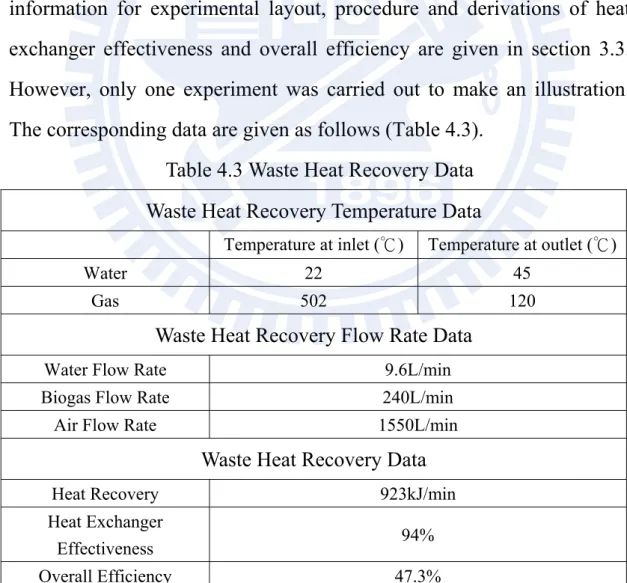
supply rate at 220 L/min. The heat exchanger can recover 923kJ/min of heat leading to an overall efficiency of 47.3% at the biogas supply rate of 240 L/min.
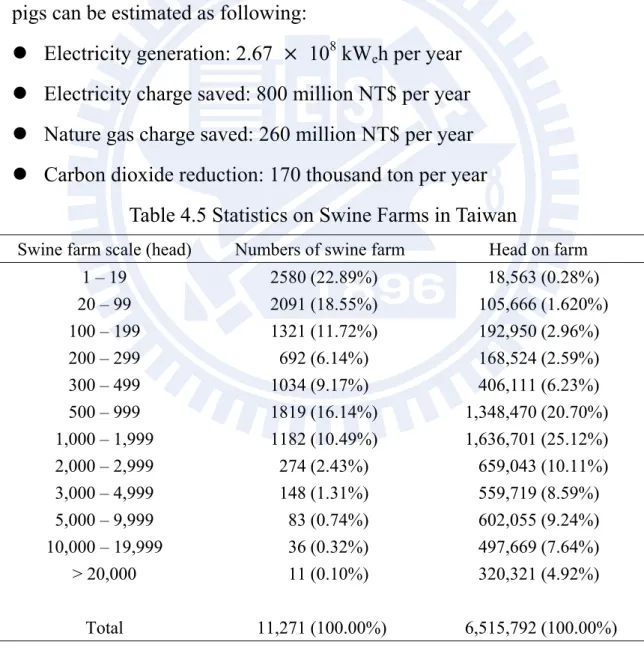
With the total swine population (around 4.3 million heads) from the farm scale of over 1000 heads of pigs in Taiwan, the estimation based on data from this study shows the economic benefits of using biogas: Per year, electricity generation of 2.67 × 10⁸ kWhe (corresponding to
electricity charge saving of 800 million NT$), nature gas charge saving of 260 million and carbon dioxide reduction of 170 thousand tons.
Keywords: Biogas, Biogas generator, Oxygen-enriched air, Waste heat recovery.
IV
誌謝
首先誠摯的感謝指導教授陳俊勳博士悉心的教導,不時的討論並 指點我正確的方向,使我在這些年中獲益匪淺。老師對學問的嚴謹更 是我輩學習的典範。 特別感謝遠達在實驗時期不辭辛苦每周開車至竹南養猪場,感謝 竣翔在提口試計畫書時的幫忙,感謝忠翰每次實驗皆到場。 感謝榮貴、彥成、瑭原、家維、耀文、維義及成陽學長們不厭其 煩的指出我研究中的缺失,且總能在我迷惘時為我解惑,也感謝金輝、 義嘉、信錡同學的幫忙,恭喜我們順利走過這兩年。實驗室的聖容、 云婷、嘉軒、世庸、黃鈞學弟妹們當然也不能忘記,你們的幫忙及搞 笑我銘感在心。 最後,謹以此文獻給我摯愛的雙親。V
Contents
ABSTRACT(Chinese) ... I ABSTRACT(English) ... II Contents ... V LIST OF TABLE ... VII LIST OF FIGURES ... VIII
Chapter 1 Introduction ... 1
1.1 Motivation and Background ... 1
1.2 Literature Review... 5
1.3 Scope of Present Study ... 11
Chapter 2 Biogas System in Swine Farm ... 12
2.1 Swine Manure Management ... 12
2.2 Three-step Piggery Wastewater Treatment (TPWT) ... 12
2.2.1 Solid-liquid Separation ... 13
2.2.2 Anaerobic Treatment ... 13
2.2.3 Aerobic Treatment ... 14
2.3 Utilization of biogas ... 16
2.4 Engines ... 17
2.4.1 Four-stroke gas engine and Diesel engine ... 17
2.4.2 Stirling engine ... 18
2.4.3 Gas turbine ... 18
2.4.4 Micro gas turbine ... 19
2.4.5 Fuel cell ... 19
Chapter 3 Experimental Apparatus and Procedures ... 21
3.1 Experiment layout ... 21
3.1.1 Engine ... 21
3.1.2 Air Flow meter (VA-400) ... 23
3.1.3 Biogas Flow Meter (TF-4000) ... 23
3.1.4 Thermocouple ... 24
3.1.5 Water Flow Meter (VF-2000) ... 24
3.1.6 Gas Analyzer (IMR 1400) ... 25
3.1.7 Water Pump ... 25
3.1.8 Heat Exchanger ... 25
3.1.9 Data Acquisition... 25
3.2 Excess Air Ratio (λ), Thermal Efficiency and Exergy ... 27
3.3 Waste Heat Recovery ... 31
VI
Chapter 4 Results and Discussion ... 34
4.1 Effect of Excess Air Ratio (λ) ... 34
4.1.1 Power Generation ... 35
4.1.2 Thermal Efficiency ... 38
4.2 Oxygen-Enriched Combustion... 42
4.3 Waste Heat Recovery ... 45
4.4 Economic Benefits ... 46
Chapter 5 Conclusions and Recommendations ... 50
5.1 Conclusions ... 50
5.2 Recommendations ... 52
VII
LIST OF TABLE
Table 1.1 Manure management methane emission factors ... 5
Table 3.1 Engine Technical Data ... 22
Table 3.2 Specifications of the data acquisition modules ... 26
Table 4.1a Power Generation Rates as A Function of Excess Air Ratio at Biogas Volume Flow rate 180L/min ... 36
Table 4.1b Power Generation Rates as A Function of Excess Air Ratio at Biogas Volume Flow rate 200L/min ... 36
Table 4.1c Power Generation Rates as A Function of Excess Air Ratio at Biogas Volume Flow rate 220L/min ... 37
Table 4.1d Power Generation Rates as A Function of Excess Air Ratio at Biogas Volume Flow rate 240L/min ... 37
Table 4.1e Power Generation Rates as A Function of Excess Air Ratio at Biogas Volume Flow rate 260L/min ... 38
Table 4.3 Waste Heat Recovery Data ... 45
Table 4.4 Economy Benefits for 1000 Scale Swine Farm per year ... 46
VIII
LIST OF FIGURES
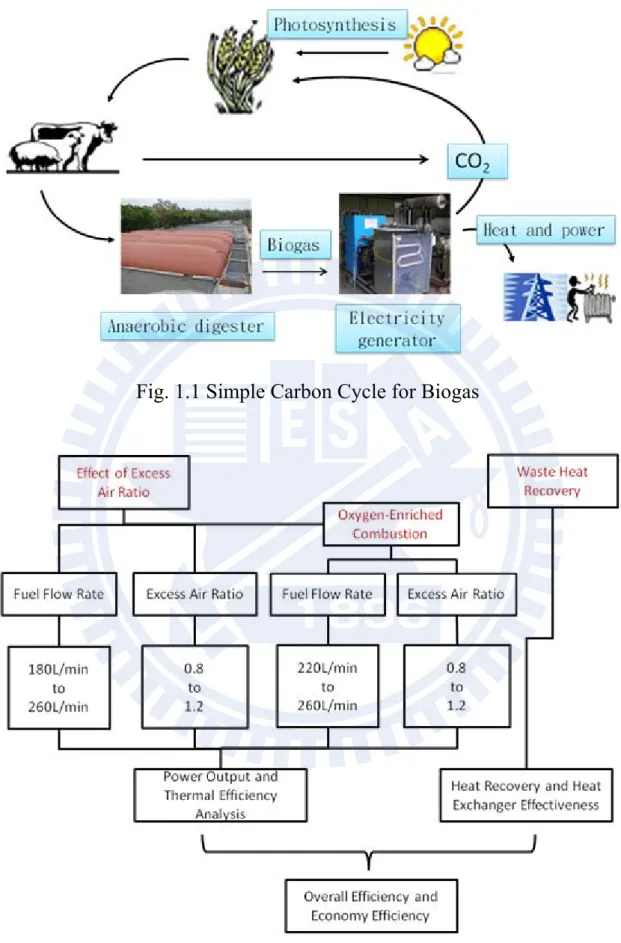
Fig. 1.1 Simple Carbon Cycle for Biogas ... 56
Fig. 1.2 Scope of this Research ... 56
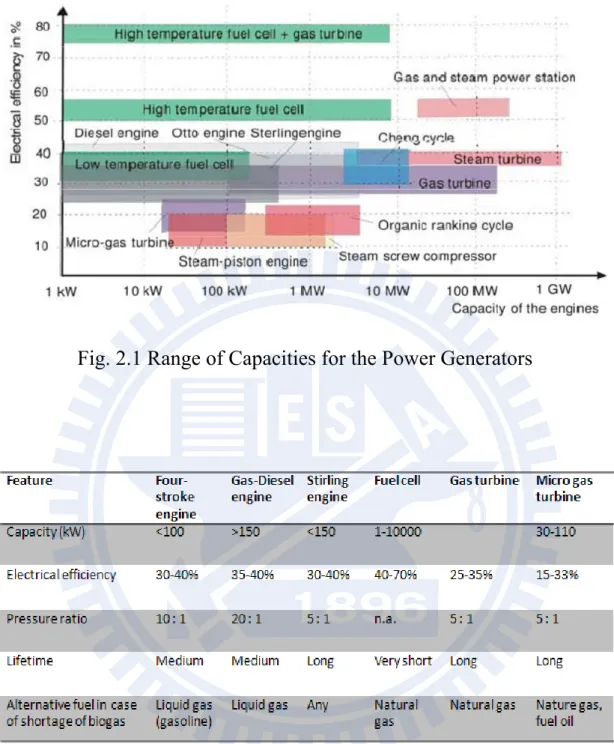
Fig. 2.1 Range of capacities for the power generators ... 57
Fig. 2.2 Values of power generators ... 57
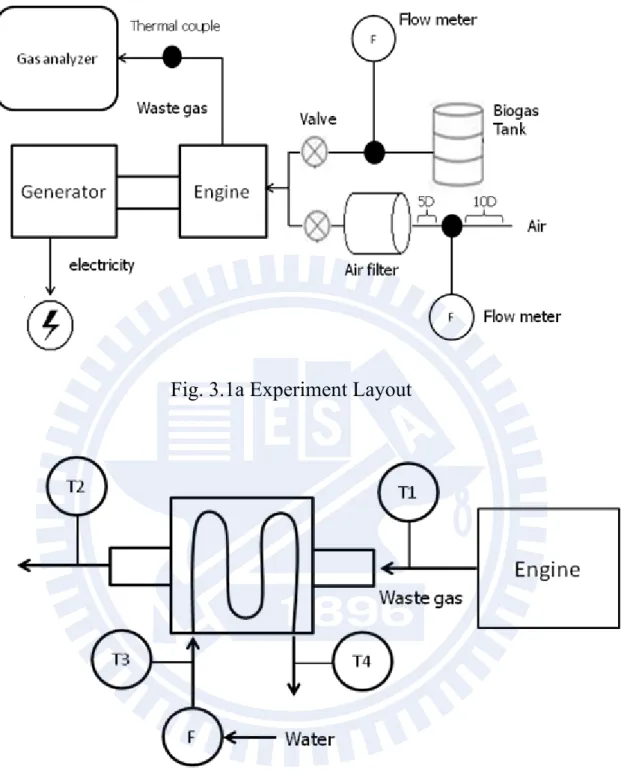
Fig. 3.1a Experiment layout ... 58
Fig. 3.1b Waste Heat Recovery layout ... 58
Fig. 3.1c Oxygen-Enriched Combustion Layout ... 59
Fig. 3.2 Four stroke diesel engine ... 59
Fig. 3.3a VA-400 flow sensor ... 60
Fig. 3.3b VA-400 flow sensor data ... 60
Fig. 3.4a TF-4000 Flow meter ... 61
Fig. 3.4b TF-4000 Flow meter data ... 62
Fig. 3.5a K-Type Thermocouple ... 63
Fig. 3.5b J-Type Thermocouple ... 63
Fig. 3.6a VF-2000 Vortex Flow Sensor ... 64
Fig. 3.6b VF-2000 detailed data Model Code : VF-2032-F01 ... 64
Fig. 3.7 IMR 1400 Gas Analyzer ... 65
Fig. 3.8 Water Pump ... 65
Fig. 3.9a Heat Exchanger ... 66
Fig. 3.9b Slab with Fins and Pipes ... 66
Fig. 3.10a CompactDAQ Chassis ... 67
Fig. 3.10b NI 9203 Analog Input Module ... 67
Fig. 3.10c NI 9211 Analog Input Module ... 68 Fig. 4.1 Power generation v.s. excess air ratio at different biogas supply
IX
rates ... 69 Fig. 4.2 Thermal efficiency v.s. excess air ratio at different biogas supply
rates ... 69 Fig. 4.3 Waste gas temperature v.s. excess air ratio with different biogas
supply rates ... 70 Fig. 4.4 O2 concentration in waste gas v.s. excess air ratio with different
biogas supply rates ... 70 Fig. 4.5 CO concentration v.s. excess air ratio with different biogas
supply rates ... 71 Fig. 4.6 CO2 concentration in waste gas v.s. excess air ratio with different
biogas supply rates ... 71 Figure 4.7 Estimated CH4 consumption ratios in combustion with
different biogas supply rates as a function excess air ratio ... 72 Fig. 4.8 Power generation v.s. excess air ratio with different biogas supply rates with normal one and 1% O2 addition ... 72
Fig. 4.9 Thermal efficiency v.s. excess air ratio with different biogas supply rates with normal one and 1% O2 addition ... 73
Fig. 4.10 Estimated CH4 consumption ratios in combustion with different
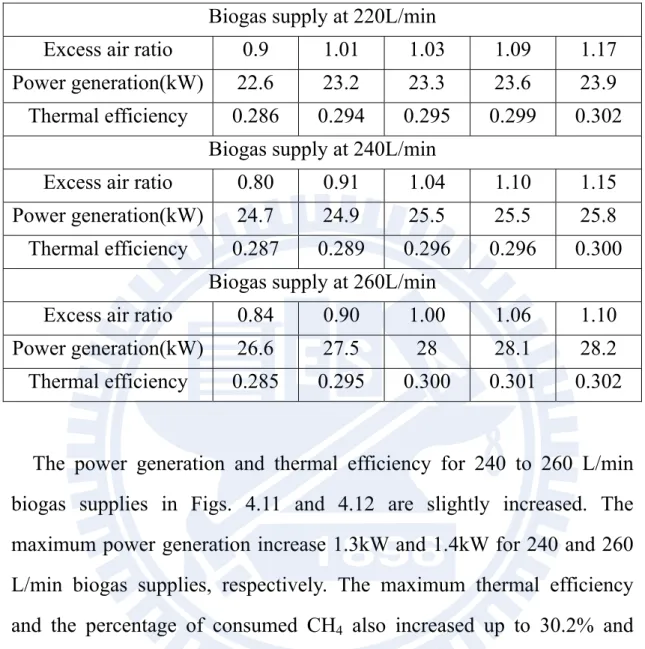
biogas supply rates as a function excess air ratio for normal one and 1%oxygen addition ... 73 Fig. 4.11 Power generation v.s. excess air ratio with different biogas
supply rates with normal one and 3% O2 addition ... 74
Fig. 4.12 Thermal efficiency v.s. excess air ratio at different biogas
supply rates with normal one and 3% O2 addition ... 74
Fig. 4.13 Estimated CH4 consumption ratios in combustion with different
X
1
Chapter 1
Introduction
1.1 Motivation and Background
Kyoto agreement is known as one of the most important issues for the overall pollution prevention targets. The large amounts of animal manure could be a potential damage to the environment, if it is not managed well. Untreated animal manure will emit lots of carbon dioxide (CO2), nitrous
oxide (NOX) and methane (CH4), which has 23 times global warming
potential of CO2. To mitigate the emissions of greenhouse gases (GHG),
it has been spent a lot efforts to treat animal manure to produce methane and use it for power generation. In this way, methane emission can be reduced, in the meantime, due to the utilization of methane as power source, the emission of CO2 is also be reduced.
Another important issue in 21st century is lack of oil. It is about time to start considering renewable energy other than fossil fuel. Bioenergy is one of renewable energies. The energy utilization of biogas from the anaerobic digestion of livestock manure has been received a lot of attention since the early 1970s mainly due to the oil crisis. At the end of 1990s numerous biogas plants were built and implemented for processing the liquid manure together with other digested co-substrates in the European countries, especially Denmark and Germany. The biogas from treated manure is flammable because its contents mostly are methane (CH4) and carbon dioxide (CO2) with some traces of hydrogen sulfide
(H2S), ammonia (NH3), nitrogen (N2), hydrogen (H2) and organic
2
Taiwan’s dependence on imported energy was increasing up to 87.25% in 1983, 95.8% in 1990, and 99.2% in 2007[1]. Considering carbon dioxide emission, renewable energy is an attractive green energy. Figure 1.1 shows a simple carbon cycle. The carbon sources in biogas comes from surroundings by Photosynthesis through plants, and after burning it for power and heat, the carbon goes back to the surroundings as carbon dioxide. The net of carbon amount in this cycle is zero. The usage of biogas will not increase the Greenhouse Gas in the Earth. Moreover, as long as the sun continues providing the light (energy), this cycle will not stop running. Therefore, biogas is a kind of green and renewable energy.
Managing swine manure for biogas has benefits in several ways. First, swine manure has high content of organic matters, so the piggery wastewater treatment system could avoid water quality deterioration in river. Second, biogas from manure could generate power, which would reduce imported energy and carbon dioxide emission in Taiwan. Last, methane, which has 23 times global warming potential than that of carbon dioxide, generated by manure can be collected and burnt into carbon dioxide.
The wastewater treatment system in Taiwan is the three-step piggery wastewater treatment (TPWT) system, which includes solid-liquid separation by screening method, anaerobic treatment (biogas generated in this step), and aerobic treatment. Biogas, stored in a red mud plastic container (a kind of corrosion-resistant plastics), is used as fuel for the stove heating, piglet warming, water pump and electricity generation. The total amounts of biogas energy utilization from the piggery waste were estimated to be about 700kW by now.
3
Recently, people pay intensive attention to find the new or alternative energy sources, to save the energy and to answer the environmental consciousness. In the research team of Chen and his colleagues, a three-year project from 2006 to 2008 was awarded from National Science Council to construct a bench-scale biogas-power generator system. Biogas is a kind of natural renewable energy source, which consist of 60% methane and 20 ~ 30% carbon dioxide. The electricity can be generated by combustion of methane via the generator; whereas carbon dioxide can be removed and transformed to biodiesel by the algae. Therefore, it contributes to both objectives of energy generation and the reduction of greenhouse gas effect. This project was divided into four subprojects. The subproject 1 is to upgrade the utilization efficiency of biogas by removing H2S and improve the power generation rate. The CO2
emitted from biogas will also be reduced by chemical methods. In the subproject 2, study the production of biodiesel from high lipid-content algae utilizing waste CO2. The subproject 3 is to develop a process that
may effectively produce hydrogen from primary products of biomass (including alcohols, methane of subproject 1 and biodiesel of subproject 2). In the subproject 4, based on the low-heating-value fuel obtained from the bio-process to remove H2S from marsh gas (Subproject 1), it will be
developed a micro gas turbine (MGT) by modifying the burner from a liquid-fuel burning gas turbine system into a gas-burning one to generate the combustion power, which is used to drive a generator to produce electricity. It is a co-generation process, which can be one of the potential candidates for the distributed power supply systems.
4
Recently, National Science and Technology Program (-Energy) has awarded a three-year research project to the same research team from 2010 to 2012. The project is named as Development the technology of
agricultural waste bioconversion to biogas for electricity generation and carbon dioxide elimination by microalgae. Goal of this project is to
construct a biogas plant. This project will set up a model system to generate electricity in the swine farm at Taiwan Sugar Corporation, and to develop the swine farm wastewater recycling, the reduction of carbon dioxide emission and the transesterification technology. The main aim of this project is to re-construct the aerobic waste treatment pool to the anaerobic waste treatment system. Biogas collected will be used to remove high concentration of hydrogen sulfide by the desulfurized bioreactor. The desulfurized and CO2 reduced biogas will be used in the
long-term operation of the existing 30 kW generator and other monitoring parameters, to construct 100 ~ 300 kW of large scale generator for the electricity generation with the 10,000 swine.
In the first year, the present sub-project will utilize a 30kW generator to construct waste heat recovery system and analyze the corresponding power supply and efficiency for the system in bench scale. Second year, based on data from the first year, a pilot plant is constructed for biogas and power plant in a swine farm, where a Fuzzy control system is also installed. In the third year, a completely self-operated biogas plant with CHP system is constructed.
This research tests the biogas-powered 30kW-generator system experimentally in a field test. The removal technology of H2S in biogas,
5
previous three-year project, therefore, its scale is also enlarged correspondingly in the swine farm. The quantity of biogas generated varies with temperature (see Table 1.1), so it could produce more biogas in summer than that in winter. In this study, to find the optimum air-fuel ratio for the 30kW engine under the different methane (CH4)
concentration of biogas is carried out. Secondly, build a waste heat recovery system. Finally, the oxygen-enriched combustion for the engine is tested.
Table 1.1 Manure management methane emission factors (kg CH4 head-1
year-1) [17]
1.2 Literature Review
Tsai and Lin [1] analyzed bio-energy from livestock manure management in Taiwan. With a practical basis of the total swine population from the farm scale of over 1000 heads, a preliminary analysis showed the following benefits: methane reduction of 21.5 Gg and electricity generation of 7.2 × 10⁷ kW-h per year, which is equivalent to electricity charge saving of 7.2 × 10⁶ US$ and carbon dioxide mitigation of 500 Gg per year.
Su et al. [2] established GHG production data from anaerobic livestock wastewater treatment processes in Taiwan, and clarified implications of
6
the difference between the livestock wastewater treatment system presented by the IPCC and that used in Taiwan. Analysis of GHG samples from in situ anaerobic wastewater treatment systems of pig and dairy farms revealed, respectively, average emissions of 0.768 and 4.898/kgCH4, 0.714 and 4.200/kgCO2, and 0.002 and 0.011/kgN2O per
head per year during three temperature periods. Average emissions rates of CH4 from selected pig and dairy farms are lower than the limits
imposed by the IPCC, because animal manure is diluted before being treated with a solid/liquid separator and an anaerobic wastewater treatment system.
Yang et al. [3] estimated of methane and nitrous oxide emissions from animal production sector in Taiwan during 1990~2000. Methane emission from enteric fermentation of livestock was 30.9 Gg in 1990, increased to 39.3 Gg in 1996, and then decreased gradually to 34.9 Gg in 2000. Methane emission from the waste management was 48.5 Gg in 1990, reached the peak value of 60.7 Gg in 1996, and then declined to 43.3 Gg in 2000. In the case of poultry, annual methane emission from enteric fermentation and waste management was 30.6~44.1 ton, and 8.7~13.2 Gg, respectively. Nitrous oxide emission from waste management of livestock was 0.78 ton in 1990, increased to 0.86 ton in 1996, and then decreased to 0.65 ton in 2000. Nitrous oxide emission from waste management of poultry was higher than that of livestock with 1.11 ton in 1990, 1.68 ton in 1999, and 1.65 ton in 2000.
Tsai [4] presented an updated overview of LFG-to-electricity in Taiwan. Using the International Panel on Climate Change (IPCC) recommended methodology, anthropogenic methane emissions from MSW landfills in
7
Taiwan during 1992–2003 were estimated to be around 360 thousand metric tons annually during 1992–1999, then decreased to approximately 103 thousand metric tons in 2003 due to the MSW recycling and incineration policies during this period. The promotion measures relating to LFG-to-electricity were also summarized in the paper. Finally, he overviewed four LFG-to-electricity facilities currently commercialized in Taiwan, and briefly evaluated their economic and environmental benefits. It showed that total LFG-to-electricity is around 1.6 × 10⁸ kWh/yr based on the LFG generation rate of 1.0 × 10⁸ m3/yr, heating value of 5500 kcal/m3, and energy efficiency of 25%.
Tippayawong et al. [5] operated a small diesel engine with biogas and diesel mixed fuel to assess its endurance over 2000 hours. From the result, it has 7% of higher power output and superior efficiency compared to that in normal diesel operation.
Bedoya et al. [6] tested mixing system and pilot fuel quality on diesel–biogas dual fuel engine performance with simulated biogas (60% CH4 and 40% CO2) as primary fuel, and diesel and palm oil biodiesel as
pilot fuels. Dual fuel engine performance using a naturally aspirated mixing system and diesel as pilot fuel was compared with engine performance attained with a supercharged mixing system and biodiesel as pilot fuel. For all loads evaluated, it was possible to achieve full diesel substitution by using biogas and biodiesel as power sources. Using the supercharged mixing system combined with biodiesel as pilot fuel, thermal efficiency and substitution of pilot fuel were increased, whereas methane and carbon monoxide emissions were reduced.
8
biogas utilization. High livestock density is always accompanied by production of a surplus of animal manure, representing a considerable pollution threat for the environment in these areas. Avoiding over-fertilization is not only important for environmental protection reasons but also for economical ones. Intensive animal production areas need therefore suitable manure management, aiming to export and to redistribute the excess of nutrients from manure and to optimize their recycling.
Jørgensen et al. [8] presented energy balances of Danish organic farming compared with energy balances of conventional farming. In general, the conversion to organic farming leads to a lower energy use (approximately 10% per unit of product). But the production of energy in organic farming is very low compared with the extensive utilization of straw from conventional farming in Denmark (energy content of straw used for energy production is equivalent to 18% of total energy input in Danish agriculture in 1996).
Axaopoulos and Panagakis [9] predicted the hourly temperature and relative humidity inside the early-weaned piglet unit, along with the heating energy requirements to keep indoor conditions within pigs’ production space. The methane produced by the solar-assisted anaerobic digester was also calculated using a detailed simulation algorithm. The results showed that the methane produced from the solar-assisted anaerobic digester completely ensures not only full coverage of the annual space-heating requirements of the described piglet unit for both Greek areas, but also large methane surplus which could be used in various other ways.
9
Borjesson and Berglund [10] analyzed fuel-cycle emissions of carbon dioxide (CO2), carbon oxide (CO), nitrogen oxides (NOX), sulphur
dioxide (SO2), hydrocarbons (HC), methane (CH4), and particles were
analyzed from a life-cycle perspective for different biogas systems based on six different raw materials. The levels of fuel-cycle emissions vary greatly among the biogas systems studied, and are significantly affected by the properties of the raw material digested, the energy efficiency of the biogas production, and the status of the end-use technology. For example, fuel-cycle emission may vary by a factor of 3–4, and for certain gases by up to a factor of 11, between two biogas systems that provide an equivalent energy service. Extensive handling of raw materials, e.g. ley cropping or collection of waste-products such as municipal organic waste, is often a significant source of emissions.
Andara et al. [11] determined kinetic model in an anaerobic digestion process. It is applied to the organic stabilization of the solid fraction of piggery slurry. The process can be divided in two stages. The microbial growing is the limiting factor in the first stage, whereas the nutrient availability is the limiting factor in the second stage. This two stage model suitably fits the presented experimental results.
Jiang et al. [12] developed two kinds of biogas engines, biogas-diesel dual fuel engine generators and spark-ignition biogas engine generator. The authors proposed several methods to solve the biogas engine problems, such as the low burning velocity, serious back burning, high exhaust temperature and severe heat charge.
Semin et al. [13] converted diesel engine into compressed natural gas engine to compare the cylinder pressure and maximum pressure with the
10
original one (diesel engine). The result showed that the transform of diesel engine into compressed natural gas engine results in a decrease in cylinder pressure.
Ga et al. [14] developed a biogas-petroleum conversion kit for a station engine. The results showed that it consumes 1m3 of biogas to produce 1kWh electricity. Comparing with petroleum, the cost for the production of 1-kWh electricity by biogas can save 0.7USD and reduce of 1kg CO2
emission.
Chung et al. [15] evaluated the feasibility of a chemical absorption and a biological oxidation process to remove high H2S concentrations. The
results suggested that the liquid flow rate in the biological oxidation reactor was controlled at 3 mL/min, the volume ratio of biological reactor to chemical reactor was 13.5:1 when 150 g-S/m3/h of inlet H2S loading
was introduced to the system.
Chiu et al. [16] reduced CO2 by using a high-density culture of
Chlorella sp. in a semi-continuous photobioreactor. The result showed that inhibition of microalgal growth cultured in the system with high CO2
(10-15%) aeration could be overcome via a high-density culture of microalgal inoculum that was adapted to 2% CO2. Moreover, biological
reduction of CO2 in the established system could be parallely increased
11
1.3 Scope of Present Study
This study carries out the 30kW-generator experiments on a small biogas plant in a swine farm to collect data to serve as a preliminary study for constructing a 300-KW power plant of a bigger scale biogas plant in the near future. The energy balance for overall biogas into the energy cycle was tested and calculated. The three-step piggery wastewater treatment system and H2S removal system need energy to operate, so the
net energy output from biogas-powered generator should deduct the one consumed by the systems mentioned above. In this study, the first task is to find the optimum air-fuel ratio for the 30kW engine under the different methane (CH4) concentrations in biogas for the best efficiency. Secondly,
build a waste heat recovery system to maintain the minimal temperature (should be greater than 15℃) in winter to maintain the generation rate of biogas as that in summer, and calculate the respective efficiency with and without waste heat recovery system, and make a comparison. The last one is to apply oxygen-enriched combustion for the engine with different oxygen (O2) concentrations to justify whether the efficiency increase is
12
Chapter 2
Biogas System in Swine Farm
2.1 Swine Manure Management
Swine production is very important in the agriculture of Taiwan. If the amount of wastewater produced by a pig is estimated as 20 liters per day, then the total wastewater produced by 6.6 million pigs (the total number of pigs in Taiwan) is 19 tons per day, making as the third most pollution source in Taiwan that is behind the sewage and industrial wastewater.
In 1987, the quality of waste water draining from livestock farms has been required to meet the governmental standards. Since then, a great variety of wastewater treatment methods have been developed and tried. Among them, the three-step waste treatment system developed by the Taiwan Livestock Research Institute (TLRI), which includes solid-liquid separation, anaerobic treatment and aerobic treatment (activated sludge treatment system), is regarded and accepted as one of the best systems in Taiwan, and has been extended to hog farms since 1987. Via the three-step treatment, both the Biochemical Oxygen Demand (BOD) and Suspended Solids (SS) of treated water can be less than 100 mg per liter.
2.2 Three-step Piggery Wastewater Treatment (
TPWT)
The three-step piggery wastewater treatment system is based on a typical continuous plug-flow design, and the volume of raw wastewater remains constant over each 24-hour period. Under optimal operation conditions, wastewater thus flows into the system and is discharged continuously. Anaerobic treatment is conducted after solid/liquid
13
separation, and occurs inside of anaerobic basins covered with “red-mud plastic cover” (1.2~1.8mm of thickness), made of a kind of PVC material, which is corrosion-resistant and gas-and-water impermeable. Anaerobic treatment is generally slower than forced aeration, but consumes less energy. The anaerobic treatment system of TPWT process can also salvage a part of chemical energy content of wastewater by generating methane, a useful fuel. The optimal hydraulic retention time is around 4–6 days, and BOD removal is expected to be more than 80%.
2.2.1 Solid-liquid Separation
Separation of the solid fraction from the wastewater is to reduce the content of solids for subsequent handling and treatment, and to recover the solids for using as fertilizer, etc. This physical process is accomplished by using various kinds of screens. The efficiency of this treatment is a 15-30% decrease in BOD and a 50% decrease in SS. The moisture content of the separated solids is 70-80%. An extruder is often added to reduce the water content of the solids to 70% or below so that the material is suitable for composting.
2.2.2 Anaerobic Treatment
Since hog wastes are biodegradable, biological treatment is generally an economical way of handling them. The horizontal tent-type anaerobic fermenter is a modification of the Red Mud Plastic (RMP) bag fermenter which was also developed by the Taiwan Livestock Research Institute. Among its merits are the fact that it is easy to construct, has a low investment cost, is easy to maintain, and can be separated into several divisions as desired. These fermenters can be sealed from either inside or
14
outside. The four sides of RMP sheet, which make up the top of fermenter, are in tubular shape, so that PVC pipes may be inserted inside them to give extra strength. The strengthened sheet is then fixed to the wall of the fermenter with hooks.
The hydraulic retention time (HRT) is calculated according to the amount of water used to wash the pig houses, as the following the formula:
HRT =
A 1:3 ratio of manure to washing water is suggested, which can easily be achieved with a flushing tank system. According to the work by Hong (1985), the daily excreta of a 100-kg pig is around 5 liters, so the total wastewater from one pig may be estimated as 20 liters. A HRT of 12-15 days is common for hog wastewater treatment.
A tent-type fermenter should consist of no fewer than two digesters. The volume of the first digester is usually 1.2 times of the daily wastewater. Both acidogenesis and sedimentation take place in this first digester. Most of the methanogensis reaction occurs in the rear digester(s). Biogas may be collected for the use as fuel. The excreta of each pig can generate 0.1-0.3 m3 of biogas per day. Biogas may be used in cooking stoves, water heaters, water pumps, electric power generators, gas lamps, warming piglets, vehicles, mowers, and incinerators for animal bodies, etc.
2.2.3 Aerobic Treatment
There are many kinds of aerobic treatments that may be utilized for livestock wastewater. Considering the environmental conditions of
15
Taiwan in subtropical climate, activated sludge processing and oxidation ditches are recommended. In aerobic treatment, organic matter is decomposed solely through aerobic oxidation.
Activated sludge processes are versatile and flexible. Effluent of any desired quality can be produced by varying the processing parameters. These processes require less land but more skilled management than simpler processes, such as oxidation ditches. Activated sludge is a complex biological mass, resulting from when organic wastes are aerobically treated. The sludge will contain a variety of heterotrophic microorganisms, including bacteria, protozoa, and higher forms of life. The relative abundance of any particular microbial species will depend on the type of waste that is being treated, and the way in which the process is operated. For optimum treatment, raw waste must be balanced nutritionally. In three-step treatment, most of the easily biodegradable matter has already been decomposed in the anaerobic digester, therefore, operating an activated sludge treatment requires intensive care for good performance. It is best to control the BOD of anaerobic effluent at around 1000 mg/L. The growth conditions for microorganisms in activated sludge tanks are usually measured according to the mixed liquor suspended solids (MLSS) and sludge volume index (SVI). The HRT for an aerobic tank is normally 1.0-1.5 days.
While activated sludge tanks have a water depth of 2-5 m, this should not exceed 1.5 m in oxidation ditches. Oxidation ditches, therefore, require a larger land area, but have the advantages of being easy to operate and of generating less sludge.
16
treated water is required in aerobic treatment. The settled sludge may be removed by mechanical methods for return to the aerobic unit, or be dehydrated for disposal. Usually the HRT in the clarifier should not exceed 6 hours.
2.3 Utilization of biogas
Biogas can be used either for the production of heat only or for the generation of electric power. Normally heat and power are produced in the same time for higher efficiency. Such power generators are called combined heat and power (CHP) generation plants, and normally use a four-stroke or a Diesel engine. A Stirling engine or gas turbine, a micro gas turbine, high- and low- temperature fuel cells, or a combination of a high-temperature fuel cell with a gas turbine are alternatives.
Biogas can also be used by burning it to produce steam, by which can drive an engine in the Organic Rankine Cycle (ORC) or the Cheng Cycle, the steam turbine, the steam piston engine, or the steam screw engine.
Figure 2.1 shows the range of capacities for the power generators, which are available on the market for the pilot-plant or industrial scale. The efficiency is defined as the ratio of the electrical power generated to the total energy content in the biogas. Efficiency figures are also provided by different manufacturers. Small-capacity engines generally can result in the lower efficiencies than that of high-capacity engines.
The generated current and heat can supply to the bioreactor itself, associated buildings, and neighboring industrial companies or houses. The power can be fed into the public electricity network, and the heat into the network for long-distance heat supply. Vehicles can sometimes be
17 driven by the power or the heat.
2.4 Engines
Figure 2.2 lists some engines that can be operated with biogas. These have been improved during the recent years by following the development works inspired by the worldwide boom in biogas plants. The performance by some manufacturers even has already exceeded that of those given in this figures.
2.4.1 Four-stroke gas engine and Diesel engine
Today’s four-stroke biogas engines were originally developed for natural gas and are therefore well adapted by the special features of biogas. Their electrical efficiencies normally do not exceed 34~ 40%, as the nitrogen oxide (NOx) output has to be kept below the prescribed
values. The capacity of the engines ranges from 100 KW to 1 MW.
Four-stroke biogas engines often run in the lean-burn range (ignition window 1.3 < λ < 1.6, λ = air-fuel ratio/stoichiometric air-fuel ratio), where the efficiency is expected to drop. The efficiency of lean-burn engines with turbocharger is 33~ 39%. The NOx emissions can be
reduced, however, by a factor of 4 in comparison to ignition (by compression) oil Diesel engines, and the limiting values can be met without further measures. Since the engines tend to knock with varying gas qualities, a methane content of at least 45% in biogas should be ensured.
In small agricultural plants, ignition oil Diesel engines are frequently installed. These engines are more economical and have a higher efficiency than four-stroke engines in the lower capacity range. However,
18
their NOx emissions are higher. Their lifetimes usually are given as
35,000h of operation.
In general, gas Diesel engines work by direct injection because pre-chamber engines develop hot places, resulting in uncontrolled spark failures with biogas. Owing to the internal formation of gas mixtures, Diesel engines can be faster controlled. The ignition oil Diesel engine is operated ideally at λ < 1.9. The efficiency is then up to 15% better than that in a four-stroke engine.
2.4.2 Stirling engine
An alternative to the commonly used four-stroke and the Diesel engines is the Stirling engine. The efficiency of the Stirling process is closest to that of the ideal cycle. The Stirling engine has been recommended for power generation for many years, but is seldom realized on an industrial scale because of technical problems in details. Power generated from biogas in Stirling engines is not known yet in industrial scale installations.
2.4.3 Gas turbine
Biogas can be converted to current via gas turbines of medium and large capacity (20 MW and more) at a maximum temperature 1200 °C. The tendency is to go to even higher temperatures and pressures, whereby the electrical capacity and thus the efficiency can be increased. The main parts of a gas turbine are the compressor, combustion chamber, and turbine.
Ambient air is sucked and compressed in the compressor and transmitted to the combustion chamber, where biogas is introduced and
19
burnt with the compressed air. The flue gas that is so formed is passed to a turbine, where it expands and transfers its energy to the turbine. The turbine propels the compressor on the one hand and the power generator on the other hand. The exhaust gas leaves the turbine at a temperature of approximately 400~600 °C. The waste heat can be recovered by driving a steam turbine downstream for heating purposes or for preheating the air that is sucked in.
2.4.4 Micro gas turbine
Micro gas turbines are small high-speed gas turbines with low combustion chamber pressures and temperatures. They are designed to deliver up to 200 kW electrical powers. For normal operation, the compressor sucks in the combustion air. The fuel is normally supplied to meet the combustion air in the combustion chamber. When biogas with a low calorific value is used, it must be adjusted to a flammable mixture of biogas and air before it is supplied into the combustion chamber.
The electrical efficiency of 15~25% for today’s micro gas turbines is still unsatisfactorily low. An attempt to increase the efficiency has been made by preheating the combustion air in heat exchange with the hot turbine exhaust gases. But great improvements are still necessary before micro gas turbines can be introduced into the market of industrial biogas plants. However, the coupling of a micro gas turbine with a micro steam turbine to form a micro gas-steam turbine seems already interesting and economical today because of its high electrical efficiency.
2.4.5 Fuel cell
20
energy of hydrogen and oxygen directly into current and heat. Water is formed as the reaction product.
In principle, a fuel cell works with a liquid or solid electrolyte held between two porous electrodes–anode and cathode. The electrolyte lets ions pass only and allow no free electrons from the anode to the cathode side. The electrolyte is thus “electrically non-conductive.” It separates the reaction partners and thereby prevents direct chemical reaction. For some fuel cells, the electrolyte is also permeable to oxygen molecules. In this case the reaction occurs on the anode side. The electrodes are connected by an electrical wire.
Both reaction partners are continuously fed to the two electrodes, respectively. The molecules of the reactants are converted into ions by the catalytic effect of the electrodes. The ions pass through the electrolyte, while the electrons flow through the electric circuit from the anode to the cathode. Taking into account all losses, the voltage per single cell is 0.6 ~ 0.9 V. The desired voltage can be reached by arranging several single cells in series, a so-called stack. In a stack, the voltages of the single cells are added.
Depending on the type of fuel cell, the biogas has to be purified to remove CO and H2S especially before feeding into the fuel cell. Only a
small number of fuel cell plants, mostly pilot plants, are in operation for the generation of electricity from biogas.
21
Chapter 3
Experimental Apparatus and Procedures
3.1 Experiment layout
The Experiment layout is shown in Figure 3.1a. When the engine starts, the air and the biogas are sucked into the engine. The flow meters, marked by F1 and F2, measure the air and the biogas flow rates, which are controlled by valves at the engine inlets. The engine gets the power by combustion to drive the generator to produce the electricity. The thermocouple at the engine outlet measures waste gas temperature, and followed by the gas analyzer to measure the concentration of CO in waste gas.
Figure 3.1b is the layout of waste heat recovery. The heat exchanger is installed following the exhaust pipe. The waste gases flow into the exchanger and transfer heat to water in a separated pipe. There are four thermocouples established at exchanger inlets and outlets. T1 and T2 measure the temperature of waste gases before and after the heat exchanger. T3 and T4 are for water temperature at inlet and outlet. A flow meter is also set up for measuring water flow rate.
Later, oxygen is added to the engine for oxygen-enriched combustion test, whose layout is shown in Fig. 3.1c. Note that oxygen is mixed with biogas before they are sent to engine. There exist a valve and a flow meter to control and measure oxygen flow rate.
3.1.1 Engine
22
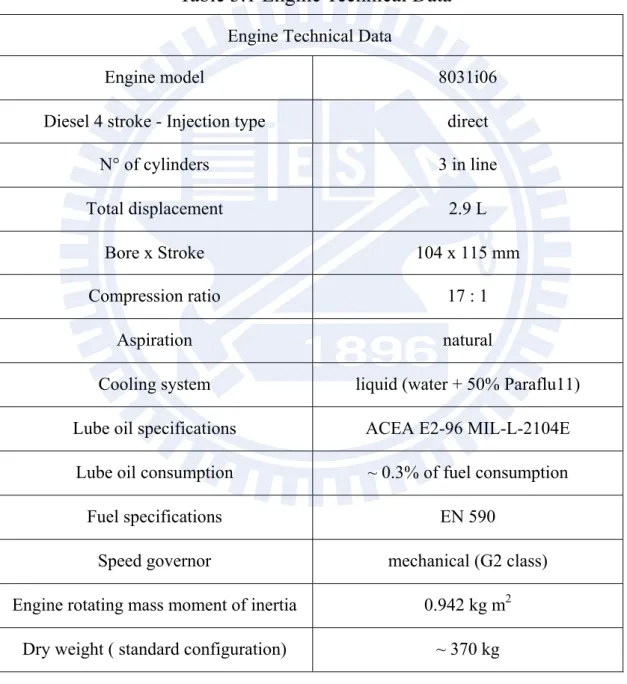
using compression to ignite the fuel. In order to use biogas gas as fuel, the spark ignition system was installed to the engine. In other words, The ignition way was changed into spark ignition instead of comprssion one. Figure 3.2 shows the refurnished engine and its detailed data can be referred in the following table.
Table 3.1 Engine Technical Data
Engine Technical Data
Engine model 8031i06
Diesel 4 stroke - Injection type direct
N° of cylinders 3 in line
Total displacement 2.9 L
Bore x Stroke 104 x 115 mm
Compression ratio 17 : 1
Aspiration natural Cooling system liquid (water + 50% Paraflu11)
Lube oil specifications ACEA E2-96 MIL-L-2104E Lube oil consumption ~ 0.3% of fuel consumption
Fuel specifications EN 590
Speed governor mechanical (G2 class)
Engine rotating mass moment of inertia 0.942 kg m2 Dry weight ( standard configuration) ~ 370 kg
23
3.1.2 Air Flow meter (VA-400)
The flow meter at air inlet is insertion type VA-400 flow sensor, whose range varies with the installed pipe diameter. In order to maintain the accuracy stipulated in the data sheets, the sensor must be inserted in the center of a straight pipe section with an undisturbed flow progression. An undisturbed flow progression is achieved if the sections in front of the sensor and behind the sensor are sufficiently long, absolutely straight and without any obstructions such as edges, seams, curves etc. The minimum length ahead the sensor along the pipe should be 10 times of pipe diameter and 5 times behind sensor for the fully developed turbulent flow profile, so the measured flow rate can be accurate enough. Figures 3.3a and 3.3b show the flow meter and its detailed data.
3.1.3 Biogas Flow Meter (TF-4000)
The flow meter at biogas inlet is TF-4000 thermal-mass flow meter. The measuring object generally is a mixture of 60% of CH4 and 40% of
CO2 for biogas produced in current swine farm. Figure 3.4a and Figure
3.4b show the flow meter and its technical data. Operation principle is as following: Two temperature sensors are put on along the flow path of gas. One of them is heated by a controlled power supply, and the other one is not heated. The temperature difference between these two sensors should be always kept constant under a fixed mass flow rate. The different mass flow rate will result in different temperature difference. Therefore, it can deduce the mass flow rate of fluid flow by the quantity of power supply to maintain the temperature difference between these two sensors.
24
3.1.4 Thermocouple
A thermocouple is a sensor for measuring temperature. It consists of two dissimilar metals joined together at one end, which can produce a small unique voltage at a given temperature. This voltage is measured and interpreted by a thermometer. Thermocouples are available in different combinations of metals or calibrations. The four most common calibrations are J, K, T and E. Each calibration has a different temperature range and environment.
Type K (Chromel–Alumel) is the most commonly used thermocouple with a sensitivity approximately 41 µV/°C. The voltage of Chromel is positive relative to the one of alumel. It is inexpensive and its temperature is wide, ranging from −200 °C to +1350 °C.
Type J (iron–constantan; −40 ~ +750 °C) has a more restricted range than type K, but with a higher sensitivity about 55 µV/°C. The Curie point of the iron (770 °C) causes an abrupt change in the characteristic, which determines the upper temperature limit.
In this research, K-type thermocouple is used for measuring waste gas temperature and J-type thermocouple is used for water temperature in waste heat recovery. Figures 3.5a and 3.5b show the pictures of these two kinds of thermocouples.
3.1.5 Water Flow Meter (VF-2000)
The VF-2000 Flow Sensor is assembled with a few pieces of components. The sensor body and Shedder bar (vortex generator) are molded as one component. This design approach has reduced the cost as well as the size and weight of the flow meter. Sensor body is made of PPS
25
(Polyphenylene sulfide) and is designed to eliminate deposits. The operating principle of VF-2000 uses a bluff body or shedder bar in the flow to generate a street of vortices downstream. The VF-2000 Flow Sensor measures the flow rate by counting the number of vortices with a piezoelectric sensor. In this research, VF-2000 is used for measuring water flow rate in waste heat recovery. Figure 3.6a and Figure 3.6b show the picture of VF-2000 and its detailed data.
3.1.6 Gas Analyzer (IMR 1400)
Figure 3.7 is IMR 1400, which is used for waste gas component data. It can measure the concentrations of oxygen and carbon monoxide, with which it can deduce the concentration value of carbon dioxide.
3.1.7 Water Pump
The water pump is used to pump cooling water through the heat exchanger. The water is heated by waste gas exhausted from engine. Figure 3.8 shows the pump and its maximum water flow rate.
3.1.8 Heat Exchanger
The heat exchanger (Fig. 3.9a) is placed at waste gas outlet to heat the water. It has a casting surrounding four sets of copper pipes of water, which each outer wall is welded by many copper fins (see Fig 3.9b) to enhance the heat transfer between the hot waste gas and the cooling water. The void space between the casting and pipes is for the passage of waste gas.
3.1.9 Data Acquisition
26
and digital measurement sources, such as sensors and devices, under tests. It uses a combination of PC-based measurement hardware and software to provide a flexible and user-defined measurement system. Usually, the researcher must calibrate sensors and signals before a data acquisition device acquires them. The specifications of these modules of National Instruments are shown in Table 3.2.
Table 3.2 Specifications of the data acquisition modules Model Signal Type Channels
Max Sampling
Rate
Resolution Signal Input Ranges NI 9203 Current 8 500 k/s 16 bits ±20 mA NI 9211 Thermocouple 4 15 k/s 24 bits ±80 mV
National Instruments, a leader in PC-based data acquisition, offers a complete family of proven data acquisition hardware devices and the powerful and easy-to-use software that can extend to many languages and operating systems. NI CompactDAQ delivers fast and accurate measurements in a small, simple, and affordable system. A CompactDAQ Chassis shown in Figure 3.10a, a product of NI, is adopted because of the following advantages: plug-and-play installation and configuration, AC power supply and USB cable connection, mounting kits available for panel, enclosure, DIN-rail and desktop development, A380 metal construction, more than 5 MS/s streaming analog input per chassis, and Hi-Speed USB-compliant connectivity to PC. Different types of signal process modules are chosen to complete the data acquisition system, including NI 9203 Analog Input Module, NI 9211 Thermocouple
27
Differential Analog Input Module. Both are shown in Figure 3.10b and Figure 3.10c.
3.2 Excess Air Ratio (λ), Thermal Efficiency and Exergy
The air-fuel ratio (AF) is defined as a ratio of the mole of air to the one of fuel in the combustion process. The stoichiometric reaction for combustion of methane with standard air is given as:
CH 2 O 3.76N CO 2H O 7.52N (3.1)
The stoichiometric air-fuel ratio, AFstoich, is
AF . 9.52 (3.2)
On the other hand, AFact is the air-fuel ratio of the actual mole of air to
mole of methane into the engine. Because the mole ratio is equal to the volume flow rate ratio, AFact can be also expressed as:
AF M A f f (3.3)
The air flow rate can be measured by air flow meter directly, whereas the methane flow rate is obtained by the measured biogas flow rate multiplied by the mole fraction of methane (both flow meters were demonstrated in sections 3.1.2 and 3.1.3). An example is given as follows: If the air and biogas (with 60% of CH4) flow rate were measured as 1400
28
AF L/ L/ % 9.72 (3.4)
The Excess Air Ratio (λ) is the ratio of the actual mole of air used to the stoichiometric mole of air, defined as:
λ AFAF (3.5)
Note that the actual mole of fuel is equal to stoichiometric mole of fuel because in the engine experiments the fuel supply rate is fixed, whereas the air volume flow rate is changed. As a consequence, the excess air ratio is equal to ratio of AFact to AFstoich. Also remind that λ is reciprocal
of equivalence ratio.
From those definitions, the resultant Excess Air Ratio (λ) for the above example is
AF
AF
.
. 1.02 (3.6)
The thermal efficiency is calculated for how much energy converting into electric power, its formulation is as following :
(3.7)
29
methane, whose value is 50020kJ/kg, in the biogas. It is expressed as:
mCH LHV of CH (3.8)
where mCH is the methane mass flow rate in biogas, and it is calculated by:
mCH 60% ρCH (3.9)
where ρCH is the density of methane, which is 0.717 g/m3 at STP. The second law efficiency can be briefly shown as follow:
(3.10)
In calculating the second law efficiency for heat exchanger, the Exergy
supplied is from the different flow exergy (availability) between inlet and
outlet of waste gas. It is calculated as follow:
Exergy from waste gas ∑ ∆φ (3.11)
where ∆φ is the flow exergy difference between the heat exchanger at inlet and outlet for four different major components in waste gas. The flow exergy is calculated as follow:
φ h h T s s (3.12)
30
surrounding, and s is the entropy for the component. Its calculated as follow:
s s ° R ln (3.13)
where s ° is the absolute entropy, and y p is the partial pressure for the component. p is the pressure for the surrounding. R is the universal gas constant.
Testing and finding the optimum excess air ratio is important for gaining a higher thermal efficiency design. The collected data are expected to be used in the future design of pilot and real scale plants.
The experimental parameters include biogas flow rate and excess air ratio. The different biogas flow rates are 180 L/min, 200L/min, 220L/min, 240L/min and 260L/min. Under each fixed biogas flow rate, it tests five different excess air ratios, ranged from 0.8 to 1.2. The collected data include biogas flow rate, air flow rate, power generation, waste gas temperature, carbon monoxide concentration, oxygen concentration and carbon dioxide concentration. Before taking the measurement, the engine was operating continuously until all conditions were ensured to be steady. Then, all measurements were tested twice and took an average. The experimental procedure is as follows:
1. Operate the engine at least 20 minutes so it would be steady. 2. Fix the biogas flow rate at demanded quantity.
3. Control the air flow rate for specific excess air ratio. 4. Collect the corresponding data, mentioned above.
31
5. Repeat the procedure for different excess air ratio.
3.3 Waste Heat Recovery
The heat recovery is calculated by the following :
m C ∆T (3.14)
where m is water mass flow rate, C is calorie (specific heat of water), and ∆T is the water temperature difference between inlet and outlet. The heat exchanger effectiveness is to describe the percent of energy from a higher temperature flow is transferred to the lower temperature flow. It is defined as follow:
(3.15)
The energy transfer from gas is the energy lost from the gas between the inlet and outlet.
∑ ∆Q (3.16)
where ∆Q is the enthalpy difference between inlet and outlet for each major component in waste gas (H2O, CO2, O2, N2).
Q m h h (3.17)
where m is mole flow rate for the component, and h and h are the enthalpies at inlet and outlet in joule per mole. Sum up the energy transfer from four major gas and heat recovery, the effectiveness of the heat exchanger can be known.
Overall efficiency displays energy conversion rate for waste heat and
power output. It can show how many energy utilization increasing with heat exchanger.
32
(3.18)
Temperature affects biogas production quantity, therefore, to maintain the temperature in winter to retain the biogas production rate is crucial. Recovering waste heat from engine for biogas production process or for swine farm usage can save more energy from power supply.
The air temperature at outlet of heat exchanger cannot be lower than 100℃ such that water vapor in the waste gas will not be condensed. Liquid water with H2S will corrode the engine and heat exchanger.
Collect inlet and outlet temperature data of water flow and waste gas from heat exchanger so the total energy recovered by heat exchanger can be calculated. With the fuel consumption rate, the overall efficiency by waste heat recovery now can be calculated. The experimental procedures as following:
1. Set up the heat exchanger at waste gas outlet.
2. Start the water pump to let water flow through heat exchanger. 3. Start the engine at least 20 minute.
4. Collect water flow rate, water inlet and outlet temperatures and waste gas inlet and outlet temperatures.
Note that the pump must be started before the engine. Because the heat exchanger without flowing water inside, the fin and pipe will be over heated and could melt or be damaged as they directly contacted the hot waste gas.
33
3.4 Oxygen-Enriched Combustion
Biogas contains 20~30% carbon dioxide, which can feed algae in advance in other subproject. After feeding the algae, there is a little pure oxygen left in the biogas so that it can make an oxygen-enriched burning in the combustion chamber.
The extra oxygen mixes with fuel and the mixture flows into the engine. After the engine is operated steadily, collect the data include biogas flow rate, air flow rate, power output, waste gas temperature, carbon monoxide concentration, oxygen concentration and carbon dioxide concentration. Find the new air-fuel ratio. Then, calculate the engine thermal efficiency. The experimental parameters are the biogas flow rates at 220L/min, 240L/min and 260L/min, respectively, and each is with five different excess air ratios.
34
Chapter 4
Results and Discussion
The biogas was from the anaerobic tank made of a red plastic bag. The original biogas from the tank contains high concentration of H2S, around
3000ppm. Such high concentration H2S will corrode the engine, so a H2S
removal system developed by Tseng and his colleagues [15] was installed such that it could effectively reduce H2S concentration from 3000ppm to
300ppm. After the reduction of H2S concentration, the biogas was
measured by using Cosmos XP-3140 (the high concentration methane and the carbon dioxide analyzers), and found it containing 59%~62% of CH4 and 20%~30% of CO2. This work regarded the treated bigas after
H2S removal as consisting of 60% of CH4 and 40% of CO2, by which all
calculations were based on this base line. The engine operated with the biogas as fuel and generated electric power for farm using.
4.1 Effect of Excess Air Ratio (λ)
In this section, the effects of fuel supply rate together with corresponding different excess air ratio on power generation are studied. The fuel (biogas) supply rates tested were 180, 200, 220, 240, and 260 liters per minute, respectively.Under each fixed biogas flow rate, it tests five different excess air ratios, ranged from 0.8 to 1.2. The excess air ratio (λ) was defined in Eq. (3.5) of section 3.2. Note that the mole of fuel counted in this study was the one of methane but not the one of biogas itself. The reason is that the CO2 existed in the biogas did not particate the
combustion. Another important issue is that because the maximum allowable total volume flow rate (sum of biogas and air flow rates) into
35
the engine is about 1800 L/min, the maximum air supply rate is limited by the fixed biogas one that can be observed in the last columns of Table 4.1a~e. In other words, the experiment with the higher biogas flow rate carrys out a narrower range of air flow supply rate.
4.1.1 Power Generation
Figure 4.1 shows the power generation rates as a function of excess ratio ratio at different biogas supplies. The detailed experimental values are given in the third row in Table 4.1a~e.
It can be seen from this figure that under the constraints of the engine, the higher the fuel supply rate, the higher the power generation at a given excess air ratio. The maximum power output is 26.8 kW at biogas supply of 260 L/min with an excess air ratio of 1.01 (nearly stoichiometric), equivalent to 1500 L/min of air supply. For the biogas supply rates above 240 L/min, the power generation increases with the increase of excess air ratio, whereas for those of 200 and 220 L/min the power generation starts to drop after λ around 0.95 (approximately the stoichiometric ratio), which is in fuel-rich range (λ is the reciprocal of equivalent ratio). For the case of 180 L/min, it even decend from very beginning λ =0.78. From the power point of view, the three fuel supply rates, shuch as 180, 200 and 220 L/min, cannot produce the ecectricity more than 20kWe that may
not be appropriate in real application.
According to these data, it might conclude that the optimumal biogas flow rate to the present engine is around 240 to 260 L/min because the corresponding thermal efficiency (shown in next figure) needs to be considered as well.
36
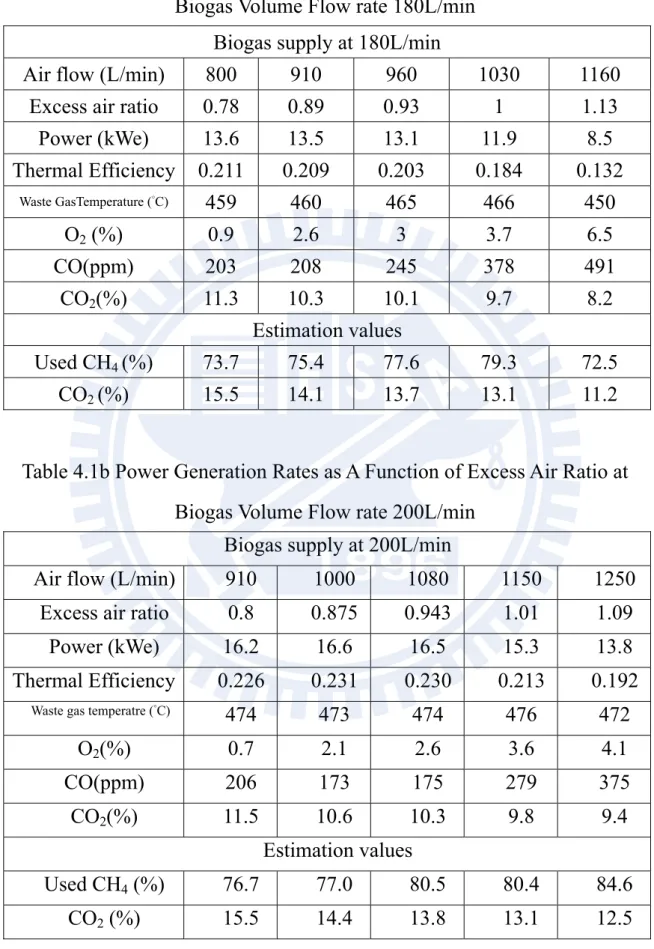
Table 4.1a Power Generation Rates as A Function of Excess Air Ratio at Biogas Volume Flow rate 180L/min
Biogas supply at 180L/min
Air flow (L/min) 800 910 960 1030 1160
Excess air ratio 0.78 0.89 0.93 1 1.13
Power (kWe) 13.6 13.5 13.1 11.9 8.5 Thermal Efficiency 0.211 0.209 0.203 0.184 0.132 Waste GasTemperature (°C) 459 460 465 466 450 O2 (%) 0.9 2.6 3 3.7 6.5 CO(ppm) 203 208 245 378 491 CO2(%) 11.3 10.3 10.1 9.7 8.2 Estimation values Used CH4 (%) 73.7 75.4 77.6 79.3 72.5 CO2 (%) 15.5 14.1 13.7 13.1 11.2
Table 4.1b Power Generation Rates as A Function of Excess Air Ratio at Biogas Volume Flow rate 200L/min
Biogas supply at 200L/min
Air flow (L/min) 910 1000 1080 1150 1250
Excess air ratio 0.8 0.875 0.943 1.01 1.09
Power (kWe) 16.2 16.6 16.5 15.3 13.8
Thermal Efficiency 0.226 0.231 0.230 0.213 0.192
Waste gas temperatre (°C) 474 473 474 476 472
O2(%) 0.7 2.1 2.6 3.6 4.1 CO(ppm) 206 173 175 279 375 CO2(%) 11.5 10.6 10.3 9.8 9.4 Estimation values Used CH4(%) 76.7 77.0 80.5 80.4 84.6 CO2(%) 15.5 14.4 13.8 13.1 12.5
37
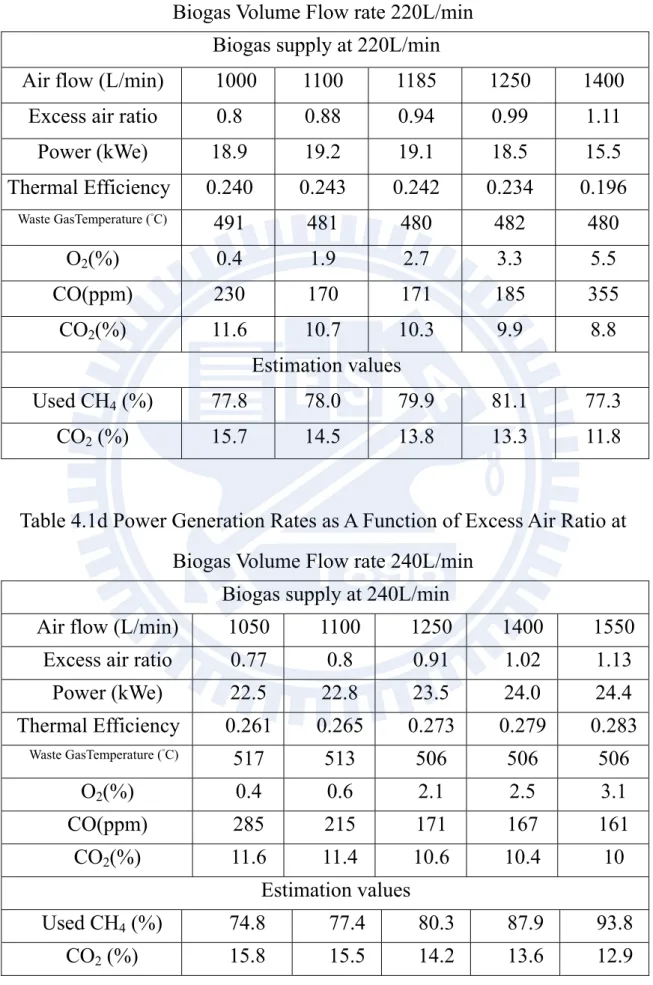
Table 4.1c Power Generation Rates as A Function of Excess Air Ratio at Biogas Volume Flow rate 220L/min
Biogas supply at 220L/min
Air flow (L/min) 1000 1100 1185 1250 1400
Excess air ratio 0.8 0.88 0.94 0.99 1.11
Power (kWe) 18.9 19.2 19.1 18.5 15.5 Thermal Efficiency 0.240 0.243 0.242 0.234 0.196 Waste GasTemperature (°C) 491 481 480 482 480 O2(%) 0.4 1.9 2.7 3.3 5.5 CO(ppm) 230 170 171 185 355 CO2(%) 11.6 10.7 10.3 9.9 8.8 Estimation values Used CH4(%) 77.8 78.0 79.9 81.1 77.3 CO2(%) 15.7 14.5 13.8 13.3 11.8
Table 4.1d Power Generation Rates as A Function of Excess Air Ratio at Biogas Volume Flow rate 240L/min
Biogas supply at 240L/min
Air flow (L/min) 1050 1100 1250 1400 1550
Excess air ratio 0.77 0.8 0.91 1.02 1.13
Power (kWe) 22.5 22.8 23.5 24.0 24.4 Thermal Efficiency 0.261 0.265 0.273 0.279 0.283 Waste GasTemperature (°C) 517 513 506 506 506 O2(%) 0.4 0.6 2.1 2.5 3.1 CO(ppm) 285 215 171 167 161 CO2(%) 11.6 11.4 10.6 10.4 10 Estimation values Used CH4(%) 74.8 77.4 80.3 87.9 93.8 CO2(%) 15.8 15.5 14.2 13.6 12.9
38
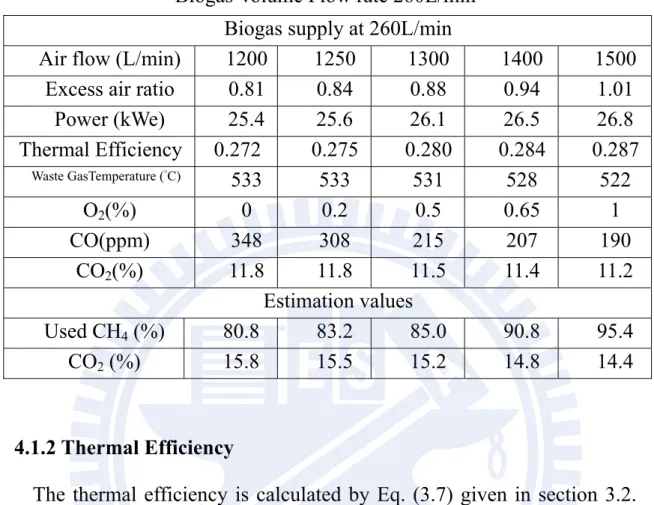
Table 4.1e Power Generation Rates as A Function of Excess Air Ratio at Biogas Volume Flow rate 260L/min
Biogas supply at 260L/min
Air flow (L/min) 1200 1250 1300 1400 1500
Excess air ratio 0.81 0.84 0.88 0.94 1.01
Power (kWe) 25.4 25.6 26.1 26.5 26.8 Thermal Efficiency 0.272 0.275 0.280 0.284 0.287 Waste GasTemperature (°C) 533 533 531 528 522 O2(%) 0 0.2 0.5 0.65 1 CO(ppm) 348 308 215 207 190 CO2(%) 11.8 11.8 11.5 11.4 11.2 Estimation values Used CH4(%) 80.8 83.2 85.0 90.8 95.4 CO2(%) 15.8 15.5 15.2 14.8 14.4 4.1.2 Thermal Efficiency
The thermal efficiency is calculated by Eq. (3.7) given in section 3.2. It is deduced from the related measurements, such as power generation rate and methane volume flow rate. Knowing the thermal efficiency, it can estimate the power generation from the biogas quantity, which can also be estimated from swine farm population. The economic benefits for the swine farm after generator installed, such as elecrictity generation and CO2 reduction, can also be deduced.
Figure 4.2 shows the thermal efficiency at different biogas supplies as a function of λ. The values can be seen in the fourth row of Table 4.1a~e. In general, the trends for both Figs. 4.1 and 4.2 are quite similar because for each fuel flow rate the thermal efficiency is directly proportional to power generation (see Eq. (3.7) in section 3.2.). Note that the thermal
39
efficiency curve of 240 L/min is very close to that of 260 L/min. However, the operation range (0.77 < λ < 1.13) of 240 L/min is wider comparing to the one of 260 L/min (0.81 < λ < 1.01).
The maximum thermal efficiency now can be reached by this engine is 28.7% at the maximum fuel supply rate of 260 L/min. It is lower than the ones (30~40%) for commerical biogas engines [18]. Apparently, the present engine needs more adjustments or improvements to increase its thermal efficiency. Therefore, an improvement is carried out in a later section.
Figure 4.3 shows the waste gas temperautres for 5 different fuel supply rates after the engine exaust as a function of excess air ratio. Similar to the power generation and thermal efficiency, the exhaust temeprature is higher as the biogas supply rate is higher at a specified excess air ratio.
For 240 and 260 L/min, the waste gas temperature decreases with an increase of λ that is unexpected intitutely. However, the maximum temperature differences are only 11˚C between λ= 0.77 and = 1.13 for 240 L/min and λ= 0.81 and = 1.01 for 260 L/min, respectively. If considering the total enthalpy of the gas flow (~mCPΔT
•
), then the one with larger λ is greater. Apparently, it is resulted from the dilution effect by the larger amout of gas due to higher air supply rate. For the cases of 180 and 200 L/min, their trends agree with that the maximum temperature occurs around stoichiometric point and it is decendent toward the fuel-rich (λ < 1) and fuel-lean (λ > 1) regions. The behavior of 220 L/min is somewhat in between of 240 and 200 L/min.
40
at different fuel supply rates, and Fig. 4.6 is the CO2 one, deduced
directly from the previous two measuements inside the analyzer. These data are also presented in the row 6 to row 8 in Table 4.1a~e. Because they are expressed by in percentage values but not absolute ones, this study applies the measured O2 data in the waste gas by neglecting CO
concentration (in ppm) to estimate the consumed percentage of CH4 in
the combustion process. The procedure is given as follows:
The balanced reaction is:
CH 0.67CO 2λ O 3.76N O CH 2 2 H O
1.67 CO 7.52λN (4.1) where a is the moles of O2 and b is the moles of CH4 in waste gas. a can
be calculated from the percent of O2 in waste gas as follow:
mole fraction % of O . AF λ (4.2)
where 1.67+AF λ is the total moles in waste gas. b is obtained from the atom balance as:
1 λ (4.3)
The percent of CO2 in waste gas can also be calculated by:
mole fraction % of CO . .AF λ (4.4)
41
Percentage of consumed CH % CH CH CH (4.5)
The estimated vaules of consumption percentage of CH4 in combustion
reaction are presented in the tenth row, and followed by the corresponding estimated CO2 mole fractions (11th row), served as
comparison with the ones calculated from analyzer, in the same table. It can be seen that the differences of CO2 mole fraction between the
estimations and the ones calaulated from the analyzer are around 5%, which should be acceptable for experimental works.
Figure 4.7 shows the estimated CH4 consumption ratio as a function
excess air ratios. It can be seen that the consumption ratio increases with an increase of fuel supply rate, which is consistent with the trends of power generation and thermal efficiency in Figs. 4.1 and 4.2, except for the last points for 180 and 220L/min. It indicates that a higher power generation and better thermal efficiency need to be accomplished by a greater conversion of CH4 in the biogas. As to the deviation for the two
points, it is because that for normal operation, the lower limit of biogas supply rate into the engine is around 220~240L/min, whereas the engine is about to shut down at excess air ratio over 1.1 when biogas supply is below 220L/min, resuting in the abnormal behaviors.
To sum up the results of this section, for biogas supply rates of 240 and 260L/min, the power generated increases with the excess air ratio (λ) until the limiting ones at 1.13 for 240L/min and 1.01 for 260L/min are reached. Because of the limit of engine volume, it is impossible to know the critical point that the performance starts to drop. For biogas