is the propagation constant, and q is
a
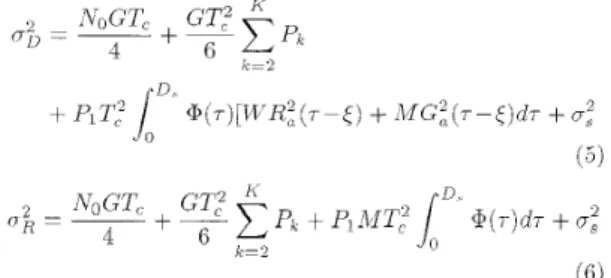
random variable corre- sponding to shadowing which is lognormally distributed with a mean of OdB and a standard deviation of o,dB. For a large number of users, the P D F of MA1 is usually assumed to approxi- mate a Gaussian process with a variance equal to the sum of vari- ances of iiidividual interfering users. In a reverse link of a DS/ CDMA system, other users transmit with orthogonal PN codes and their signals fade independently. The desired user (reference user) is assumed to be user 1. The effect of AWGN, MAI, fading and shadowing is incorporated into acquisition analysis simply by increasing the variance of interference [ 11. For an asynchronous DSiCDMA system, the variances of detecting and reference MFs are given bywhere G = T/T, is the processing gain, T, is the chip duration. P , is the signal power of desired user; D, is the multipath delay spread, M is MF length, @(,,02 is the average channel output power, z-6 is delay the difference between the received and local PN codes in detecting MF, W is covariance between individual samples of transmitted signal within MF, R,(.) is the autocorrela- tion function of the transmitted PN code, and GJ.) is a function representing self-noise. It is assumed that %(.) is zero and G,(.) is unity owing to orthogonality of the reference code and the trans- mitted code. For a perfect power control, Pi, = P(k = 2, . _ . j K ) . The PDF of the squared sum of the M F correlator outputs is dis- tributed with two degrees of freedom. The acquisition scheme has two modes of operations: a search mode and a verification mode. The detection and false alarm probabilities of search mode are given by
where t = 2uR2 is estimated in reference MF,
p
is a gain factor of reference branch, and dD2 = ciR2 is variance of H, cell in detecting M F . The acquisition process is modelled as a discrete-time Markov process. The mean acquisition time is derived by the same procedure used by Ibrahim and Aghvami [2] in the circular state diagram.10’
I U 1 , I
10 20 30 40 50 60 70 80 90 100 number of u s e r s
Fig. 1 Mean ucyuisition time agoinst numlxr oj users iriili imperject p o u v r control
Analytic: X 0 = 2dB, 0 o = 1 dB, A G), = OdB Simulation:
goll
= 2dB, +“o,, = l d B , X o, = OdBResults unnd dkcussion: Assuming that both reverse and forward links suffer from identical shadowing, a mobile user estimates sig- nal strength by measuring the pilot signal, and controls its trans- mission power. For numerical examples, the phase adjustment parameter A = 112, the penalty factor caused by a false alarm 106 (chips). PN code length 2I5-l (chips), chip rate 2Mchip/s, J,T, = 10 3 . delay spread D , = 3T, (frequency-selective fading), processing
gain G = 128, M F length M = 512, p = 4, and the exponential multipath intensity profile [2] for @(z) was assumed. The thresh- olds of search and verification modes were chosen to minimise mean acquisition time in each situation. The number of verifica- tion mode tests and the number of successful verification tests were chosen as four and two, respectively. The gain factor
p
was chosen to ensure minimum false alarm probability and maximum detection probability in each SNWchip. In Fig. 1, mean acquisi- tion time against number of users is shown for an M F - R F acquisi- tion scheme with power control error as a parameter. The numerical example is shown for an SNRichip -1OdB and standard deviation of shadowing 0% = 8dB (a typical value for an urban environment). The analytic result is confiimed by Monte-Carlo simulation. For a perfect power control, the logarithmic standard deviation op is 0 dB. Imperfect power conti-01 increases inean acquisition time substantially when the standard deviation of the received power is > 1 dB. The other acquisition schemes (an M F scheme 131. a parallel M F scheme [4], a parallel M F - R F schemer [5]. and a hybrid acquisition scheme) have also been analysed for imperfect power control by analytic approaches and simulations. As a result of the analysis, we reached the same conclusion as in the MF-RF case. that power control error > l d B increases mean acquisition t h e very significantly. Therefore, the power control must be accurate within IdB, and be fast enough to compensate for the Rayleigh Fading effect as well as for the shadowing effect. The considerations in this Letter can be applied to the reverse link design of a DSiCDMA system for packet-type services.C IEE 1996
Electroizic~ Letters Online No: I9960830
J.Y. Kim and J.H. Lee (Conzmunications und Coding Theory Lubomor?, Deparrinent of Electronics Engineering, Seoul National Liiiyersitj., Sun 56-1, Sliillim-dong, Gwclncllc-gu, Seoul, 151-742, Korea)
2 May 1996
References
K A P P A P O R T . T s : ‘Wireless communications: Principles & practice’
(Prentice-Hall Inc. 1996)
I B R A H I M . B B.. and 4GHVAM1, A.H : ‘Direct sequence spread Spectrum matched filter acquisition in frequency-selective Rayleigh fading channels‘. IEEE J. Sel. Areus Convwn., 1994, SAC-12, ( 5 ) , pp. 885-890
POLYDOROS. A . and WEBER. c L : ‘A unified approach to serial search spread-spectrum code acquisition - part 11: a matched-filter receiver’. IEEE Tiztiis. Coi?tmun., 1984, COM-32, ( 5 ) , pp. 550-560 S O L R O L R . E . and GUPTA, s.c : ‘Direct sequence spread spectrum parallel acquisition in a fading mobile channel’, IEEE Traits.
Coi~7iniiii.. 1990. COM-38, (7), pp. 992-998
K M J Y- . and LEE. J.H : ‘Parallel acquisition scheme for direct- sequence spread-spectrum multiple-access packet radio communication‘, Election. Lett., 1995, 31, (12), pp. 948-950
Estimation
of the Gilbert model parameters
using the simulated annealing method
T.-H. T a n a n d W.-W. ChangIritlesing terms. Sirxuloted unneoling, Error statistics
An estimation method based on the simulated annealing algorithm is proposed for computing the Gilbert model parameters from sample error sequences. Experimental results indicate that the siniulated annealing method yields estimates which more closely match the experimental error statistics.
Introduction; Transmission bit errors encountered in most Idigital mobile radio channels are found to cluster in bursts. There have been numerous parameterised models proposed to characterise such channels with memory [l]. In this Letter, we have placed the emphasis on Gilbert's two-state Markov chain model
[:!I.
As shown in Fig. 1, there are no errors in state G (good state), while errors occur in state B (bad state) with the probability I--h. To simulate the channels' bursty nature, the state transition probabil- ities P and p are small, such that the probabilities Q and q of per- sisting in G and B states will be high. The principal difficulty encountered in estimating the Gilbert model parameters {P. h, p}is that the parameters are not directly observable, so methods of deducing them from easily measured error statistics must be con- sidered. This task can be carried out either by exponential curve fitting [2] or by using the gradient iterative method [3]. The former method is subjective and unreliable, but it can provide good initial values for further analysis. As regards the gradient iterative
method, it only allows downhill moves along the cost function, and hence can easily trap the final solution into a local optimum.
Error file Method
P h P'
Fig. 1 Gilbert's model
Data 1 (BER=l.3%) Data 2 (BER=0.50/,) Gradient Annealing Gradient Annealing
0.00461 0.00378 0.00104 0.00093 0.86851 0.84500 0.88899 0.90879 T o compensate these shortages, we propose an estimation method
based on a simulated annealing algorithm [4] which allows the per- mutations to move uphill in a controlled fashion. It has been shown that for almost any starts, successive iterations of the simu- lated annealing algorithm would converge asymptotically to the global optimal solution with probability one [5].
P Initial cost
Final cost Error sequence characterisation: The dynamics of sample error
sequences are described by the error gap distribution i"(0ll) which gives the probability that at least rn successive error-free bits will be encountered next, given that an error bit has just occurred. In many applications [2], it suffices to postulate that the error gap distribution can be well approximated by the sum of two exponen- tials i.e.
under the constraint that a,
+
oc,
= 1. Proceeding in this way, the original descriptive modelling problem can be formulated ;as one of optimal identification of two pairs of parameters {a?,P I ]
This can be accomplished by minimising the sum of quadratic errors between the measured error gap distribution and its modelled fit. Accordingly, we define a cost fuiiction for the overall error gap distributions as follows: P ( 0 n q l ) = a1Br"+
a2I3y (1) ?E
= - y ( m ) - log,,cvz3F
] I T " L = l 'rrL[
L = l('4
where M is the longest interval between two consecutive errors and y(m) is the measured value, expressed logarithmically, of the error gap distribution. As we shall see later, the minimisalion of
cost can be achieved using the simulated annealing technique. Given that the optimal values of { a l ,
PI, p2}
have been deter- mined, the model parameters { P , h g ) can be calculated as follows [21 : 0.03667I
0.03895 0.02320I
0.01570 1.90131 0.73350 0.043201
0.02950 0.01174I
0.00599 P = (1 - P1)(1 - 1%) (1 - h,)Proposed estinzation scheme: The estimation of {a,,
PI}
can be viewed as being constructed in two steps: first, to save computa-ELECTRONICS LETTERS 4th J u l y 1996 Vol. 32 No.
tion time, an exponential curve fitting technique was performed to locate the region U that is likely to contain the optimal solution. Then, the simulated annealing technique is applied to determine the global optimal solution which minimises the cost function. Basically, the simulated annealing method consists of two nested loops: the inner one proceeds until the equilibrium condition is satisfied, while the outer loop is terminated at a very low tempera- ture. A detailed description is outlined below.
(i) Set an initial temperature T(0) = loo,, where the standard deviation 0, of the costs is empirically determined to be 0.5. Also,
an initial state uo =
{a,O,
PIo,
p:}
is chosen from U with a cost function C(uo).(ii) A new state which belongs to U is generated using a random
perturbation mechanisim. Let AC denote the cost difference
between new and old states and rand([0,1)) denote a random number uiiiformly distributed between 0 and 1. The new state is accepted if either AC < 0 or e-Ar37 > rdnd([0,1)) is satisfied, other- wise the new stale is rejected.
(iii) In the inner loop, for each temperature T, if the following equilibrium condition has been reached at the n-th iteration:
12.
exP{[aa - c(u%)l/T)/n
<
c
2= 1then the algorithm stops and goes to step (iv), else repeats steps (ii)-(iii). The value of
<
is empirically chosen to be 1.0 and q(, = C:., C(u,)/n,, where nu is the number of accepted states.(iv) The cooling schedule is performed according to T(k) = To/ ( k t l ) , where
IC
is the index of the outer loop.(v) If T i s sufficiently small (in the order o f 10 3), then the pro-
gram ends the outer loops and finds the optimal solution, else returns to step (ii).
r
l o : o O 1 0' lo2 lo3 lo4 error gap length,rn 112oizj
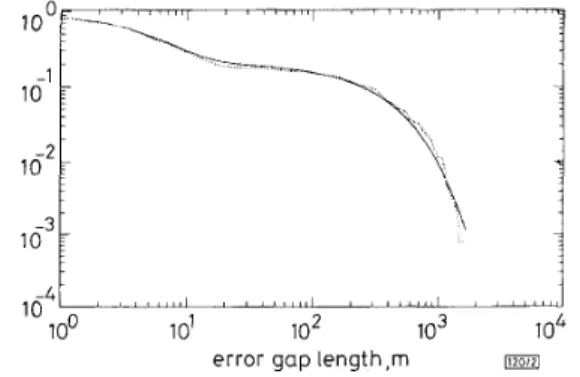
Fig. 2 Experimental error gap distribution and its Gilbert's Madcov modelled f i t
~-~~ experimental distribution
_ _ modelled fit by simulated annealing
Table 1: Comparative results of gradient method and simulated annealing method
Experimentul results: The effectiveness of the proposed scheme for channel modelling was substantiated experimentally using two data files, referred to as datal and data 2, with bit error rates of 1.3 and 0.5'%. They are generated, respectively, from Gilbert's model using different pairs of model parameters { P , h, p } = (0.003, 0.84, 0.034) and ( P , h, p} = 10.002, 0.945, 0.02}, each with a length of 100,000 bits. Table 1 presents the comparative scores associated with the simulated annealing scheme and the gradient iterative method. Study of these scores suggests that the simulated annealing technique is preferable to the gradient method for use in estimating the Gilbert model parameters. As shown in Fig. 2, for
the case of data 1, the resultant modelled fit provides an approxi- mation of the experimental error gap distribution to a reasonable
degree of accuracy. To elaborate further, the leaining curves of different estimation algorithms are illustrated in Fig. 3. The results indicated that the simulated annealing method cannot only yield better estimates, but can also converge to the final solution more quickly. 0 ‘$ ! $&.$ 1 .
+-f-?
’- - A,
--i L, .. .. .. ! IConclusions: This Letter explores the benefits of a simulated annealing algorithm for use in estimating the Gilbert model parameters. Experimental results indicate that the proposed method can obtain better estimates than does the gradient iterati\ e method.
0 IEE 1996
Electrurrics Letters Oiilinc. N o : I9960840
T.-H. Tan and W.-W. Chang (Dqxivrnieizr q f Corniizuiiicutioii Engineering, Nutional Chiao Tung University, Hsiizclni 30050, T~iili.ur7, Repuhlic q f Cliiiza)
22 April 1996
References
1 KANAL. L N , and SASTRY. ARK.: ‘Models for channels with menior? and their applications to error control’, Proc. I€€€. 1978. 66. (7).
pp. 724-744
2 CTLBEKI. E.N : ‘Capacity of a burst-noise channel‘. Be/[ Sj..sr. Tech. J . , 1960, 39. pp. 1253-1265
3 CHOUINARD. J -Y , LECOURS, M . , and DELISLE G Y : ‘Estimation of Gilbert’s and Fritchman’s models parameters using the gradient method Tor digital mobile radio channels‘, I € € € Trciizs. Veh. Technol., 1988, 37. (3), pp. 158-166
4 K IR IWA T RICK , s., GELARTT, c D., and VECCHI. M P : ‘Optimisation b j simulated annealing’, Science, 1983, 220, pp. 671-680
5 AATs. F., and KORST, J : ‘Simulated annealing and Boltzmann machines: A stochastic approach to combinatorial optimisation and neural computing’ (Wiley, New York: 1989)
Exact calculation of buffer contents variance
and delay jitter in
a
discrete-time queue with
correlated input traffic
S. Wittevrongel
andH. Bruneel
Indexing tevms: Discrere time systems, Queueing theory, Asyncluvnou~s traitsf& uriodr
A discrete-time queucing system with infinite buffer size and a finite number of independent heterogeneous two state on/off sources is considered. Exact closed-form expressions are derived for the variances of the buffer contents and the delay. In passing. the correctness of a conjectui-e recently made by Pieloor and Lewis [3] is proved.
Introduction; Discrete-time buffer systems have been studied quite extensively in the past couple of years, since they can be used to model statistical multiplexers and switching elements in ATM-
based communication networks. Moments of the buffer contents and the cell delay are useful performance measures for these sys- tems. Most of the previous analytical work in this respect concen- trates on the calculation of closed-form expressions for the mean values of these quantifies, see e.g. [l, 21. In comparison, little research effort has been spent on the derivation of similar expres- sions for the corresponding variances. Recently, Pieloor and Lewis [3] proposed an expression for the variance of the queue popula- tion in a discrete-time queue fed by a number of independent het- erogeneous onioff sources, with geometrically distributed onioff periods. Using numerical studies they showed their formula to be accurate, and hence they claimed it to be exact. However, no rig- orous proof of its correctness could be provided. We present a method for the exact calculation of not oiily the buffer contents a-ariance, but also the cell-delay variation in the above queueing system. Besides allowing us to prove the conjecture by Pieloor and Le\.\ is [3]. we expect that the techniques presented in this Letter can also be adapted to derive these variances in the case of more general correlated arrival processes.
Queueing i-izodel description: We consider a discrete-time single server queueing system with infinite storage capacity. Time is divided into fixed length slots, such that one cell can be transniit- ted from the buffer during each slot. The buffer is fed by N inde- pendent heterogeneous traffic sources. Each source stochastically alternates between on periods, during which it generates one cell per slot. and off periods, during which it generates no cells. In this Letter, (the lengths of) the on periods and the off periods of source 17 (1 5 17 5
N)
are modelled as geometric random variables mith parameters U,, and f3,. respectively. The average load o,, of source 71: i.e. the steady-state probability that source n generates a cell during an arbitrary slot, is then given by o,, = (1-p,J/(2<,,-pn). Also. as in [4]; we define the ‘time scale parameter’4,
of source n as the ratio of the mean length of an on period (or an off period) in our model. to the corresponding quantity in the case of a Ber- noulli arrival process, i.e.K,
4
(lks,,)/(l-u,,) = o,,/(l-Ptt). High values of4,
indicate a high degree of correlation in the cell arrival process.B ~ f l e r coiitents wrinnce: Let e, denote the number of cells gener- ated by source n during an arbitrary slot in the steddy-state, and let s’ indicate the ‘system contents’, i.e. the number of cells present
in the buffer including the possible cell under transmission, at the start of the next slot. We define the joint probability generating function (PGF) of the vector (el, ..., e,, s) as
where
4 . 1
denotes the expected value of the argument. In a simi- lar “ay as described in [2] for the homogeneous traffic case, the following functional equation can then be established for P ( x , , ...,.Y., . .):
,
I))
1 - (I1
+
Q 1 Z 1 I 1 - ah,+
CYIVZNZA
+
(1 - / h ) Z I Z ’ ” ’ ’ P N+
(1 - pN).nr.where p is the total input load, i.e. p = Ch,,o,.
Unfortunately, it is not a simple matter to derive P ( x , , ..., xhrr z)
from this equation. In spite of this, explicit expressions can be obtained from eqn. 2 for all the moments of the system contents distribution in a rather straightforward manner. To do this, first of all the desired moment in terms of the consecutive partial deriv- atives of the function P(xl, ..., x,,~, z) with respect to z , for x,, = 1, 1 5 I I 5 .V, and z = 1 must be expressed. Secondly, these partial derivatives must be evaluated using eqn. 2. The mixed partial derivatives with respect to xr, and z of the P-function, that appear during this calculation, can be eliminated from the results by expressing them in terms of others again by using the functional eqn. 2.