DOI: 10.1002/
Article type: Communication
Multitheragnostic Multi-GNRs Crystal-seeded Magnetic Nanoseaurchin for Enhanced In-vivo Mesenchymal Stem Cell Homing, Multimodal Imaging and Stroke Therapy
Po-Jung Chen1,a, Yi-Da Kang1,a, Chen-Huan Lin2,a, San-Yuan Chen1,* ,Chia-Hung Hsieh3,*,
You-Yin Chen4,*, Chun-Wei Chiang2, Wei Lee2, Chung-Y Hsu5, Lun-De Liao6,10, Chih-Tai
Fan7, Meng-Lin Li7,8, and Woei-Cherng Shyu2,9,*
1Department of Materials Science and Engineering, National Chiao Tung University, No.
1001, Ta-Hsueh Rd., Hsinchu, Taiwan 300, R.O.C
2Center for Neuropsychiatry and Department of Neurology, China Medical University &
Hospital, Taichung, Taiwan, R.O.C
3Graduate Institute of Basic Medical Science, China Medical University, Taichung, Taiwan,
R.O.C
4Department of Biomedical Engineering, National Yang Ming University, No.155, Sec. 2,
Linong St., Taipei, Taiwan 112, R.O.C.
5Graduate Institute of Clinical Medical Science, China Medical University, Taichung, Taiwan,
R.O.C
6Singapore Institute for Neurotechnology (SINAPSE), National University of Singapore, 28
Medical Drive, #05-COR, 117456 Singapore.
7Department of Electrical Engineering, National Tsing Hua University, Hsinchu, Taiwan,
R.O.C.
8Institute of Photonics Technologies, National Tsing Hua University, Hsinchu, Taiwan,
R.O.C.
10 Institute of Biomedical Engineering and Nanomedicine, National Health Research
Institutes, 35 Keyan Rd., Zhunan Town, Miaoli County, Taiwan, R.O.C.
a Po-Jung Chen, Yi-Da Kang, Chen-Huan Lin contributed equally to this work.
*Correspondence should be addressed to either of the following:
Prof. Chia-Hung Hsieh
Graduate Institute of Basic Medical Science, China Medical University, Taichung, Taiwan, R.O.C
E-mail: [email protected] Prof. You-Yin Chen
Department of Biomedical Engineering, National Yang Ming University, No. 155, Sec. 2, Linong St., Taipei, Taiwan 112, R.O.C.
E-mail: [email protected]
San-Yuan Chen, Department of Materials Science and Engineering, National Chiao Tung University, No. 1001, Ta-Hsueh Rd., Hsinchu, Taiwan 300, R.O.C
Email: [email protected];
Woei-Cherng Shyu,Center for Neuropsychiatry and Department of Neurology, China Medical University & Hospital, Taichung, Taiwan, Republic of China
Email: [email protected]
Keywords: Multitheragnostic Multi-GNRs Crystal-seeded Magnetic Nanoseaurchin,
The ability of stem cells to prevent neuronal cell apoptosis, inhibit pro-inflammatory cell recruitment, secrete multiple neurotrophic factors and promote neural differentiation makes stem cell treatment (SCT) a promising regenerative therapeutic strategy for several diseases, such as stroke, amyotrophic lateral sclerosis, acute myocardial infarction, cancer therapy and liver cirrhosis[1-7]. Although various types of stem cells, including neural
progenitor cells (NPCs), mesenchymal stem cells (MSCs), endothelial progenitor cells (EPCs), and human umbilical cord blood cells (HUCBCs) have been shown to be effective in animal studies for stroke therapy through the intracerebral (IC) delivery route [8, 9], more
invasive and limited cellular distribution as well as cell delivery to untargeted areas[10] have
created serious concerns for ischemic stroke treatment[11, 12]. Recently, intravenous (IV) and
intra-arterial (IA) systemic infusions have been considered to be minimally invasive and convenient approaches with a wide distribution of injected cells, but less than 10% of cells can only move toward the target site[13]. This reveals that it is significant for the transplanted
stem cell homing and monitoring to the ischemic and injured sites in the brain to exert their therapeutic effects. However, many animals are needed to monitor transplant dynamics of a graft over a long period of time due to restricted one specific time point. In this condition, for clinical use, it is critical to develop multimodal and noninvasive in vivo imaging approaches to track stem cells, monitor their homing, migration and proliferation, assess therapeutic response, and confirm the transplantation parameters such as optimal time window and route for optimizing cell delivery of the treatment of stroke and maximizing the therapeutic benefit. Recently, labeling stem cells with superparamagnetic iron oxide (SPIO) particles has been used to provide a noninvasive method for tracking the fate of the administered stem cells in
vivo by magnetic resonance imaging (MRI)[14-17], but the contrast generated by SPIO-labeled
cells is not specific due to ambiguous background from negative image contrast artifacts, e.g., hemorrhage, air, and microvascular obstruction in the infracted brain area. In contrast, photoacoustic imaging (PAI) can overcome the intrinsic limits of current imaging techniques
by converting the absorbed light to an outgoing thermoacoustic wave for reconstructing images[18]. The brightness mode (B-mode) ultrasound can localize the delivery catheter near
the diseased site so that PA imaging with normal B-mode ultrasound can provide quantitative and noninvasive real-time in vivo tracking[19-21]. However, it has been a challenge to develop a
multifunctional nanoarchitecture to simultaneously enable effective targeted delivery of stem cells and monitoring of the stem cells during real-time injection as well as post-transplantation stage by external magnetic navigation. In our previous work, we reported that a nanobead with gold nanorods embedded into mesoporous silica could be used to provide stable and highly efficient photothermal tumor ablation[22]. In this work, we designed a new magnetic
nanoprobe with biomimic nanoseaurchin by first embedding iron oxide nanoparticles into mesoporous silica nanoparticles followed by seeding multi-gold nanorods (multi-GNRs) (GRMNBs) with the goal of providing reliable magnetic targeting of stem cells and highly stable dual-modal MRI and PAI for stroke therapy. We applied intravenous transplantation of GRMNB-labeled umbilical cord-derived mesenchymal stem cells (UMSCs) navigated by a skull magnet to investigate the therapeutic efficiency in stroke mice with increased targeting of labeled UMSCs into the stroke brain. To the best of our knowledge, this multifunctional theranostic nanoprobe provides exceptionally highly stable and magnetically enhanced dual-modal bioimaging. In addition, the magnetically controllable nature offers great advantages for guiding/homing/delivery of stem cells for stroke therapy applications.
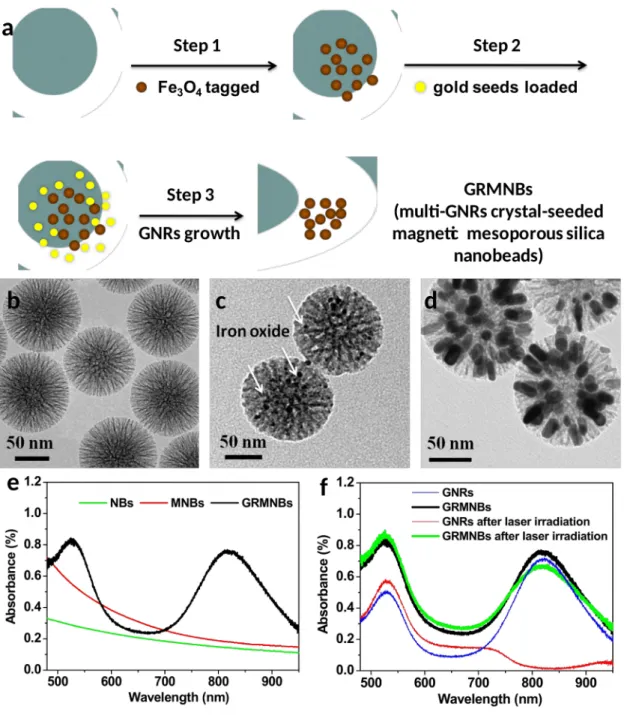
The synthetic protocol of the multi gold nanorods (multi-GNRs) crystal-seeded magnetic mesoporous silica nanobeads (GRMNBs) is schematically illustrated in Figure 1a. The 3-aminopropyltrimethoxy silane-functionalized mesoporous silica nanobeads were first synthesized using an organic template method. The morphology and particle size of the resulting nanobeads were analyzed by transmission electron microscopy (TEM) (Figure 1b). Nearly monodispersed spherical porous nanobeads with an average size of 130 nm in diameter were synthesized. For the tagging process, the meso-2,3-dimercaptosuccinic
functionalized iron oxide nanoparticles (DMSA-Fe3O4 NPs) were chemically anchored via
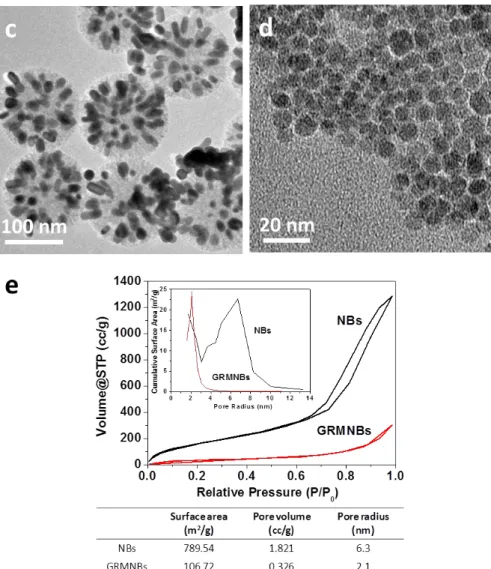
hydrophilic interactions (or van der Waals interactions), where the amino groups of the silica nanobeads and the thiol groups of iron oxide NPs were intermolecularly inserted to form a stable, interdigitated configuration. As shown in TEM images (Figure 1c), the iron oxide NPs (black dots) were incorporated into the mesoporous silica to form magnetic nanobeads. Subsequently, the magnetic nanobeads were immersed into the gold-containing solution to allow a subsequent seeding and growth of gold nanorods evolved from the nanoporosity (Figure 1d). The successful loading and growth of iron oxide and gold nanorods in magnetic mesoporous silica nanobeads were further evidenced by scanning electron microscopy analysis, transmission electron microscopy for elemental mapping and energy-dispersive X-ray spectroscopy analysis (Figure S1a-d). A Brunauer-Emmett-Teller (BET) analysis further showed a considerable reduction in surface area and average pore size from 789.54 m2g-1 and
6.3 nm (radius) for mesoporous silica nanobeads (NBs) to 106.72 m2g-1 and 2.1 nm for
GRMNBs (Figure S1e), which demonstrated that the nanoporosity of the silica nanobeads was extensively filled with the iron oxide NPs and gold nanorods.
A typical UV-Vis extinction spectrum of silica nanobeads (NBs), magnetic silica nanobeads (MNBs) and GRMNBs is shown in Figure 1e. As compared to MNBs and NBs, the UV-Vis spectrum of the GRMNBs displayed two extinction bands (~525 nm and ~810 nm). After being irradiated with 200 laser pulses at 10 mJ/cm2 fluences, a remarkably
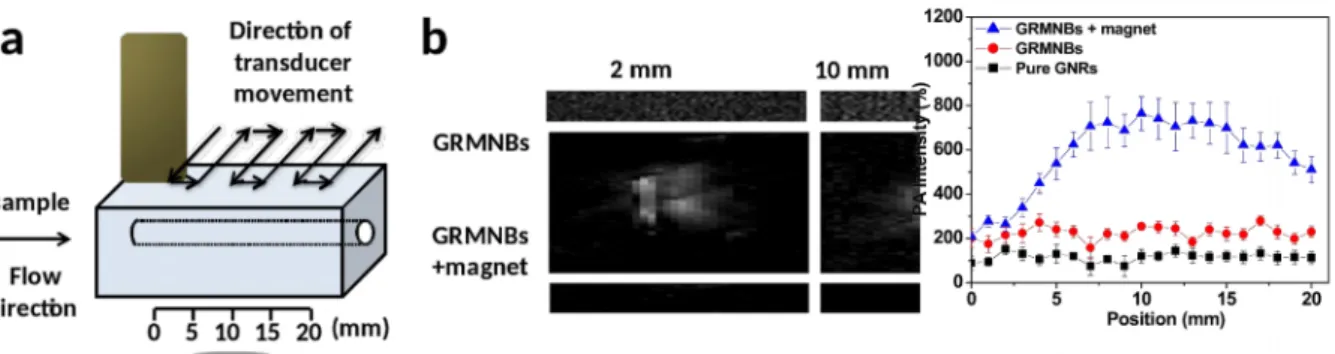
decreased amplitude and a strong peak shift were observed for the gold nanorods (GNRs) as compared to the GRMNBs with the gold nanorods confined within the porous silica matrix, indicating that the mesoporous silica matrix had a stabilizing effect on the gold nanorods to prevent structural collapse (Figure 1f). The results suggested that the newly synthesized GRMNBs are a promising contrast substance for long-term PA imaging application. To verify the enhancement of PA signals by pure gold nanorods (GNRs) and GRMNBs with/without external magnet, a phantom experiment that allowed particle flow through a tube was used as
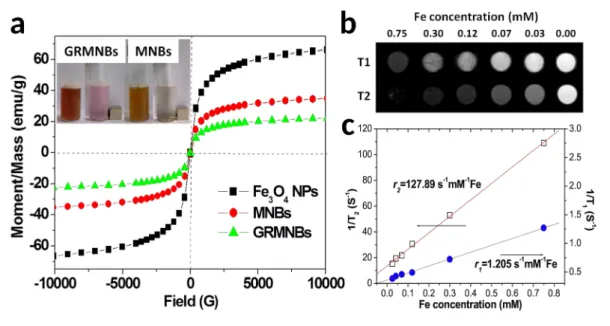
a test platform, and the external magnet (5 mm in diameter, 0.5 mm in height, 1000G) was placed beside the tube to examine the influence of magnetic guide (Figure S2). The GRMNBs showed significant contrast enhancement for the PA signal with the presence of an external magnet, enhancing the PA signals to 7.2 times that for pure GNRs. Furthermore, we measured the saturation magnetization (Ms) and MR relaxivities of iron oxide nanoparticles (Fe3O4 NPs), magnetic silica nanobeads (MNBs) and GRMNBs (Figure S3). The r1 and r2
values of the GRMNBs were 1.205 s-1mM-1 Fe, and 127.89 s-1mM-1 Fe, respectively, which
performed well as a T2- type MR contrast enhancement agent for cell or molecular imaging
and diagnostic applications.
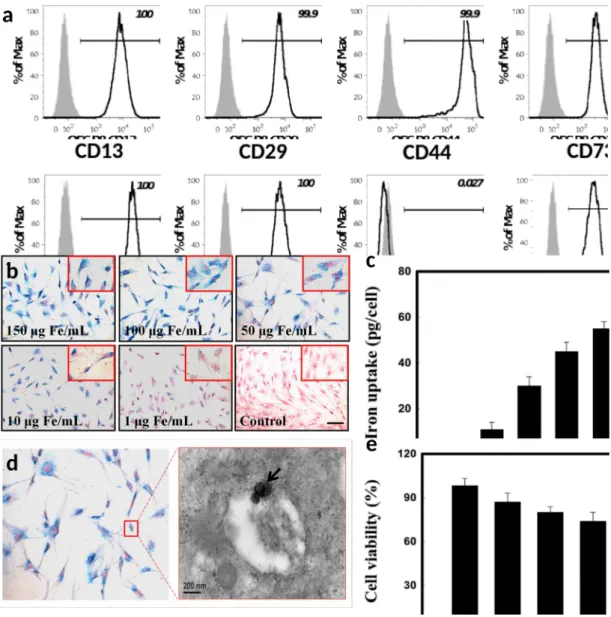
We prepared the primary cultures from Wharton’s jelly (WJ) and analyzed the cell morphology and biological properties (Figure S4). The flow cytometry revealed that the cells were negative for CD34 and HLA-DA, but positive for CD13, CD29, CD44, CD73, CD90, CD105, CD166 and HLA-ABC (Figure 2a). These observations indicate that umbilical cord mesenchymal stem cells (UMSCs) isolated from the WJ of human umbilical cords have the same surface markers as those of mesenchymal stem cells (MSCs), consistent with observations of bone marrow MSCs[23]. To optimize the UMSC labeling condition, uptake of
GRMNBs in UMSCs distributed in the perinuclei region was investigated in a dose-dependent manner by Prussian blue staining (Figure 2b). Atomic absorption spectrum measurement demonstrated that the intracellular iron of the cells increased with the concentration of GRMNBs (Figure 2c). TEM image further showed that the GRMNBs were taken up by the UMSCs and accumulated in cytoplasm vesicles and endosomes (Figure 2d). The cell viability was also evaluated and there was higher particle uptake and lower cytotoxicity in cells labeled with GRMNBs at 10 μg Fe/mL for 2 h (Figure 2e), which was used for the subsequent in
vitro and in vivo studies.
The cell proliferation assay by BrdU incorporation and migration by transwell assay (Figure S5) revealed that GRMNB labeling and magnetic field (M) did not affect the
GRMNBs-UMSC cell proliferation and migration in vitro compared to unlabeled UMSCs after 14-h of incubation. Since the association between longer nanoprobe retention and UMSC targeting is of particular importance during the time course of cell engrafting, we used confocal laser scanning microscopy (CLSM) and flow cytometry to detect the nanoprobe retention of the FITC-labeled GRMNBs cultured for different time periods, i.e., 6, 24 and 48 h, after the GRMNBs was incubated with UMSCs for 24 h. The UMSCs still showed very strong fluorescence after washing off the unbound nanoprobes (Figure S6a and S6b), which indicated a prolonged retention of the nanoprobes and favored the UMSCs moving toward the target position. Furthermore, to investigate if GRMNBs-UMSCs still possess multipotent differentiation potential, we analyzed the adipogenic, chondrogenic, osteogenic and vascular tube formation, which demonstrated that the GRMNBs-UMSCs displayed similar behavior to the plan UMSCs without GRMNBs labeling [24] (Figure S6c). The GRMNBs-UMSC
neuroglial cells were identified by immunofluorescence with MAP-2, O4 and GFAP and exhibited refractile cell body morphology with extended neurite-like structures arranged into a network as the plan UMSCs (Figure S6d). Therefore, GRMNB labeling did not influence the cell differentiation in vitro. We also performed tube attraction assay where UMSCs were labeled with 10 μg Fe/mL GRMNBs and resuspended in an eppendorf tube. It was found that the GRMNBs-UMSCs were rapidly attracted toward the magnet and accumulated at the edge of the magnet focally on the adjacent inner wall. In addition, as GRMNBs-UMSCs slowly flowed through a plastic tube under a circular perfusion pump, GRMNBs-UMSCs were captured and adhered to the inner wall of the plastic tube placed beside a magnetic field (8 mm in diameter, 2 mm in height, 2300G) (Figure S7). The cell attraction or capture toward the magnet was also dependent on the magnetic force of the magnet.
To evaluate the guiding and homing feasibility of GRMNBs-UMSCs for in vivo MRI and PA imaging, the UMSCs were further transfected with lentivirus-luciferase protein (LV-Luc), which contributed luciferase expression on the cells (Luc-GRMNBs-UMSCs). Figure 3
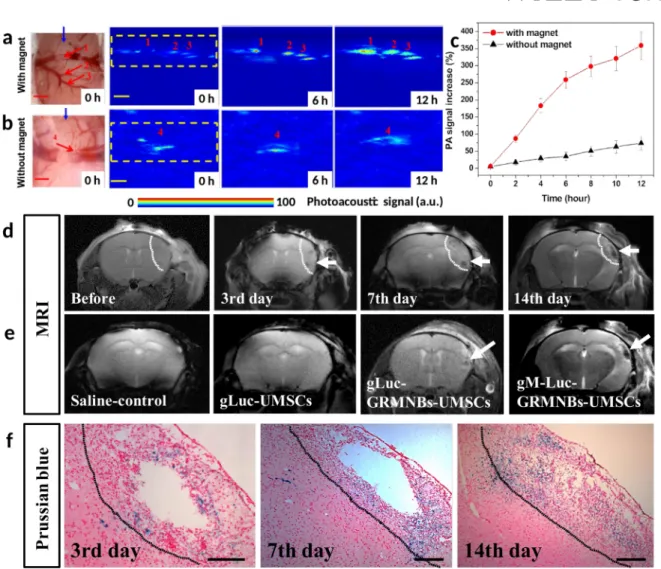
showed that the PA signal can be clearly monitored for 0, 6 and 12 hours after administration of nanoprobes to stroke mice with (gM-Luc-GRMNBs-UMSCs) and without magnet (g-Luc-GRMNBs-UMSCs). It was noted that the Luc-GRMNBs-UMSC homing to the infarcted area with the help of magnet can be significantly monitored with the PA system upon excitation at 808 nm (Figure 3a) compared to it without the use of magnet (Figure 3b). The background PA signal from blood absorption was detected to be ~0.16 before the injection, but the PA signal amplitude readily increased to 376% at 12 h after Luc-GRMNBs-UMSC injection with magnet, compared to the background signal (Figure 3c). Consequently, the PA imaging with GRMNBs provided a reliable in situ and enhanced contrast of UMSCs in the blood vessels near the brain stroke because the tissue attenuation in the infrared region is low. In addition, the PA signals from GRMNBs were safely retained, while undesired signals from the background tissue were reliably suppressed.
For long-term tracking of transplanted stem cells in stroke brain, 7-Tesla MRI is an attractive tool with high spatiotemporal localization in a noninvasive manner. After a magnet (5 mm in diameter, 0.5 mm in height, 1000G) was placed on the skull of the ischemic hemisphere, the Luc-GRMNBs-UMSCs (5 × 10⁵) were injected via mice femoral vein after
stroke (gM-Luc-GRMNBs-UMSCs). Figure S8a shows a representative image of Prussian stained brain slide in the original stroke area (black dotted line). MRI image analysis before Luc-GRMNBs-UMSCs injection and 3 to 7 days after Luc-GRMNB-UMSC injection with magnetic guiding revealed multiple hypointense signals (white arrows) located inside the stroke region (region marked by white dotted line) around the peripheral region of the stroke (Figure 3d), suggesting the obvious migration of Luc-GRMNBs-UMSCs to the stroke site. On day 14, the area of hypointensity around the ischemic hemisphere was clearly seen encompassing the stroke site. In contrast, the groups of Luc-GRMNBs-UMSCs injection without a skull magnet (gLuc-GRMNBs-UMSCs), gLuc-UMSCs and the saline-control showed little or no clear hypointensity area over the ischemic hemisphere (Figure 3e).
Furthermore, Prussian blue staining of brain slides revealed that the intensity progressively increased at the stroke site in the Luc-GRMNBs-UMSCs group with magnet (gM-Luc-GRMNBs-UMSCs) (Figure 3f) compared to other three groups (Figure S9). Importantly, gM-Luc-GRMNBs-UMSCs revealed a significant and progressive decrease in infarct size from day 3 to day 14 when compared to control group (Figure S8b). As compared to more than ten million cells (1 × 10⁷) needed for stem-cell therapy[25], we are were capable of
imaging very low cell numbers (5 × 10⁵) delivered into mouse brain by MRI, which indicates
the feasibility of using GRMNBs particles for labeling of UMSCs to track stem-cell distribution areas in the treated mice. Previous literature has demonstrated that mesenchymal stem cells delivered by either intravenous or intraarterial injection can home and migrate into the peri-infarct area to reduce the infarct size, as demonstrated by MRI and immuohistochemistry[26-29]. Although Tang et al.[17] did not observe any migrated stem cells
homing into the ischemic brain after transplantation of MSCs according to the results of 3-Tesla MRI and SPECT, significant improvement of neurobehavioral outcome was also noted in the intravenous group. In this study, the use of high-resolution MRI and external magnetic guiding might increase the frequency of observing the homing stem cells engrafted in the ischemic brain. (Or engrafted stem cells homing in the ischemic brain. Please checking) Although anti-inflammatory and trophic factors play key roles in improving neurological function after stem cell transplantation[30], recruiting more transplanted stem cells into stroke
brain should get better improvement. Therefore, in our study, in addition to high-resolution 7-Tesla MRI data, we further provided the IVIS study to demonstrate that intravenous MSC transplantation under magnet guiding can induce stem cells homing into the stroke brain to enhance functional recovery. Therefore, using GRMNBs with the enhanced imaging contrast (PA image and MR image) could enable short- and long-term follow-up of UMSC stem cells engraftment in living animals.
To noninvasively monitor Luc-GRMNBs-UMSCs transplantation homing into stroke brain, bioluminescent imaging (BLI) by IVIS was utilized to semiquantitatively assess the recruited cell volume. Significantly increased bioluminescent signal of the recruited Luc-GRMNBs-UMSCs from BLI was found in the gM-Luc-Luc-GRMNBs-UMSCs compared to gLuc-GRMNBs-UMSCs, and gLuc-UMSCs (Figure 4a and 4b). To investigate if the enhanced homing of Luc-GRMNBs-UMSCs guided by external magnetic field can induce better therapeutic effect for postischemic brain repairing, we examined the infarct volume and neurobehavioral outcomes. It was found that the infarct volume was significantly decreased in the stroke brain treated with gM-Luc-GRMNBs-UMSCs compared to gLuc-GRMNBs-UMSCs, gLuc-UMSCs and saline-control groups at 2 and 4 weeks after stroke (Figure 4c and 4d). In addition, neurobehavioral measurement by locomotor activity tests (vertical activity, vertical movement time, and the number of vertical movements) in Figure 4e showed better functional recovery in mice with gM-Luc-GRMNBs-UMSCs than gLuc-GRMNBs-UMSCs, gLuc-UMSCs and saline-control groups at 14 and 28 days after cerebral ischemia.
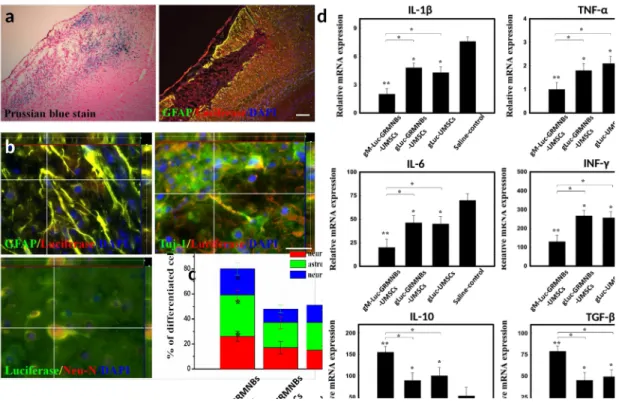
A double immunofluorescent study using CLSM was further used to analyze the co-localization of neuro-glial cell-type specific markers 28 days after transplantation. In a double immuno-fluorescent study for the corresponding region of Prussian blue staining (Figure 5a), more Luc+Neu-N+, Luc+GFAP+,Luc+Tuj-1+cells were found in the peri-infarcted area of
gM-Luc-GRMNBs-UMSCs compared to ggM-Luc-GRMNBs-UMSCs and gLuc-UMSCs (Figure 5b and 5c), which indicated that the stroke mice with transplanted GRMNBs-UMSCs can enhance the differentiation into neuro-glial cells to exert the neurogenic potential. A significant increase in rCBF was found in the middle cerebral artery cortex of the ischemic brain in gM-Luc-GRMNBs-UMSCs compared to gLuc-GRMNBs-UMSCs, gLuc-UMSCs and saline-control groups (Figure S10). In addition, we further investigated if Luc-GRMNBs-UMSC treatment suppressed the inflammatory response; the expression of various inflammatory factors was examined at 3 days after stroke. Increased expression of
inflammatory cytokines and chemokines is typically observed with many inflammatory cells infiltrating into the ischemic brain. Quantitative RT-PCR for assessing expression of various proinflammatory factors 1β, IL-6, TNF-α and INF-γ) and anti-inflammatory factors (IL-10 and TGF-β) at 3 days after stroke revealed significantly reduced proinflammatory factors and increased anti-inflammatory factors in these mRNA expression levels of gM-Luc-GRMNBs-UMSCs compared to gLuc-gM-Luc-GRMNBs-UMSCs, gLuc-UMSCs and saline-control groups (Figure 5d). According to these findings, we can propose that magnetic targeting improves short-term cell retention, thus boosting long-term engraftment. Consequently, the better engraftment translated into neurogenesis, anti-inflammation and increased cerebral blood flow with greater therapeutic benefit by both indirect (paracrine and immunomodulatory effect) and direct cell regeneration mechanisms. Taken together, our results demonstrate that GRMNB-labeled MSC transplantation combined with external skull magnetic targeting might be an efficient strategy for stroke therapy.
In conclusion, the new nano-seaurchin GRMNBs of mesoporous silica with iron oxide nanoparticles tagged and multi gold nanorods crystal-seeded have been successfully developed for stem cell homing and stroke therapy. The GRMNBs with multimodal Imaging and excellent magnetic guidance showed highly thermal stability after 808nm long-term laser pulses and in situ tracked the stem cells. The study of in vivo stroke mice demonstrated that an external magnet can be successfully used to guide the luciferase expression stem cells labeled with GRMNBs (Luc-GRMNBs-UMSCs) to the targeted stroke areas for a prolonged retention. The double immuno-fluorescent study of Luc-GRMNBs-UMSCs transplantation demonstrated that more Luc+Neu-N+, Luc+GFAP+ andLuc+Tuj-1+ cells were found in the
peri-infarcted area of gM-Luc-GRMNBs-UMSC group compared to gLuc-GRMNBs-UMSC and gLuc-UMSC groups. The mice treated with gM-Luc-GRMNBs-UMSCs showed a reduced infarct volume in the stroke brain and better functional recovery in the stroke mice after cerebral ischemia compared to other groups. Given the well-regulated design, the GRMNBs
can act as a potential dual-imaging contrast modality with improved homing and tracking of stem cells in the short-term and monitoring of long-term fate for improving stroke therapy.
Supporting Information
Supporting Information is available from the Wiley Online Library or from the author.
Acknowledgements
This work was supported by research grants from the Chen-Han Foundation for Education, Taiwan Ministry of Health and Welfare Clinical Trial and Research Center of Excellence (MOHW103-TDU-B-212-113002), China Medical University Hospital, Academia Sinica Taiwan Biobank, Stroke Biosignature Project (BM103010096), NRPB Stroke Clinical Trial Consortium (MOST 103-2325-B-039-006), Tseng-Lien Lin Foundation, Taichung, Taiwan, Taiwan Brain Disease Foundation, Taipei, Taiwan, and Katsuzo and Kiyo Aoshima Memorial Funds, Japan, Topnotch Stroke Research Center (China Medical University, CMU98-CT-24 and CMU98-CT-32). This work was financially supported by National Chiao Tung University (NCTU) and The Ministry of Science and Technology of the Republic of China, Taiwan under contract numbers of NSC97-2314-B-039-036-MY3; NSC99-2632-B-039-001-MY3; NSC100-2314-B-039-002-MY3; B-039-004; NSC101-2321-B-039-006; NSC101-2321-B-039-008; NSC102-2325-B- 039-006; NSC102-2325-B-039-001; NSC007-012-MY3; MOST 010- 011-MY3; MOST 102-2221-E-009- 023-MY3. This work was also supported by the “Aim for the Top University” program of the National Chiao Tung University and the Ministry of Education, Taiwan, R.O.C. This research was also supported by grant from the Ministry of Education to the Singapore Institute for Neurotechnology (SINAPSE), Singapore under contract number of MOE2014-T2-2-145. We also thank 7T animal MRI Core Lab of the Neurobiology and Cognitive
Science Center for technical and facility support and C. H. Hsieh and J. H. Chen of the Instrumentation Center for MRI experiments at National Taiwan University.
Received: ((will be filled in by the editorial staff)) Revised: ((will be filled in by the editorial staff)) Published online: ((will be filled in by the editorial staff))
[1] D. D. Feo, A. Merlini, C. Laterza, G. Martino, Curr Opin Neurol 2012, 25, 322. [2] S. C. Balmert, S. R. Little, Adv. Mater. 2012, 24, 3757.
[3] Y. Fan, F. Shen, T. Frenzel, W. Zhu, J. Ye, Y. Chen, H. Su, W. L. Young, G. Y. Yang,
Ann Neurol 2010, 67, 488.
[4] L. N. Manganas, M. Maletic-Savatic, Curr Neurol Neurosci Rep 2005, 5, 225. [5] B. Cao, M. Yang, Y. Zhu, X. Qu, C. Mao, Adv. Mater. 2014, 26, 4627.
[6] L. Cheng, C. Wang, X. Ma, Q. Wang, Y. Cheng, H. Wang, Y. Li , Z. Liu, Adv. Funct.
Mater. 2013, 23, 272.
[7] D. Fayol , G. Frasca , C. L. Visage , F. Gazeau , N. Luciani , C. Wilhelm, Adv. Mater. 2013, 25, 2611.
[8] K. Jin, Y. Sun, L. Xie, X. O. Mao, J. Childs, A. Peel, A. Logvinova, S. Banwait, DA. Greenberg, Neurobiol Dis 2005, 18, 366.
[9] V. Misra, M. M. Ritchie, L. L. Stone, W. C. Low, V. Janardhan, Neurology 2012, 79, 207.
[10] V. F. Segers, R. T. Lee, Nature 2008, 451, 937.
[11] Y. Li, M. Choop, J. Chen, L. Wang, S. C. Gautam, Y. X. Xu, Z. Zang, J Cereb Blood
Flow Metab 2000, 20, 1311.
[12] L. Li, Q. Jiang, G. Ding, L. Zang, Z. G. Zang, Q. Li, S. Panda, M. Lu, JR. Ewing, M. Choop, J Cereb Blood Flow Metab 2010, 30, 653.
[13] L. S. Politi, M. Bacigaluppi, E. Brambilla, M. Cadioli, A. Falini, G. Comi, G. Scotti, G. Martino, S. Pluchino, Stem Cells 2007, 25, 2583.
[14] L. Cen, K. G. Neoh, J. Sun, Fe. Hu, W. Liu, L. Cui, Y. Cao, Adv. Funct. Mater. 2009, 19, 1158.
[15] J. Riegler, A. Liew, S. O. Hynes, D. Ortega, T. O’Brien, R. M. Day, T. Richards, F. Sharif, Q. A. Pankhurst, M. F. Lythgoe, Biomaterials 2013, 34, 1987.
[16] K. Cheng, T. S. Li, K. Malliaras, D. R. Davis, Y. Zhang, E. Marban, Circ Res 2010, 106, 1570.
[17] Y. Tang, C. Zhang, J. Wang, X. Lin, L. Zhang, Y. Yang, Y. Wang, Z. Zhang, J. W. M. Bulte, G. Y. Yang, Adv. Funct. Mater. 2015, 25, 1024.
[18] M. A. Hahn, A. K. Singh, P. Sharma, S. C. Brown, B. M. Moudgil, Anal Bioanal Chem 2011, 399, 3.
[19] X. Wang, X. Xie, G. Ku, L. V. Wang, G. Stoica, J Biomed Opt 2006, 11, 024015.
[20] Y. S. Chen, W. Frey, S. Kim, P. Kruizinga, K. Homan, S. Emelianov, Nano Lett 2011,
11, 348.
[21] A. D. L. Zerda, C. Zavaleta, S. Keren, S. Vaithilingam, S. Bodapati, Z. Liu, J. Levi, B. R. Smith, T. J. Ma, O. Oralkan, Z. Cheng, X. Chen, H. Dai, B. T. Khuri-Yakub, S. S. Gambhir, Nat Nanotechnol 2008, 3, 557.
[22] P. J. Chen, S. H. Hu, C. T. Fan, M. L. Li, Y. Y. Chen, S. Y. Chen, D. M. Liu, Chem.
Commun., 2013, 49, 892.
[23] G. D'Ippolito, S. Diabira, G. A. Howard, P. Menei, B. A. Roos, P. C. Schiller, J Cell Sci 2004, 117, 2971.
[24] D. C. Ding, W. C. Shyu, M. F. Chiang, S. Z. Lin, H. J. Wang, C. Y. Su, H. Li, Neurobiol
Dis 2007, 27, 339.
[25] D. L. Kraitchman, A. W. Heldman, E. Atalar, L. C. Amado, B. J. Martin, M. F. Pittenger, J. M. Hare, J. M. W. Bulte, Circulation 2003, 107, 2290.
[26] J. Chen, Y. Li, L. Wang, Z. Zhang, D. Lu, M. Lu, M. Chopp, Stroke 2001, 32, 1005. [27] Y. Horita, O Honmou, K Harada, K Houkin, H. Hamada, J. D. Kocsis, J. Neurosci. Res.
2006, 84, 1495.
[28] S. S. Lu, S. Liu, Q. Q. Zu, X. Q. Xu, J. Yu, J. W. Wang, Y. Zhang, H. B. Shi, PLoS ONE 2013, 8, e54963.
[29] G. Chamberlain, J. Fox, B. Ashton, J. Middleton, Stem cells. 2007, 25, 2739. [30] W. C. Shyu, S. Z. Lin, M. F. Chiang, C. Y. Su, H. Li, J. neurosci. 2006, 26, 3444.
Figure 1. Representative images and physical analysis of GRMNBs. a) Schematic illustration of the synthesis and structure of the magnetic mesoporous silica nanobeads with multi gold nanorods crystal-seeded (GRMNBs). b) TEM image of porous nanobeads. c) TEM image of the iron oxide nanoparticles tagged inside the silica nanobeads (MNBs). d) TEM image of magnetic mesoporous silica nanobeads with crystal-seeded multi gold nanorods (GRMNBs). e) Extinction spectra of NBs, MNBs and GRMNBs. f) Comparison of the UV-Vis extinction spectral change of pure GNRs and GRMNBs, respectively, before and after laser irradiation with 200 laser pulses at 10 mJ/cm2 fluence.
Figure 2. Isolation of UMSCs from human umbilical cord and characterization after GRMNB labeling. a) In flow cytometry, UMSCs carried surface markers of CD13, CD29, CD44, CD73, CD90, CD105, CD166 and HLA-ABC, but were negative for CD34 and HLA-DA. b) Distribution of GRMNBs in UMSCs was found over perinuclei region after 2-h incubation in a dose-dependent manner based on Prussian blue staining. Scale bar = 50 μm c) Atomic absorption spectrum measurement demonstrated that the intracellular iron concentrations were 9.1 ± 0.24 pg/cell, 33.62 ± 2.01 pg/cell, 43.47 ± 1.42 pg/cell, 55.63 ± 1.71 pg/cell and 60.11 ± 3.24 pg/cell after the cells were incubated with GRMNBs at the concentrations of 1, 10, 50, 100, 150 μg Fe/mL, respectively. d) TEM showed that GRMNBs were taken up by the UMSCs and accumulated in cytoplasm vesicles and endosomes. e) Cell viability after labeling by MTT was 94.2% (1 μg Fe/mL), 87.6% (10 μg Fe/mL), 82.8% (50 μg Fe/mL), 71.3% (100 μg Fe/mL) and 65.4% (150 μg Fe/mL), respectively.
Figure 3. PA B-scan imaging and MRI imaging of Luc-GRMNBs-UMSCs in the hyperacute phase of a living stroke mouse brain. a) Hand microscope photographs of the cortical surface around the stroke location at 0 h and PA B-scan images of one vertical slice through the stroke location (as indicated by the blue arrow) at 0, 6 and 12 h post-stroke with injection of Luc-GRMNBs-UMSCs and application of a magnet. b) Hand microscope photographs for the stroke location at 0 h post-stroke without the help of magnet and PA B-scan images of one vertical slice through the stroke location (as indicated by the blue arrow) at 0, 6 and 12 h post-stroke with UMSCs injection only. c) Mice injected with Luc-GRMNBs-UMSCs with applied magnet showed a significantly higher photoacoustic signal than those without a magnet. d) Series T2-weighted MRI for continuous tracking of stroke recovery progress. Analysis of the M-Luc-GRMNBs-UMSC group (gM-Luc-GRMNBs-UMSCs) from one day before transplantation to 3, 7 and 14 days after transplantation revealed multiple hypointense signals (white arrows) located inside the stroke region (white dotted line area) that gradually increased from day 3 to day 14 after the transplantation. e) Prominent hypointense signal (white arrow) was noted in gM-Luc-GRMNBs-UMSCs (with magnetic
guiding) compared to gLuc-GRMNBs-UMSCs (without magnetic guiding) in MRI at 14 days after transplantation. In contrast, there was little or no hypointense region observed in gLuc-UMSCs and saline-control group. f) Prussian blue staining of stroke brain slides (black dotted line) corresponding to the above MRI revealed a progressive increase in blue intensity. The mean ± SEM is shown. *P < 0.05 and **P < 0.01 vs. control. Bar = 50 μm.
Figure 4. Luc-GRMNBs-UMSCs treatment enhanced the stem cell homing and reduced the infarct volume. a) and b) Semi-quantitative measurement by IVIS demonstrated that gM-Luc-GRMNBs-UMSC implantation showed significantly increased bioluminescent signal compared to gGRMNBs-UMSCs, gUMSCs and saline-control. c) and d) Luc-GRMNBs-UMSCs injection promoted stroke recovery. Representative images of serial coronal brain section by cresyl violet (H&E staining) demonstrated a significant reduction in infarct volume in gM-Luc-GRMNBs-UMSC group compared to gLuc-GRMNBs-UMSCs, gLuc-UMSCs and saline-control groups at 14 days after stroke. e) The functional recovery in mice treated with gM-Luc-GRMNBs -UMSCs, gLuc-GRMNBs-UMSCs, gLuc-UMSCs and saline-control groups based on locomotor activity tests at 14 and 28 days after cerebral ischemia (vertical activity, vertical movement time, and the number of vertical movements). The mean ± SEM is shown. *P < 0.05 and **P < 0.01 vs. control.
Figure 5. Increased neurogenesis and immunomodulation by Luc-GRMNBs-UMSCs trans-plantation. a), b) and c) In the corresponding region of Prussian blue staining to immuno-fluorescence colocalization, more Luc+Neu-N+, Luc+GFAP+ andLuc+Tuj-1+ cells were found
in the peri-infarcted area of gM-Luc-GRMNBs-UMSCs compared to gLuc-GRMNBs-UMSCs and gLuc-gLuc-GRMNBs-UMSCs based on a double immuno-fluorescent study. d) By real-time RT-PCR, gM-Luc-GRMNBs-UMSCs showed a significant reduction in proinflammatory factors (IL-1β, IL-6, TNF-α and INF-γ) and anti-inflammatory factors (IL-10 and TGF-β) compared to gLuc-GRMNBs-UMSCs, gLuc-UMSCs and saline-control groups. The mean ± SEM is shown. *P < 0.05 and **P < 0.01 vs. control. Bar = 50 μm.
Table of contents entry
A multifunctional nano-seaurchin probe in which mesoporous silica nanobeads with iron oxide nanoparticles-embedded and multi gold nanorods crystal-seeded (GRMNBs) are fabricated and labeled with umbilical cord mesenchymal stem cells (UMSCs) through endocytosis. This nanoplatform enables efficient magnetic remote-controlled guiding for stem cell homing, and provides dual modalities of photoacoustic imaging (PAI) and magnetic resonance imaging (MRI) for in situ tracking and long-term monitoring to achieve therapeutic efficacy.
Supporting Information
Multitheragnostic Multi-GNRs Crystal-seeded Magnetic Nanoseaurchin for Enhanced In-vivo Mesenchymal Stem Cell Homing, Multimodal Imaging and Stroke Therapy
Po-Jung Chen1,a, Yi-Da Kang1,a, Chen-Huan Lin2,a, San-Yuan Chen1,*, Chia-Hung Hsieh3,*,
You-Yin Chen4,*, Chun-Wei Chiang2, Wei-Lee2, Chung-Y Hsu 5, Lun-De Liao6,10, Chih-Tai
Fan7, Meng-Lin Li7,8 and Woei-Cherng Shyu2,9,*
1. Experimental Section 1.1 Reagents
Cetyltrimethylammonium bromide (CTAB), ethanol (99.5%), lysine, n-octane (99%), 2, 2'-azobis(2-amidinopropane) dihydrochloride (AIBA), hydrogen tetrachloroaurate (III) trihydrate (HAuCl4, 49.5% as Au), sodium borohydride (NaBH4, 99%), silver nitrate (AgNO3,
99%), L-ascorbic acid, sodium hydroxide (NaOH, 97%), Iron(III) chloride hexahydrate (FeCl3.6H2O) pure granulated, 99%, and iron(II) chloride tetrahydrate (FeCl2.4H2O) 99%
were purchased from Sigma-Aldrich. Tetraethylorthosilicate (TEOS, 99%) was purchased from Merck. Styrene monomer (99%) was purchased from Fluka.
1.2 Synthesis of porous silica nanobeads (NBs)
Cetyltrimethylammonium bromide (CTAB, 300 mg) was dissolved in a mixture of octane (45 mL) and dilute water (96 mL) at 70oC. After stirred magnetically for 20 min,
styrene monomer (8.5mL), lysine (66 mg), tetraethylorthosilicate (TEOS, 3000 mg), and AIBA (115 mg) were subsequently added to the system and stirred magnetically for 4 h. After 4 h, the heating was stopped and the suspension was cooled naturally to room temperature. The products were collected by centrifugation at 6000 rpm for 10 min and then washed 3
times with an excess of pure methanol. The template was completely removed by heat treatment at 600 oC under atmospheric conditions[1]. The 3-aminopropyltrimethoxy silane
(APTMS, 1 ml) was added to 10mL distilled water that contained porous silica nanobeads and was then stirred magnetically for 2 h. The products were collected by centrifugation at 6000 rpm for 10 min and then washed with distilled water 3 times and redispersed into distilled water.
1.3 Preparation of Fe3O4 magnetic nanoparticles (MNPs)
Magnetic nanoparticles Fe3O4 were prepared by hydrothermal coprecipitation of ferric
and ferrous ions using NaOH as base as described by Kouassi et al.[2]. In brief, iron (II)
chloride and iron (III) chloride (1:2) were dissolved in DI water at the concentration of 0.25 M iron ions. The dispersion was stirred at room temperature (25oC) for 1 h and was
chemically precipitated by adding 1 M of NaOH to keep the pH constant at 10. Product was collected by centrifugation at 7000 rpm for 10 min and washed with ethanol until neutral pH. The meso-2,3-dimercaptosuccinic acid (DMSA, 0.1g) was added into 10mL distilled water, which contained iron oxide nanoparticles, and stirred magnetically for 24 h. The products were collected by centrifugation at 6000 rpm for 10 min and then washed with distilled water 3 times. Finally, the particles were redispersed into distilled water.
1.4 Synthesis of magnetic porous silica nanobeads (MNBs)
One-mL magnetic nanoparticles with Fe concentration of 1, 10, 50, 100 and 150 μg /mL, respectively, mixed with 1mM porous silica nanobeads and stirred magnetically for 8 h. After incorporation of Fe3O4 into silica nanobeads, the products were collected by
centrifugation at 10,000 rpm for 10 min and then were redispersed into dilute water (1 mL). 1.5 Synthesis of multi gold nanorods crystal-seeded magnetic porous silica nanobeads (GRMNBs)
CTAB solution (5 mL, 0.20 M) was mixed with 5.0 mL of HAuCl4(0.0005M). To the
formation of a brownish yellow solution. Vigorous stirring of the seed solution was continued for 2 h. Furthermore, incorporation of gold seeds was achieved by swelling 1 mL magnetic porous silica beads with 1 mL seed solution and stirred magnetically for 2 h. For the gold nanorods growth, the growth solution included that CTAB (5 mL, 0.10 M), AgNO3 (0.1 mL,
0.01M), HAuCl4 (0.5 mL, 0.01 M) and ascorbic acid (55 μL, 0.1 M) was added to DI water
step-by-step. Finally, the 20 μL of the seed solution (incorporation of gold seeds with magnetic silica nanobeads) was added to the growth solution at 27-30°C. The color of the solution gradually changed within 10-20 min. The temperature of the growth medium was kept constant at 27-30 °C in all the experiments and stirred magnetically for 24 h. The final products were collected by centrifugation at 10,000 rpm for 10 min and then redispersed into dilute water (5 ml). The excess CTAB in an aqueous dispersion of GRMNBs was removed by centrifugation and subsequent extraction three times with chloroform (GRMNBs dispersion/chloroform = 2:1 (v/v)). Nanostructures of GRMNB also were investigated using transmission electron microscopy (TEM, JEM-2010, Japan).
1.6 GRMNB-labeled UMSCs labeling and intracellular iron quantification
For cell labeling, UMSCs were seeded in six-well plates and cultured with same medium containing GRMNBs at various concentrations (in iron: 0, 1, 10, 50, 100, 150 μg Fe/mL) for 2 h. After incubation, the medium was removed and cells were washed with PBS (pH 7.4) three times. To assess the intracellular iron, the GRMNB- UMSCs (5 × 10⁵) were
digested with 0.4% sodium hydroxide and 36% hydrochloric acid aqueous solution successively. The intracellular iron content was quantified by an Atomic Absorption Spectrophotometer (Z-2000, Hitachi, Japan), which was expressed in pictogram (pg) of iron per cell. To observe the subcellular location, shape and size of GRMNBs, TEM study was performed for examining GRMNB- UMSCs as previously described[3]. In brief, the
GRMNBs-UMSCs (at 0.5 mM iron) were fixed with 2.5% glutaraldehyde in 0.05 M sodium cacodylate (pH 7.2) for 40 min and embedded in 2% agarose. Then, the embedded cells were
repeatedly stained with 2% osmium tetroxide and 0.5% uranyl acetate and processed for ultrathin sectioning. Micrographs were taken with TEM (Philip CM-120, Eindhoven, Netherlands) at an acceleration voltage of 80 kV.
Viability of GRMNBs-UMSCs was assessed by MTT assay according to the manufacture’s procedures (Sigma)[4]. For this purpose, UMSCs were incubated with
GRMNBs at various concentrations (0, 1, 10, 50, 100, 150 μg Fe/mL) for 2 h. Then the culture medium was replaced by the mixture of 0.8 mg/ml of MTT. After further incubated for 4 h, the resulting medium was examined at the absorbance of 560 nm using a 96-well microplate reader (Spectra max190-Molecular Devices). Cell viability was analyzed with the software and presented as percentage of the control values.
1.7 In vitro proliferation, migration and differentiation assays
The GRMNB cellular uptake experiments were performed using the CLSM (Carl Zeiss LSM510 l). After 6 h, 24 h and 48 h incubation, the medium was removed and GRMNB-UMSCs were washed with PBS three times. The cells were then fixed with 4% formaldehyde for 30 minutes at room temperature, and the slides were rinsed with PBS three times. Finally, the cells were stained with 4,6-diamidino-2-phenylindole (DAPI) for 10 min, then rinsed with PBS three times. The slides were mounted and examined via CLSM. Meanwhile, The quantitative flow cytometric analysis was assessed the fluorescence brightness and uniformity levels of GRMNBs uptake by UMSCs after 0 h, 6 h, 24 h and 48 h incubation. For comparison of proliferation and migration of GRMNB-UMSCs with/without magnetic guide, the Bromodeoxyuridine (BrdU) incorporation and transwell migration assays, respectively, were performed as described in the Supporting information. Furthermore, the tube formations of GRMNB- UMSCs were examined by the CLSM after the adipogenic, osteogenic, chondrogenic and neural cell differentiations.
Adipogenic differentiation was induced according to the method described previously[5].
differentiation medium, consisting of DMEM-high glucose (DMEM-HG, Sigma), 100 U/mL penicillin, 100 mg/mL streptomycin, 100 mM insulin, 500 mM 3-isobutyl-1-methylxanthine, 1 mM dexamethasone, 100 mM indomethacin and 10% FCS. Cells maintained in ordinary UMSCs medium served as a negative control. The adipogenic differentiation was changed three times per week. To assess adipogenic differentiation, cells were stained with 0.3% oil red O for 10 min at room temperature, (to label intracellular lipid accumulation), and counterstained with haematoxylin.
To induce osteogenic differentiation, confluent monolayer GRMNB-UMSCs cultures were grown in DMEM-high glucose (DMEM-HG, Sigma) containing 100 U/mL penicillin, 100 mg/mL streptomycin, 50 mg/mL L-ascorbic acid 2-phosphate, 10 mM b-glycerophosphate, 100 nM dexamethasone and 10% FCS[6]. Cells maintained in ordinary
GRMNB-UMSCs medium were served as negative controls. The osteogenic differentiation medium was changed three times per week. Levels of osteogenesis were determined using Alizarin red S staining (1%) to detect calcium mineralization[7].
Chondrogenic differentiation of GRMNB-UMSCs was induced using a high-density pellet cell culture system[8]. Cells were washed in serum-free chondrogenic differentiation medium
consisting of DMEM-HG, 100 U/mL penicillin, 100 mg/mL streptomycin, 50 mg/mL L-ascorbic acid 2-phosphate, 40 mg/mL proline, 100 mg/mL sodium pyruvate, 100 nM dexamethasone, and ITS-plus (10 mg/ml bovine insulin, 5.5 mg/ml transferrin, 5 mg/ml sodium selenite, 4.7 mg/ml linoleic acid, and 0.5 mg/ml bovine serum albumin). Aliquots of 250,000 cells were resuspended in chondrogenic differentiation medium and, centrifuged at 250 × g and then 10 ng/mL TGF-ß1 (R&D Systems) were added. Pellets maintained in chondrogenic differentiation medium without TGF-β1 served as negative controls. Medium was changed twice per week. Chondrogenic differentiation of pellet cultures was confirmed histologically using Alcian blue staining of sulfated proteoglycans. In addition, endothelial cells were induced to differentiate to vascular tubes formation by culturing GRMNB-UMSCs
for 2–3 d in EBM (Cambrex) on 24-well plates precoated with Matrigel (300 μL/well; Becton Dickinson) and vascular endothelial growth factor (VEGF, 10 ng/ml, Sigma) as described previously[9].
To induce neural cell differentiation, GRMNB-UMSCs were incubated with DMEM using a three-step method. Briefly, in the neural induction step, cells were plated at low density on 6-well plates containing fibronectin, and then were exposed sequentially to (1) DMEM-HG (Sigma), containing 2% hUCS or 10% FCS, and 10 ng/mL bFGF (R&D System) for 24 h, (2) in the neural commitment step, DMEM-HG containing, 1 mM β-mercaptoethanol (βME, Sigma), and 10 ng/mL NT-3 (R&D Systems) for 2 days, and (3) in the neural differentiation step, DMEM-HG that containing NT-3 (10 ng/mL, R&D Systems), NGF (10 ng/mL, R&D Systems) and BDNF (50 ng/mL, R&D Systems) for 3 to 7 days. Following cell differentiation, GRMNB-UMSCs were washed with PBS and fixed for 30 min at room temperature in 4% paraformaldehyde. After being washed with PBS, the fixed cultured cells were treated for 30 min with blocking solution (10 g/L BSA, 0.03% Triton X-100, and 4% serum in PBS). Cells were incubated overnight at 4oC with an antibody against GFAP
(1:1000, Millipore), O4 (1:200, Millipore), MAP-2 (1:.300, Millipore) (labeled with FITC fluorochromes) and then rinsed 3 times in PBS. FITC (green) fluorochromes on the immunofluorescence-labeled slides were excited by laser beam at 488 nm.
1.8 Animal brain ischemia/reperfusion model
Adult male C57BL/6 mice (25-30 g) were subjected to two-vessel ligation. All surgical procedures were performed by sterile/aseptic techniques in accordance with Institutional Guidelines. Rats were anesthetized with chloral hydrate (0.4 g/kg, ip). Ligations of the right middle cerebral artery (MCA) and right common carotids arteries (CCAs) were performed as described previously[10]. The right CCAs were clamped with non-traumatic arterial clips.
Using a surgical microscope, a 2 × 2 mm craniotomy was drilled where the zygoma fuses to the squamosal bone. The right MCA was ligated with a l0-0 nylon suture. After 120 min
ischemia, the suture on the MCA and the arterial clips on CCAs were removed to allow reperfusion. During anesthesia, core body temperature was monitored with a thermistor probe and maintained at 37 oC using a heating pad. The Ethical Committee for Animal Research at
China Medical University and Hospital has reviewed and approved all animal experiments. 1.9 Dual-modal imaging of implanted stem cell migration in vivo
Prior to cells injection in vivo, UMSCs were first transduced with a lentivirus encoding the GFP and Luc gene as described previously[11], which contributed to luciferase expression
on the cells UMSCs). Subsequently, Luc-UMSCs labeled with GRMNBs (Luc-GRMNBs-UMSCs, 5 × 10⁵), which were magnetically sorted to exclude the free form of
GRMNBs, were transplanted via femoral vein at 30 min after stroke. Following cell injection, a magnet (5 mm in diameter, 0.5 mm in height, 1000G) was stuck onto the skull of stroke mice for magnetic guiding (N = 4). Another group of mice without magnetic guiding were regarded as a control (N = 4). To investigate the magnet fields to guide Luc-GRMNBs-UMSC accumulation in the cerebral ischemic regions real time, the PA microscope system was used to image brain vasculature with the Luc-GRMNBs-UMSCs serving as exogenous contrast agents in the hyperacute phase of living stroke mice. Subsequently, all mice were further followed and imaged by MRI and IVIS System at 3, 7, and 14 days after cerebral ischemia (see the Supporting information).
1.10 Immunohistochemical assessment
Animals were anesthetized with chloral hydrate (0.4 g/kg, ip) and their brains fixed by transcardial perfusion with saline, followed by perfusion and immersion with 4% PFA. Brain samples were then harvested, fixed further by immersion in 4% PFA, dehydrated in 30% sucrose, and frozen on dry ice. Coronal sections (6 μm thick) were cut by a cryostat, stained with H&E and observed by light microscopy (E600, Nikon). To identify the expression of cell type-specific markers in Luciferase+ cells, double immunofluorescence was performed. Each
secondary antibody conjugated with FITC (1:500; goat anti-mouse IgG, Jackson Immunoresearch), followed by treatment with specific antibodies reacted to secondary antibody conjugated with Cy3 (1:500; goat anti-rabbit IgG, Jackson Immunoresearch), such as GFAP (1:400, Millipore), Neu-N (1:200, Millipore), microtubule-associated protein 2 (MAP-2, 1:200, Millipore), Tuj-1 (1:200, Millipore). The tissue sections were analyzed with a CLSM. FITC (green) and Cy3 (red) fluorochromes on the immunofluorescence labeled slides were excited by laser beam at 488 nm and 543 nm, respectively. Luciferase labeled with Cy3 (red) or FITC (green) fluorochromes, and cell-type-specific markers, GFAP, Neu-N, MAP-2, and Tuj-1 labeled with Cy3 (red) or FITC (green) fluorochromes were double immunostained in order to demonstrate their co-localization in one cell under CLSM[12]. For prussian blue
staining (Sigma), the fixed brain slices and cells were first stained with the mixture of 10 wt % Prussian blue (potassium ferrocyanide) and 20% HCl (1:1) for 30 minutes successively, and then were counterstained with nuclear fast red.
1.11 RNA isolation and real time RT-PCR
Total RNA was isolated from ischemic hearts with RNA TRIzol (Invitrogen) and performed reverse transcription with the High Capacity cDNA Archive Kit (Applied Biosystems) as well as real-time PCR with SYBR-Green assays (Applied Biosystems) on a GeneAmp 5700 SDS from Applied Biosystems as described previously[13]. Taqman
primer/probe sets for various cytokines and housekeeping genes were designed using PRIMER EXPRESS software (Applied Biosystems). Real Time PCR was run using a total of 5 ng template cDNA for each sample. The fast PCR protocol consisted of an initial denaturing step at 95ºC for 20 s. Next, samples were run at 94ºC (denaturation) for 3 s, 60ºC (annealing) for 30 s for 25 cycles. Gene expression levels of TNF-α, 1β, 6, interferon-γ (INF-γ), IL-10, TGF-β were quantified in the border zone of infarct as described previously[14]. All assays
were performed in duplicate. Relative gene expression was calculated using the Ct method with normalization to GAPDH or 18S.
1.12 Statistical analysis
All measurements in this study were performed in a blinded design. Results were expressed as mean SEM. The behavioral scores were evaluated and adjusted by normal distribution. Differences between groups were evaluated by two-way ANOVA with the Newman-Keuls post hoc test. For the PA imaging experiments, we used a simple linear regression to test photoacoustic (PA) signal produced by GRMNBs, which was observed to be correlated with the concentration of GRMNBs. A P value < 0.05 was considered significant.
2. Characterization of iron oxides, iron oxide/gold seeds, and iron oxide/gold nanorod crystals grown inside mesoporous silica nanobeads and GRMNBs
Figure S1. The scanning electron microscopy analysis, transmission electron microscopy of elemental mapping and energy-dispersive X-ray spectroscopy analysis of a) iron oxides/gold seeds tagged inside mesoporous silica nanobeads and b) iron oxides/gold nanorods tagged inside mesoporous silica nanobeads. c) The low magnification TEM image of GRMNBs. d) TEM image of as-prepared iron oxide nanoparticles e) The N2 adsorption/desorption
isotherms of the nanobeads with Brunauer- Emmett-Teller (BET). The inset showed the Barret-Joiner-Halenda (BJH) analysis of the mesoporous silica nanobeads (NBs) and GRMNBs.
3. In vitro photoacoustic imaging of GNRs and GRMNBs with/without external magnet Pure gold nanorods (GNRs) did not provide sufficient PA imaging contrast enhancement. On the contrary, the GRMNBs without providing external magnet showed better PA signals than the pure gold nanorods. Furthermore, the GRMNBs showed the
significant contrast enhancement for PA signal with the presence of external magnet, and it almost enhanced 7.2 times PA signals compared to pure gold nanorods. The PA contrast could be further increased by an external magnet, demonstrating their ability to perform active magnetic guide.
Figure S2. a) Schematic diagram of the magnetic guided experimental set-up for photoacoustic microscopy. b) PA B-scan images in the phantom at different distance of GRMNBs and GRMNBs with an external magnet. c) Quantification of PA signal intensity for pure GNRs, GRMNBs and GRMNBs with an external magnet at different positions.
4. Saturation magnetization and MR phantom measurement
The magnetic property of iron oxides nanoparticles (Fe3O4 NPs), magnetic silica
nanobeads (MNBs) and magnetic silica nanobeads with pore-filled gold (GRMNBs) was estimated by superconducting quantum interference device (SQUID) at 298K with the magnetic field sweeping from -10000 to +10000 G. The curves of the Fe3O4 NPs, MNBs and
GRMNBs show similar shape with negligible hysteresis (Figure S3a). The presence of mesoporous silica nanobeads and gold nanorods dilutes the concentration of Fe3O4
nanoparticles, resulting in a lower saturation magnetization (Ms) of MNBs and GRMNBs than that of the pure Fe3O4 NPs. Furthermore, the Phantoms of GRMNBs in agar gel are prepared
in the concentration range 0.0 to 0.75 mM and imaged using a 7 Tesla Bruker Biospec 70/30 USR MRI scanner (Bruker, Ettlingen, Germany). T2 map and T1 map of all samples were
acquired to determine relaxation times using a multi-slice multi-echo (MSME). Parameters for MSME (T2/T1 maps) were: TR [repetition time] (ms) = 3000, 2000, 1000, 500 and 300;
TE [echo time] (ms) = 11, 22, 33, 44, 55, 66, and 77. The R1 and R2 were plotted against
MNBs concentration to determine the relaxivities of r1 and r2, respectively, from the slope of the linear fit.
Figure S3. a) Field-dependent magnetization curve of Fe3O4 NPs, MNBs and GRMNBs. The
inset shows that the MNBs and GRMNBs are attracted by an external magnet. b) T1-weighted
and T2-weighted MR images for the aqueous dispersion of GRMNBs at different Fe
concentrations. c) T1 and T2 relaxation rates (1/T1, 1/T2) as a function of iron molar
concentration obtained at 20oC. The r1 and r2 value of the GRMNBs was measured to be
1.205 s-1mM-1Fe and 127.89 s-1mM-1Fe, respectively.
5. Preparation and characterization of UMSCs
The collected human umbilical cord tissues were washed three times with Ca2+ and
Mg2+-free PBS (DPBS, Life Technology). They were mechanically cut by scissors in a
midline direction and the vessels of the umbilical artery, vein and outlining membrane were dissociated from the Wharton’s jelly (WJ). The jelly was then extensively cut into pieces smaller than 0.5 cm3, treated with collagenase type 1 (Sigma, St Louis, USA) and incubated
for 14–18 h at 37 °C in a 95% air/5% CO2 humidified atmosphere. The explants then were
°C in a 95% air/5% CO2 humidified atmosphere. They were left undisturbed for 5–7 days to
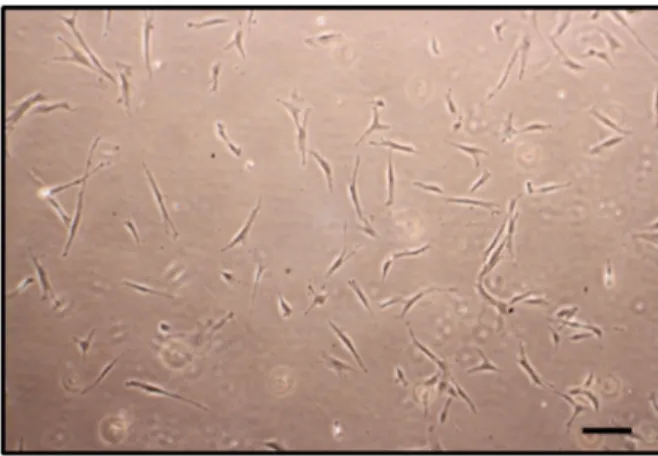
allow for migration of the cells from the explants. The cellular morphology became homogenously spindle shaped in cultures after 4–8 passages as shown in Figure S4, and the specific surface molecules of cells from the WJ were characterized by flow cytometric analysis. The cells were detached with 2 mM EDTA in PBS, washed with PBS containing 2% BSA and 0.1% sodium azide (Sigma, USA) and incubated with the respective antibody conjugated with fluorescein isothiocyanate (FITC) or phycoerythrin (PE) including CD1q, CD3, CD10, CD13, CD14, CD31, CD34, CD45, CD90, CD73, CD56, HLA-ABC, HLA-DR, CD49b, CD49d, CD29, CD44, CD105, CD117 and CD166 (BD, PharMingen). Thereafter, the cells were analyzed using a Becton Dickinson flow cytometer (Becton Dickinson, San Jose, CA).
Figure S4. Representative image of umbilical cord-derived mesenchymal stem cells (UMSCs) with fibroblast-like morphology. Bar = 50 μm.
6. Bromodeoxyuridine (BrdU) proliferation and transwell migration assays
Proliferation of GRMNB-UMSCs or UMSCs with/without the magnetic treatment at the magnet (5 mm in diameter, 0.5 mm in height, 1000G) was tested by measuring BrdU incorporation (10 μM) using a BrdU chemiluminescence immunoassay kits (Roche) and further confirmed by counting Trypan blue cell. After a 4-6 h starvation (incubation in medium lacking supplements), UMSCs were incubated in medium for 2 days and pulse
loaded with 10 μM BrdU for 12 h as previous described[15]. UMSCs were then incubated with
anti-BrdU-peroxidase for 90 min and staining was developed by incubating with substrate solution for 3 min. Plates were read with an Lmax microplate luminometer (Molecular Devices). Results as shown in Figure S5 were analyzed and presented as percent (%) increase over control. Cell migration was assessed as described previously with modifications[16]. In
brief, GRMNB- UMSCs or UMSCs were placed in 100 μL in the upper chamber (transwell: 6.5-mm diameter, 5.0-mm pore size) according to manufacturer’s instructions (Costar, #3421). We used SDF-1α (100 ng/mL, R&D System, positive control) in the lower chambers. The assays were conducted over a 4-h incubation period at 37oC in a 5% CO
2 incubator.
Because almost all cells stay at the lower side of the membrane after migration, quantification can be performed by simply counting these cells. Adhered cells at the lower side of the membranes were counted under the microscopy as previously described.
Figure S5. Results of cell proliferation assay by BrdU incorporation and migration by transwell assay were similar in four different groups (UMSCs = both without magnetic and GRMNBs treatment, M-UMSCs = UMSCs with magnetic and without GRMNBs treatment, GRMNBs- UMSCs = UMSCs without magnetic and with GRMNBs treatment, M-GRMNBs-UMSCs = M-GRMNBs-UMSCs both with magnetic and GRMNBs treatment).
7. Bio-physical characterization on the cell retention, proliferation and differentiation after GRMNB labeling
Figure S6. a) Cellular retention of GRMNBs in stem cells cultured for 6 h, 24 h and 48 h. The cell skeleton was stained with rodamin phalloidin (red), and the cell nucleus with DAPI (blue). b) Quantitative flow cytometric data showed the fluorescence brightness and uniformity levels of GRMNBs uptake by UMSC stem cells for different time periods
.
c) Invitro differentiation of plain UMSCs and UMSCs after GRMNBs labeling, representative
images of adipogenic (oil red O staining), chondrogenic (Alizarin red S staining), vascular tube formation and osteogenic (Alcian blue staining), and d) neural differentiation (MAP-2, O4 and GFAP) from plain UMSCs and GRMNBs-UMSCs. Bar = 50 μm.
8. Cellular attraction by a static magnetic field
For in vitro study, GRMNBs-UMSCs were resuspended in an eppendorf tube. The GRMNBs-UMSC attraction was examined using a magnetic field (8 mm in diameter, 2 mm in height, 2300G) placed on the outer wall of the tube for 2 h as shown in Figure S7. Moreover, we investigated the ability of the magnet to retain the GRMNBs-UMSCs located on-site in the dynamic flow, which mimics the blood circulation. We applied a circular perfusion pump to study if the GRMNBs-UMSCs can be captured at the inner wall of the plastic tube under a magnetic field as they passed through a plastic tube.
Figure S7. a) An eppendorf tube containing resuspended GRMNBs-UMSCs (left panel) was used in the tube attraction assay by a magnet, showing that the GRMNBs-UMSCs were rapidly condensated and attracted toward the magnet (M) outer wall of the tube (middle panel) or settled on the bottom of the tube, 1 cm away from the magnet (right panel), respectively. The cell attraction toward the magnet is also dependent on the magnetic force of the magnet. b) Under a circular perfusion pump, GRMNBs-UMSCs passed through a plastic tube, and were captured to the inner wall of the plastic tube (black arrow) placed beside a magnetic field (8 mm in diameter, 2 mm in height, 2300G).
9. In vivo photoacoustic imaging cortical vasculature in stroke mice
Under isoflurane anesthesia (2–2.5% in a 70% N2O / 30% O2 mixture), the animal were
mounted on a custom-made acrylic stereotaxic head holder to reduce motion artifacts during the experiment, and the skin and muscle were cut away from the skull to expose the bregma landmark. Next, a right-lateral cranial window of approximately 2 (anterior -posterior) × 2 (medial -lateral) mm was made for PA imaging. After the mouse received the induction of focal cerebral ischemia, a PA B-scan was performed to acquire images of the cortical vasculature at 0, 6 and 12 h post-stroke with Luc-GRMNBs-UMSCs injection. To enhance the PA contrast in the cerebral ischemic regions, magnetic guide was performed as compared with those only Luc-GRMNBs-UMSCs injection only.
The 50-MHz dark field confocal photoacoustic microscope (PAM) system was used to image cortical vasculature in this study. An optical parametric oscillator (Surlite OPO Plus, Continuum, USA) pumped by a frequency-tripled Nd:YAG Q-switched laser (Surlite II-10, Continuum, USA) was employed to provide ~10-ns pulse width pumped an optical parametric oscillator to illuminate the tumor site at 808 nm wavelength and 10 mJ/cm2 fluence. Laser
energy was delivered by a 1-mm multimode fiber. The fiber tip was coaxially aligned with a convex lens, an axicon and a plexiglass mirror with the ultrasonic transducer on an optical bench to form a dark field illumination confocal with the focal point of the ultrasonic transducer. The transducer was immersed in an acrylic water tank during the imaging process with a hole at the bottom sealed with a 15 μm thick polyethylene film. The mouse head was coated with a thin layer of ultrasonic gel and attached to the thin film to ensure a good coupling of transcranial PA waves to the tank. The PA signals received by the ultrasonic transducer were pre-amplified by a low-noise amplifier (AU-3A-0110, Miteq, USA), cascaded to an ultrasonic receiver (5073 PR, Olympus, USA), and then digitized and sampled by a computer-based 14 bit analog to digital (A/D) card (CompuScope 14200, GaGe, USA) at a 200 MHz sampling rate for data storage. Fluctuations of the laser energy were monitored by
a photodiode (DET36A/M, Thorlabs, USA). The recorded photodiode signals were applied to compensate for PA signal variations caused by laser-energy instability before any further signal processing.
10. In vivo MRI tracking of magnetically labeled stem cell
MRI was performed on mice under anesthesia in 7-Tesla Bruker Biospec 70/30 USR MRI scanner (Bruker, Ettlingen, Germany). During scanning, mice were gently warmed on a thermostatically controlled heating pad. Rapid Acquisition with Relaxation Enhancement (RARE) spin echo sequence was used for fast T2-weighted imaging (TE 50ms, TR 3000 ms,
RARE Factor 8) with a 256 × 256 in-plane matrix and a 2.56 cm field of view. For each mouse, we acquired 22 coronal and axial images with 0.7 mm thick slices, which captured sequentially for each animal at 3, 7, and 14 days after cerebral ischemia.
11. Prussian stained brain slide and progressive reduction in infarct volume
Figure S8. a) Representative image of Prussian stained brain slide showing the original stroke area (black dotted line). b) Significant progressive reduction in the infarct size from day 3 to day 14 with the gM-Luc-GRMNBs-UMSCs compared to control.
12. Bioluminescent imaging (BLI)
Mice were imaged with the IVIS Imaging System 200 Series (Caliper) to record bioluminescent signal emitted from
the engrafted UMSCs one day before and 14
days after stem cells transplantation.
Mice were anesthetized with isoflurane and received intra-peritoneal injection of D-luciferin (Caliper) at a dose of 270 mg/g body weight.
Imaging acquisition was performed at 15 min after intraperitoneal injection of luciferin. For BLI analysis, regions of interest encompassing the intracranial area of signal were defined using Living Image 3.0 software (Xenogen Corp.), and the total photon flux was recorded. To facilitate comparison of cellular engrafted rates, each mouse’s luminescence scores were normalized against its own luminescence reading at Day14, thereby allowing each mouse to serve as its own control.
13. Neurological behavioral assessment
Behavioral assessments were performed 5 days before cerebral ischemia, and 1, 7, 14 and 28 days after cell transplantation. The tests measured locomotor activity. Baseline-test scores were recorded to normalize post-stroke result. Locomotor activity was measured for about 2 h using VersaMax Animal Activity Monitoring System (Accuscan Instruments, Inc., Columbus, OH)[17], which contains 16 horizontal and 8 vertical infrared sensors. Vertical
sensors were situated 10 cm above the chamber floor and motor activity was quantified by the number times a beam broken by the rat’s movement in the chamber. Three vertical-movement parameters were measured: (i) vertical activity (ii) vertical time (iii) number of vertical movements by the manufacturer’s instruction.
14. Infarct volume measurement
To analysis the infarcted brain, a series of 20 μm thick coronal sections with a 200 μm interval were cut by a cryostat. Tissue sections were stained with 1% cresyl violet (or H&E staining) (Sigma) for 30 min at the room temperature. To measure the infarct area in the right cortex, we subtracted the noninfarcted area in the right cortex from the total cortical area of the left hemisphere. The area of infarct was drawn manually from slice to slice, and the volume was then calculated by internal volume analysis software (NIH Image J)[18].
15. Comparison of the iron accumulation with Prussian blue staining
Figure S9. Significantly increased the staining intensity by Prussian blue at the stroke site in the gM-Luc-GRMNBs-UMSCs compared to other three groups.
16. Measurement of reactive cerebral blood flow (rCBF)
Experimental mice were positioned in a stereotaxic frame and baseline local cortical blood flow (bCBF) was measured continuously with a laser doppler flowmeter (LDF monitor, Moore Instrument England) in an anesthetized state (chloral hydrate) as previously described[19]. The reactive cerebral blood flow (rCBF) was examined after intraperitoneal
injection of 50 mg/kg acetazolamide (Diamox, Lederle, USA) and defined as percentage change of rCBF.