Yu-Yi Lin1, Chih-Hsin Muo2,3, Fung-Chang Sung2,3, Shih-Ni Chang2,3, Chia-Hung Kao1,4, and
Shung-Shung Sun1,5
1
Department of Nuclear Medicine and PET Center, China Medical University Hospital, Taichung,
Taiwan; 2College of Public Health, China Medical University, Taichung, Taiwan; 3Management Office
for Health Data, China Medical University Hospital, Taichung, Taiwan; 4School of Medicine, China
Medical University, Taichung, Taiwan; 5Department of Biomedical Imaging and Radiological Science,
China Medical University, Taichung, Taiwan
First authors: Yu-Yi Lin and Chia-Hung Kao contributed equally to this work.
Yu-Yi Lin, MD, MPH, is a resident at Department of Nuclear Medicine and PET Center, China
Medical University Hospital, No. 2, Yuh-Der Rd, Taichung 404, Taiwan; Tel: +886 4 22052121; Fax:
+886 4 22336174; E-mail address: d15451@mail.cmuh.org.tw
Chia-Hung Kao, MD, is Chief of Department of Nuclear Medicine and PET Center, China Medical
University Hospital, No. 2, Yuh-Der Rd, Taichung 404, Taiwan; Tel: +886 4 22052121; Fax: +886 4
22336174; E-mail address: d10040@mail.cmuh.org.tw
Corresponding author: Shung-Shung Sun, MD, Department of Nuclear Medicine and PET Center,
China Medical University Hospital, No. 2, Yuh-Der Rd, Taichung 404, Taiwan; Tel: +886 4 22052121;
Fax: +886 4 22336174; E-mail address: rancholosamigos@yahoo.com.tw
Financial disclosures: This study was supported partly by the Department of Health, Executive Yuan,
Taiwan, Republic of China (grant number NSC 95-2625-Z-039-002, NSC 96-2625-Z-039-003, NSC
97-2625-M-039-003), China Medical University Hospital (grant number 1MS1), Taiwan Department
of Health, Clinical Trial and Research Center of Excellence (grant number DOH99-TD-B-111-004),
and China Medical University Hospital study projects (DMR-95-076 and DMR-95-077).
Short running foot line: PET Utilization in Taiwan
ABSTRACT
The National Health Insurance program in Taiwan began covering positron-emission tomography (PET)
for selected oncologic indications after imposing global budgets. Delay in acquisition of high-tech
equipment, scarcity of high-tech resources and long waiting periods for such services had been reported
in a similar universal health care system in Canada. The objective of this study was to assess initial
trends of PET utilization in patients with cancer after expansion of coverage under Taiwan’s universal
health insurance program.
Methods: Using data from the National Health Research Institutes, PET utilization trends were
compared at the regional level. The relationships between PET utilization and selected patient and
provider characteristics were analyzed using multivariate logistic regression.
2007. In the northern region, the rise in PET utilization was characterized by an increase of 57% in
2006, and a decrease of 7% in 2007, whereas in the central region, there was a decrease of 2% in 2006,
and an increase of 62% in 2007. Cancer type, patient age, status of multiple cancers, hospital
accreditation level and geographical location were independent factors associated with the likelihood of
undergoing PET examination.
Conclusions: PET utilization increased substantially after expansion of insurance coverage in Taiwan.
However, PET examinations still accounted for only a small fraction of noninvasive diagnostic imaging
studies performed. Although regional levels of PET utilization were commensurate with oncologic
burden, there were significant regional variations in the pattern of utilization.
Keywords: Positron-Emission Tomography, Health Care Rationing, Health Insurance, Single-Payer
System, Taiwan
INTRODUCTION
18F-Fluoro-2-deoxy-D-glucose (FDG) positron emission tomography (PET) is an advanced medical
imaging technology that is increasingly being used in the management of patients with cancer (1). It
has major impact on the diagnosis and staging, treatment monitoring, restaging and detection of
residual or recurrence of certain types of cancer. The rationale underlying the use of FDG-PET in
oncology is based on the observation that FDG uptake is substantially higher in most types of cancer
Health insurance coverage makes advanced medical technology more accessible to patients who are
likely to benefit from these services. Starting in 1998, after review of the evidence of benefit, the
Centers for Medicare and Medicaid Service (CMS) began to cover FDG-PET for the evaluation of
patients with solitary pulmonary nodules and initial staging of patients with non-small cell lung cancers.
This was the first of several steps taken by the CMS toward expansion of FDG-PET reimbursement. In
January 2005, CMS established a new approach for expanded coverage of selected evolving technology,
such as FDG-PET, as part of a coverage policy called coverage with evidence development (4).
In addition to expanding health insurance coverage, advances in medical technology have been
implicated as one of the factors leading to escalating health care expenditure (5,6). Two years after
imposing global budgets to control cost, the National Health Insurance (NHI) program in Taiwan began
covering FDG-PET for selected oncologic indications in mid 2004. Delay in the acquisition of
high-tech equipment, scarcity of high-tech resources and long waiting periods for such services had
been reported in a similar universal health care system in Canada (7). Little has been published in the
literature regarding PET utilization under Taiwan’s universal health care system.
In our current study, we analyzed the initial trends of FDG-PET utilization in the management of
We used datasets based on the entire population in Taiwan to analyze potential variations in the
pattern of utilization of this advanced medical technology in response to expansion of coverage. This
empirical assessment of potential variations in resource utilization may provide useful information for
future research aimed at improving the quality of care for patients with cancer.
MATERIALS AND METHODS
Data source
We used de-identified claims-related datasets produced for investigational purposes by the National
Health Research Institutes (NHRI) from data submitted to the Bureau of National Health Insurance
(BNHI). BNHI administers the mandatory universal health insurance program with over 97% coverage
of the population in Taiwan. To select patients who underwent PET scanning, we used a file containing
a cohort of one million persons randomly selected from the entire insured population of approximately
23 million in 2005. A de-identified version of the registry of patients with catastrophic illness was used
to select those with malignancy. For insurance purposes, all types of cancer are classified as
catastrophic illnesses. Provider information was obtained from the registry of contracted medical
facilities.
Study subjects
We focused on the common cancers that accounted for the vast majority of PET utilization in Taiwan,
esophageal cancer or lymphoma, who received care at a provider of PET imaging services in the study
time frame from 2004 to 2007. Diagnostic codes in the International Classification of Disease, Ninth
Revision, Clinical Modification (ICD-9-CM) were used to identify the status of malignancy, type of
cancer, as well as other clinical conditions. The specific codes used for malignancy were: ICD-9-CM
140-149, 160, 161 and 190 for head and neck cancers; ICD-9-CM 174 and 175 for breast cancer;
ICD-9-CM 162 for lung cancer; ICD-9-CM 153 and 154 for colorectal cancer; ICD-9-CM 150 for
esophageal cancer; ICD-9-CM 200-202 for lymphoma; ICD-9-CM 140-195 and 200-208 for all
primary malignancies; ICD-9-CM 196-199 for metastasis. Co-morbidities were identified using the
following codes: ICD-9-CM 250 and A-code A181 for diabetes mellitus; ICD-9-CM 401-405 and
A-codes A260-269 for hypertension with or without complications. A-codes were used, in conjunction
with the ICD-9-CM codes, to identify chronic co-morbidities, because these conditions were coded in
the past with A-codes before the adoption of ICD-9-CM.
Statistical analysis
Descriptive statistics regarding cancer type, hospital accreditation level and organizational type, were
presented by geographical location. We compared the utilization of PET with that of other noninvasive
diagnostic imaging, such as MRI, CT and ultrasound imaging, in the select patient population. We also
compared various patient and provider characteristics between patients who underwent PET scanning
including stage or extent of cancer, and status of multiple cancers and co-morbidities. The Chi-square
test or Fisher test was used, as appropriate, to test for statistical significance. A multivariate logistic
regression model was used to evaluate the relationship between the likelihood of undergoing PET
scanning and selected patient and provider characteristics. The statistical tool used was SAS software
version 9.1 (SAS Institute Inc., Carey, NC). Statistical significance was defined at the conventional
level of 0.05 in a two-tailed test.
RESULTS
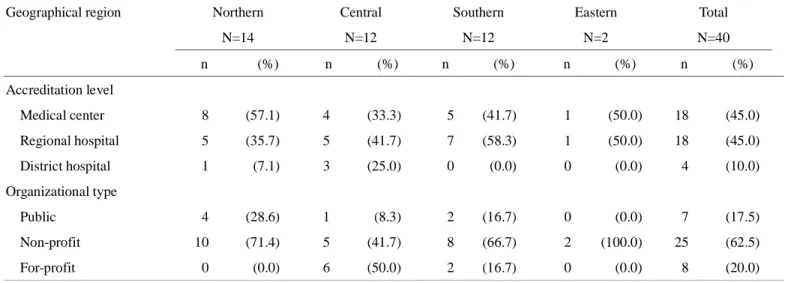
In the period from 2004 to 2007, 40 facilities provided PET imaging services to the select oncologic
population (Table 1). Fourteen of these were located in the northern region, 12 each in both the central
and southern regions, and 2 in the eastern region. The majority of the northern facilities (8/14) were
medical centers, while most of the facilities in the central and southern regions were not. Most of the
facilities operated as non-profit organizations, except for those in the central region, where half (6/12)
were for-profit organizations.
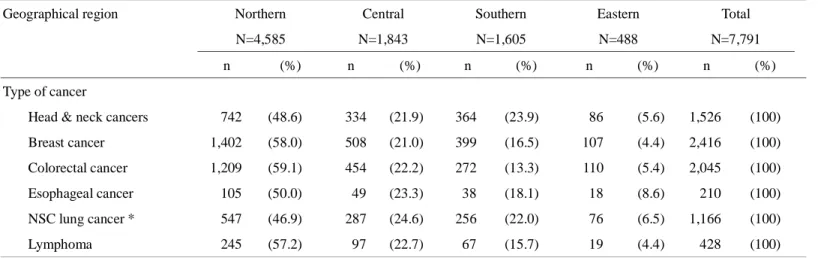
The common cancers in the select patient population were, in descending order of frequency, breast
cancer, colorectal cancer, head and neck cancers, non-small cell lung cancer, lymphoma and esophageal
cancer, accounting for 31%, 26%, 20%, 15%, 5% and 3% of the select oncologic population,
followed by the central (22%), southern (18%) and eastern (5%) regions. The northern region had
disproportionately more patients with breast and colorectal cancers, whereas the southern region had
disproportionately more patients with head and neck cancers and non-small cell lung cancer.
Four types of cancer accounted for the vast majority (84%) of oncologic FDG-PET scans, with head
and neck cancers, colorectal cancer, non-small cell lung cancer and breast cancer accounting for 25%,
21%, 20% and 18% of total scan volume, respectively. More than one third (36%) of the scans
performed in the southern region were for head and neck cancers.
Eleven percent of the select oncologic population who received care at a provider of PET imaging
services underwent FDG-PET examination. Esophageal cancer and lymphoma had high scan rates of
22% and 20%, respectively, whereas breast cancer had a low scan rate of 7%. The northern region had
the lowest scan rate for breast cancer (5%). Approximately one fifth (21%) of all oncologic FDG-PET
scans were repeat scans. The most common cancer to undergo repeat FDG-PET examination was
lymphoma. Thirty percent of patients with lymphoma who had one FDG-PET scan underwent repeat
scans.
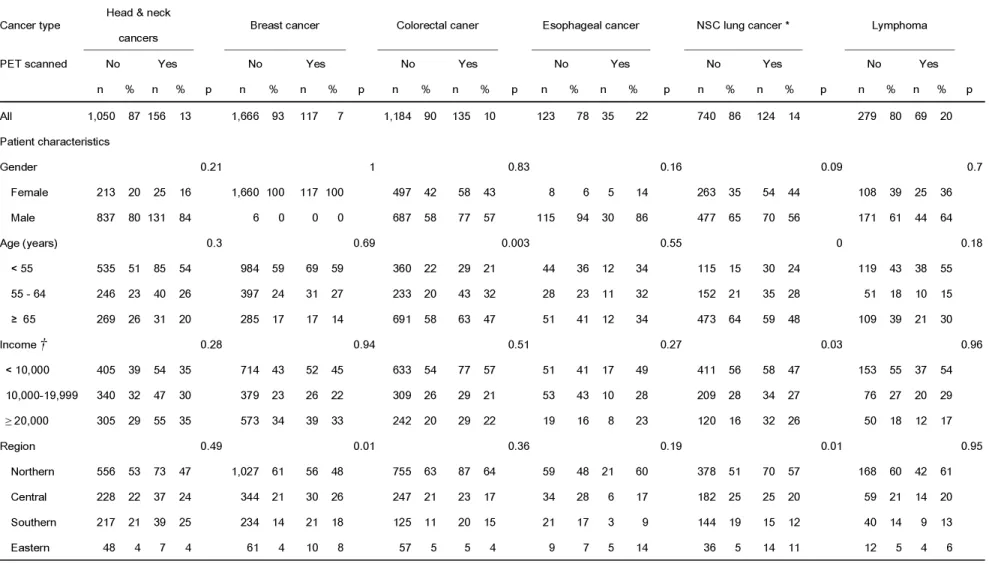
On univariate analysis, certain patient and provider characteristics were associated with higher
age, those with higher income or multiple cancers, and those who received care at an eastern facility,
or at a regional or district hospital. Younger patients with colorectal cancer were also more likely to
undergo PET scanning. Regardless of cancer type, patients who received care at regional or district
hospitals were more likely to undergo PET examination, compared with those who received care at or
were referred to medical centers.
On multivariate logistic regression, some of these relationships remained statistically significant (Table
4). Cancer type strongly influenced the likelihood of undergoing PET examination--patients with
esophageal cancer were more likely to be scanned, compared with those with breast cancer. Patient age,
status of multiple cancers and hospital accreditation level were independent factors associated with the
likelihood of undergoing PET scan. The same was true for geographical location--patients who
received care at eastern facilities were more likely to be scanned, compared with those in the northern
region.
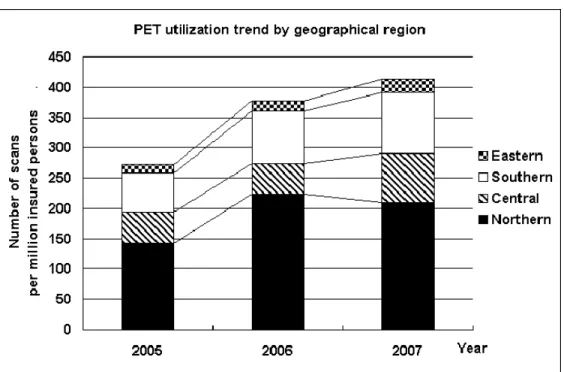
Overall, the number of PET scans per million insured persons increased from 273 in 2005 to 378 in
2006 and to 413 in 2007—a 51% increase over two years (Figure 1). Even with this increase, PET
utilization represented only 4% of the number of noninvasive imaging studies performed, including
MRI, CT and ultrasound imaging. In the northern region, the rise in PET utilization was characterized
central region with a 2% decrease in 2006, and a 62% increase in 2007. The pace of rising utilization
in the southern region fell in between those of the northern and central regions, with consecutive yearly
TABLE 1. Count of providers by accreditation level, organizational type and geographical region Geographical region Northern
N=14 Central N=12 Southern N=12 Eastern N=2 Total N=40 n (%) n (%) n (%) n (%) n (%) Accreditation level Medical center 8 (57.1) 4 (33.3) 5 (41.7) 1 (50.0) 18 (45.0) Regional hospital 5 (35.7) 5 (41.7) 7 (58.3) 1 (50.0) 18 (45.0) District hospital 1 (7.1) 3 (25.0) 0 (0.0) 0 (0.0) 4 (10.0) Organizational type Public 4 (28.6) 1 (8.3) 2 (16.7) 0 (0.0) 7 (17.5) Non-profit 10 (71.4) 5 (41.7) 8 (66.7) 2 (100.0) 25 (62.5) For-profit 0 (0.0) 6 (50.0) 2 (16.7) 0 (0.0) 8 (20.0)
TABLE 2. Frequency of selected cancers by geographical region
Geographical region Northern
N=4,585 Central N=1,843 Southern N=1,605 Eastern N=488 Total N=7,791 n (%) n (%) n (%) n (%) n (%) Type of cancer
Head & neck cancers 742 (48.6) 334 (21.9) 364 (23.9) 86 (5.6) 1,526 (100)
Breast cancer 1,402 (58.0) 508 (21.0) 399 (16.5) 107 (4.4) 2,416 (100)
Colorectal cancer 1,209 (59.1) 454 (22.2) 272 (13.3) 110 (5.4) 2,045 (100)
Esophageal cancer 105 (50.0) 49 (23.3) 38 (18.1) 18 (8.6) 210 (100)
NSC lung cancer * 547 (46.9) 287 (24.6) 256 (22.0) 76 (6.5) 1,166 (100)
Lymphoma 245 (57.2) 97 (22.7) 67 (15.7) 19 (4.4) 428 (100)
TABLE 3. Univariate analysis of patient and provider characteristics by cancer type between patients with and without PET examination
Cancer type Head & neck
cancers Breast cancer Colorectal caner Esophageal cancer NSC lung cancer * Lymphoma
PET scanned No Yes No Yes No Yes No Yes No Yes No Yes
n % n % p n % n % p n % n % p n % n % p n % n % p n % n % p All 1,050 87 156 13 1,666 93 117 7 1,184 90 135 10 123 78 35 22 740 86 124 14 279 80 69 20 Patient characteristics Gender 0.21 1 0.83 0.16 0.09 0.7 Female 213 20 25 16 1,660 100 117 100 497 42 58 43 8 6 5 14 263 35 54 44 108 39 25 36 Male 837 80 131 84 6 0 0 0 687 58 77 57 115 94 30 86 477 65 70 56 171 61 44 64 Age (years) 0.3 0.69 0.003 0.55 0 0.18 < 55 535 51 85 54 984 59 69 59 360 22 29 21 44 36 12 34 115 15 30 24 119 43 38 55 55 - 64 246 23 40 26 397 24 31 27 233 20 43 32 28 23 11 32 152 21 35 28 51 18 10 15 ≥ 65 269 26 31 20 285 17 17 14 691 58 63 47 51 41 12 34 473 64 59 48 109 39 21 30 Income † 0.28 0.94 0.51 0.27 0.03 0.96 < 10,000 405 39 54 35 714 43 52 45 633 54 77 57 51 41 17 49 411 56 58 47 153 55 37 54 10,000-19,999 340 32 47 30 379 23 26 22 309 26 29 21 53 43 10 28 209 28 34 27 76 27 20 29 ≥ 20,000 305 29 55 35 573 34 39 33 242 20 29 22 19 16 8 23 120 16 32 26 50 18 12 17 Region 0.49 0.01 0.36 0.19 0.01 0.95 Northern 556 53 73 47 1,027 61 56 48 755 63 87 64 59 48 21 60 378 51 70 57 168 60 42 61 Central 228 22 37 24 344 21 30 26 247 21 23 17 34 28 6 17 182 25 25 20 59 21 14 20 Southern 217 21 39 25 234 14 21 18 125 11 20 15 21 17 3 9 144 19 15 12 40 14 9 13 Eastern 48 4 7 4 61 4 10 8 57 5 5 4 9 7 5 14 36 5 14 11 12 5 4 6
* NSC lung cancer indicates non-small cell lung cancer.
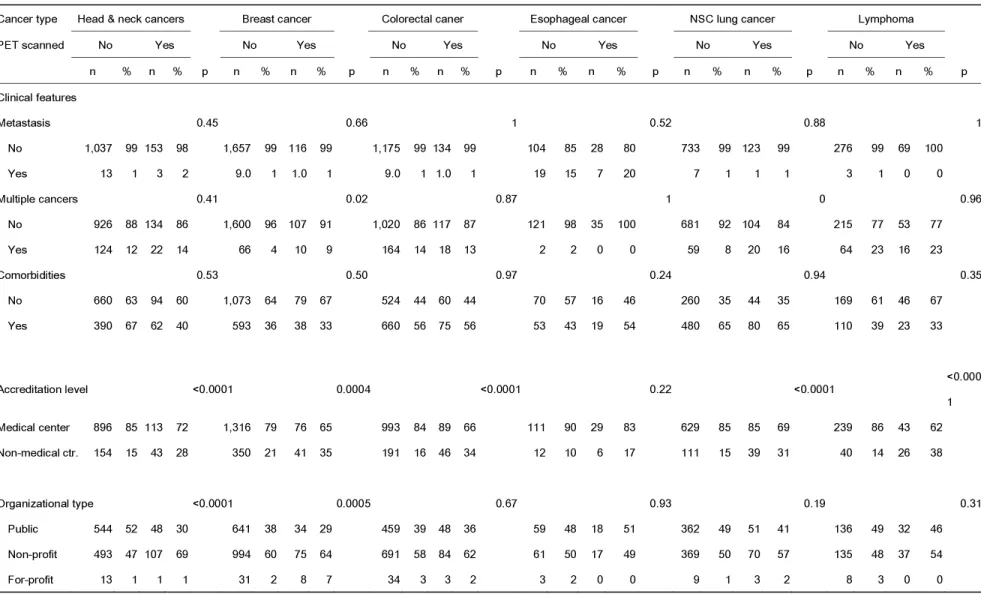
TABLE 3 (continued). Univariate analysis of patient and provider characteristics by cancer type between patients with and without PET examination
Cancer type Head & neck cancers Breast cancer Colorectal caner Esophageal cancer NSC lung cancer Lymphoma
PET scanned No Yes No Yes No Yes No Yes No Yes No Yes
n % n % p n % n % p n % n % p n % n % p n % n % p n % n % p Clinical features Metastasis 0.45 0.66 1 0.52 0.88 1 No 1,037 99 153 98 1,657 99 116 99 1,175 99 134 99 104 85 28 80 733 99 123 99 276 99 69 100 Yes 13 1 3 2 9.0 1 1.0 1 9.0 1 1.0 1 19 15 7 20 7 1 1 1 3 1 0 0 Multiple cancers 0.41 0.02 0.87 1 0 0.96 No 926 88 134 86 1,600 96 107 91 1,020 86 117 87 121 98 35 100 681 92 104 84 215 77 53 77 Yes 124 12 22 14 66 4 10 9 164 14 18 13 2 2 0 0 59 8 20 16 64 23 16 23 Comorbidities 0.53 0.50 0.97 0.24 0.94 0.35 No 660 63 94 60 1,073 64 79 67 524 44 60 44 70 57 16 46 260 35 44 35 169 61 46 67 Yes 390 67 62 40 593 36 38 33 660 56 75 56 53 43 19 54 480 65 80 65 110 39 23 33 A ccreditation level <0.0001 0.0004 <0.0001 0.22 <0.0001 <0.000 1 Medical center 896 85 113 72 1,316 79 76 65 993 84 89 66 111 90 29 83 629 85 85 69 239 86 43 62 Non-medical ctr. 154 15 43 28 350 21 41 35 191 16 46 34 12 10 6 17 111 15 39 31 40 14 26 38 Organizational type <0.0001 0.0005 0.67 0.93 0.19 0.31 Public 544 52 48 30 641 38 34 29 459 39 48 36 59 48 18 51 362 49 51 41 136 49 32 46 Non-profit 493 47 107 69 994 60 75 64 691 58 84 62 61 50 17 49 369 50 70 57 135 48 37 54 For-profit 13 1 1 1 31 2 8 7 34 3 3 2 3 2 0 0 9 1 3 2 8 3 0 0
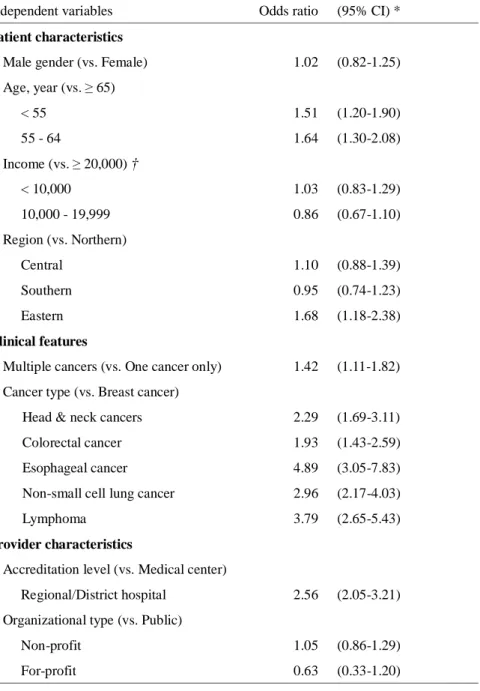
TABLE 4. Multivariate logistic regression of the likelihood of undergoing PET scan
Independent variables Odds ratio (95% CI)*
Patient characteristics
Male gender (vs. Female) 1.02 (0.82-1.25) Age, year (vs. ≥ 65) < 55 1.51 (1.20-1.90) 55 - 64 1.64 (1.30-2.08) Income (vs. ≥ 20,000) † < 10,000 1.03 (0.83-1.29) 10,000 - 19,999 0.86 (0.67-1.10) Region (vs. Northern) Central 1.10 (0.88-1.39) Southern 0.95 (0.74-1.23) Eastern 1.68 (1.18-2.38) Clinical features
Multiple cancers (vs. One cancer only) 1.42 (1.11-1.82) Cancer type (vs. Breast cancer)
Head & neck cancers 2.29 (1.69-3.11)
Colorectal cancer 1.93 (1.43-2.59)
Esophageal cancer 4.89 (3.05-7.83)
Non-small cell lung cancer 2.96 (2.17-4.03)
Lymphoma 3.79 (2.65-5.43)
Provider characteristics
Accreditation level (vs. Medical center)
Regional/District hospital 2.56 (2.05-3.21)
Organizational type (vs. Public)
Non-profit 1.05 (0.86-1.29)
For-profit 0.63 (0.33-1.20)
* 95% CI indicates 95% confidence interval.
† Income indicates monthly income in Taiwan New Dollars (TWD). One US Dollar is currently worth approximately 32 TWD.
FIGURE 1. PET utilization trend by geographical region in Taiwan
DISCUSSION
In our current study, we analyzed the initial trends of FDG-PET utilization in the management of
patients with cancer after expansion of coverage under Taiwan’s universal health insurance program.
The National Health Insurance (NHI) program is a government-run, single-payer entity administered
by the Bureau of National Health Insurance (BNHI), and compensates a mixed public and private
delivery system predominantly on a fee-for-service basis (8).The program provides coverage for a
wide range of services, including primary care services, ambulatory and inpatient care, prescription and
certain over-the-counter drugs, as well as protection from catastrophic medical costs. NHI classifies all
types of cancer as catastrophic illnesses, and reimburses all medical services related to cancer care,
to compulsory enrollment, NHI has maintained an overall coverage of over 97% of the population in
Taiwan since its inception in 1995 (9).
More than 90% of Taiwan’s healthcare providers contract with the BNHI to offer services covered by
NHI, which allows the insured complete freedom of choice among providers. In 2004, the Taiwan Joint
Commission on Hospital Accreditation certified 17 of Taiwan’s top medical institutions as medical
centers,and among a total of 516 hospitals that passed accreditation, 67 were certified as regional
teaching hospitals (10). The claims records show that all medical centers and a minority of the regional
teaching hospitals (18/67) provided PET imaging services to patients with cancer.
NHI began covering FDG-PET examinations for selected oncologic indications in mid 2004. These
indications include staging and therapeutic response monitoring of breast cancer; diagnosis and staging
of colorectal cancer, head and neck cancers (excluding brain tumor and primary thyroid cancer),
non-small cell lung cancer, lymphoma, esophageal cancer and melanoma; differential diagnosis of
single pulmonary nodules (suspected lung cancer); and restaging of recurrent thyroid cancer. Compared
with Western countries, Taiwan is notable for its relatively high prevalence of head and neck cancers,
especially in southern Taiwan. In the current study, the data show that head and neck cancers accounted
for one quarter of the oncologic PET examinations covered by NHI overall, and more than one third
Prior research found strong empirical evidence of an association between third-party payment program
and increased likelihood of adoption and use of advanced medical technology (11). The current study
provides empirical evidence of the association between NHI coverage and increased PET utilization in
patients with cancer. The data indicate that the oncologic PET utilization rate per million insured
increased from 273 in 2005 to 378 in 2006 and to 413 in 2007—a 51% increase over the two-year
period. This level of increase cannot be fully explained by changes in the incidence rates of the selected
cancers over the same time frame. Even with this increase, PET utilization represented only 4% of the
number of noninvasive imaging studies performed, including MRI, CT and ultrasound imaging.
Although the total increase in utilization from 2005 to 2007 was comparable among the various regions
in Taiwan, there were significant regional differences in the rapidity of response to expanded insurance
coverage. The surge in oncologic PET utilization occurred most rapidly in the northern region, with a
rise of 57% in 2006, followed by a slight decrease of 7% in 2007. In contrast, the pace of increase in
the southern region was more moderate, with consecutive yearly increases of 36% and 17% in 2006
and 2007, respectively, whereas the central region had a slight decrease of 2% in 2006, followed by a
delayed surge of 62% in 2007. The data suggest that the northern region had the essential elements
enabling it to respond promptly and vigorously to the expanded coverage. It had not only the major
providers, most of which were accredited as medical centers.
In the central region, there was a substantial increase in the number of PET imaging system
installations in 2007, as four separate regional hospitals, previously without this technology, jumped on
the bandwagon to join the medical centers in providing this service. A new installation was also added
at one of the four medical centers in the region, all of which were already equipped with PET imaging
technology. These new installations conspicuously coincided with the regional surge of PET utilization
in the same year.
In our current study, various patient and provider characteristics are associated with the likelihood of
undergoing PET examination. The strong influence of cancer type on the likelihood of undergoing the
scan is to be expected, since the examination may serve different roles in different cancers. Patient age
and status of multiple cancers are also independent factors associated with the likelihood of undergoing
the scan. These associations are reasonable since younger patients and those with multiple cancers may
more likely benefit from this examination. Alternatively, the association between the likelihood of
undergoing the scan and status of multiple cancers may be due to the potential of the scan to uncover
synchronous malignancies. Although FDG-PET is known for its superiority in detecting distant
metastases (12), we were unable to show a statistically significant relationship between stage of cancer
inadequacies in the source data, in terms of coding for the extent of the disease.
While associations between patient or clinical characteristics and the likelihood of undergoing PET
scan may have plausible explanations, apparent relationships between provider characteristics and the
likelihood of undergoing the scan may not have easily recognizable explanations from a clinical
perspective. The data indicate that patients who received care at regional or district hospitals are more
likely to undergo PET examination, compared with those who received care at or were referred to
medical centers. The same is true for patients who received care at eastern facilities, compared to those
who received care at northern facilities. While these relationships may not have simple explanations, it
is worth noting that regional and district hospitals, as well as eastern facilities, serve only a small
minority of the select patient population.
A report estimated the number of dedicated PET scanners required to support the demand for PET
studies to be 0.82 per million population (2,026 scans per million population per year) for all oncologic
indications in the United Kingdom (13). The estimates were based on a model calculating the number
of dedicated PET scanners required to support the demand for PET studies in lung cancer. This was
then extended to all oncologic indications for PET. The number of PET scans required for lung cancer
was calculated using lung cancer incidence rates and a decision tree (clinical algorithm), and was
be non-small cell lung cancer.
In our analysis, the data indicate that the number of PET scans reimbursed by NHI for lung cancer in
Taiwan in 2007 was approximately one fifth of the estimated level required, using the UK algorithm
adjusted for Taiwan’s lung cancer incidence rates. Although our study does not account for PET scans
not reimbursed by NHI, the records in the claims database likely reflect the vast majority of all PET
examinations performed for the selected oncologic indications. The seemingly low level of utilization
for lung cancer may reflect differences in determinations of cost-effectiveness between disparate health
systems. Other important factors influencing the level of utilization may include cost control measures,
such as the imposition of global budgets before insurance coverage expansion. Although global budgets
do not necessarily control the quantity of service provided, these constraints may limit the number of
PET scans performed due to significant incremental cost of performing this examination. More direct
means of utilization control take the form of quotas, in terms of the number of examinations allowed in
a certain time frame. Preferences of patients and referring physicians may also affect utilization level.
The results of our study depend on the quality of the claims datasets managed by NHRI, and are limited
by the accuracy and completeness of the data submitted to BNHI. Our current study does not account
for the stage of cancer, due to evidence of inadequate coding of the extent of cancer in the datasets used.
study is based on a sample of the full claims database, there is a small chance that a repeat analysis
of the claims data, using a different sample dataset or the full database, will produce different results.
Our study does not provide evidence regarding the cost-effectiveness or potential benefits, in terms of
improved clinical outcomes, that may be attributable to the adoption of this advanced medical imaging
technology.
CONCLUSION
PET utilization increased substantially after expansion of insurance coverage in Taiwan. However, PET
examinations still accounted for only a small fraction of noninvasive diagnostic imaging studies
performed. Although regional levels of PET utilization were commensurate with oncologic burden,
there were significant regional variations in the pattern of utilization.
ACKNOWLEDGEMENTS
This study was supported partly by the Department of Health, Executive Yuan, Taiwan, Republic of
China (grant number NSC 95-2625-Z-039-002, NSC 96-2625-Z-039-003, NSC 97-2625-M-039-003),
China Medical University Hospital (grant number 1MS1), Taiwan Department of Health, Clinical Trial
and Research Center of Excellence (grant number DOH99-TD-B-111-004), and China Medical
University Hospital study projects (DMR-95-076 and DMR-95-077).
We wish to thank Mr. Te-Zen Fong of GE Healthcare for providing information on PET scanner
covered by Taiwan’s National Health Insurance program.
REFERENCES
1. Rigo P, Paulus P, Kaschten BJ, et al. Oncological applications of positron emission tomography with
fluorine-18 fluorodeoxyglucose. Eur J Nucl Med. 1996;23:1641-1674.
2. Conti PS, Lilien DL, Hawley K, Keppler J, Grafton ST, Bading JR. PET and [18F]-FDG in oncology:
a clinical update. Nucl Med Biol. 1996;23:717-735.
3. Kelloff GJ, Hoffman JM, Johnson B, et al. Progress and promise of FDG-PET imaging for cancer
patient management and oncologic drug development. Clin Cancer Res. 2005;11:2785-2808.
4. National Oncologic PET Registry (NOPR) Web site for up to date information on CMS covered
indications for FDG-PET in oncology. Available from URL:
http://www.cancerpetregistry.org/indications.htm. Created October 7, 2006. Accessed January 27,
2010.
5. Bodenheimer T. High and rising health care costs. Part 1: seeking an explanation. Ann Intern Med.
2005;142:847-854.
6. Bodenheimer T. High and rising health care costs. Part 2: technologic innovation. Ann Intern Med.
2005;142:932-937.
7. Chiu RC. Universal health care and high-tech medicine. J Formos Med Assoc. 1995;94:293-297.
9. Chen L, Yip W, Chang MC, et al. The effects of Taiwan's National Health Insurance on access
and health status of the elderly. Health Econ. 2007;16:223-242.
10. Taiwan Joint Commission on Hospital Accreditation web site for up to date information on results
of hospital accreditation. Available from URL: http://www.tjcha.org.tw/S_english.asp?catid=3.
Accessed January 27, 2010.
11. Chou SY, Liu JT, Hammitt JK. National Health Insurance and technology adoption: evidence from
Taiwan. Contemporary Economic Policy. 2004;22:26-38.
12. Fleming AJ Jr, Smith SP Jr, Paul CM, et al. Impact of [18F]-2-fluorodeoxyglucose-positron
emission tomography/computed tomography on previously untreated head and neck cancer patients.
Laryngoscope. 2007;117:1173-1179.
13. Bedford M, Maisey MN. Requirements for clinical PET: comparisons within Europe. Eur J Nucl