Mining Conserved Local Structure from Functional Hierarchical Classification via Local Structure Comparison
7
0
0
全文
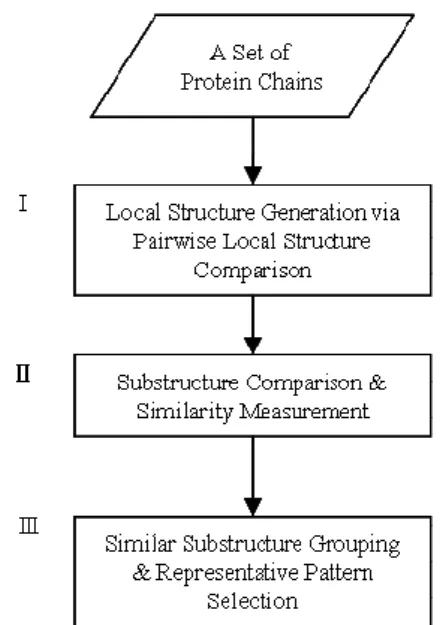
(2) function. Besides, enzyme classification provides a good environment to realize protein structures and functions. Each EC number symbolizes the proteins have same function or activate the same reaction would be grouped together. Enzyme active sites commonly occur in large and deep clefts on the protein surface, and they need significant favorable interactions between ligand and protein, which usually means that other small molecule ligand are also in surface depressions. It is also a trend to discovery relationship between functions and structures, especially local structures. Protein structure comparison algorithm is one of analysis tools on discovering structure conservations in protein structure research.. Figure 1. The flow chart for mining conserved structural patterns.. 3: MINING LOCAL STRUCTURE PATTERNS. STRUCTURE COMPARISON. min(S 1, S 2) max(S 1, S 2) , where S1 and S2 are the size of substructures.. (1). GH − Score = RMSD × matched resides number. (2). score =. In order to mining local structure patterns related to protein function or closed to protein binding area. In previous researches, proteins with the same function share similar local structure. Hence, to mining local structure region that have biochemical meaning will be very useful for identifying protein function. In this section, we will introduce the method of mining local structure patterns. Given a set of protein chains, our goal is to extract local structure patterns shared among those protein chains which have the same function. As shown in Figure 1, the overall framework contains three major parts: (I) local structure generation via pair-wise local structure comparison, (II) substructure comparison and similarity measurement, (III) similar substructure grouping and representative pattern selection, and will be illustrated in detail in the following sections.. 3.1: LOCAL STRUCTURE GENERATION via PAIRWISE LOCAL. In the first step, we approach a pair-wise protein structure comparison instead of multiple structure comparison. The reason is that multiple structure alignment will only report common part of substructure shared with proteins, but we want to have substructures shared with a subset of whole proteins. Our purpose is to detect all possible conserved substructures among a group of protein structures. In addition, we also want to detect substructures related to function or structure support via local structure detection. Therefore, we apply EMPSC algorithm [14] of rough alignment to detect similar local structure between two protein structures. EMPSC is one of the global structure comparison algorithm based on protein secondary structure elements (SSE) information. The kernel of EMPSC is to decompose protein structure into ellipsoidal representation of secondary structure of α-helix and β-sheet recognized by DSSP program and remaining segments, coils. Because of restricted parameter setting, EMPCS can use restricted RMSD value to become a local structure comparison algorithm. The EMPSC can perform both global and local protein structure comparison via parameter adjustment. If the parameter is restricted below the threshold, EMPSC will perform as local structure comparison. In order to keep sequence information, we make continuous amino acids of aligned points into subsequences. For the spherical conformation, we cluster subsequences with distance of 5Å between subsequences, and we call them substructure. Hence, we will extract all possible substructures via pair-wisely local structure comparison on protein chains with the same EC number. Furthermore, we can compare all pair-wise local structure comparison within a set of protein chains.. 3.2: SUBSTRUCTURE COMPARISON AND SIMILARITY MEASUREMENT In the second step, geometric hashing is used to compare two substructures extracted from in first step and calculate similarity score for a pair of substructures. The similarity score is used to define how similar between two substructures in their 3D structures. If the ratio of the size of these two substructures, score, as shown in Eq 1 is larger than 80%, the similarity score will be calculated; otherwise the similarity score will be zero. The reason is that comparison on substructures with the wide gap between sizes of two structures won’t make sense. Therefore, the gap of the size of two substructures is oversize; we will discard the comparison to speedup pair-wise comparison time. If the. - 1362 -.
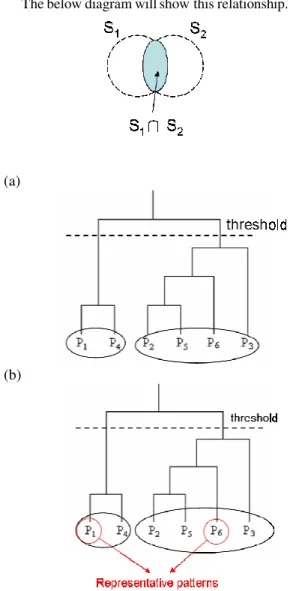
(3) comparison passes the filter criterion, the similarity score between two substructures will be calculated as defined in Eq 2 called GH-Score. S1 ∩ S 2 S1 ∪ S 2 , where S1 and S2 are the size of substructures. matchedrelation =. (a) S1 ∩ S2 is the number of matched residues. (b) S1 ∪ S2 is the number of total residues of two substructures. The below diagram will show this relationship.. (3). (a). 3.3: SIMILAR SUBSTRUCTURE GROUPING AND REPRESENTATIVE PATTERN SELECTION In the third step, we apply hierarchical clustering algorithm [8] to cluster similar substructures according to pair-wise scores calculated in the second step. Before similar substructure grouping, we filter out pairs via machedrelation in Eq 3. In Eq 3, we try to reserve pairs that are much similar between two substructures to take into account. We use complete linkage algorithm to cluster similar substructures and score is calculated by GH-Score. In this step, our idea is to group similar substructures together which share the common part of structures. After that, we select a substructure within a cluster as representative pattern for further pattern reorganization. We select a substructure as representative from a cluster which the representative with a cluster has highly similarity to others in the cluster, in other words, the representative shares most common part of substructures within a cluster. Therefore, the substructure is selected as representative pattern which is similar to others within a cluster. The diagram for substructure grouping and representative selection are showed in Figure 2.. 4: EXPERIMENTS. (b). Figure 2. The procedure of clustering and representative patterns selection. (a) Applying complete link clustering algorithm to obtain cluster tree, and using threshold cut-off to obtain clusters. (b) For each cluster, we select a substructure as the representative and the one that covers most of common structure within a cluster. In this example, P1 and P6 are representative patterns for a cluster of P1 and P4 and a cluster of P2, P5, P6, P3 respectively.. This experiment is to evaluate the idea of discovering conserved local structure among protein chains with the same function. As we know, enzyme classification is one kind of functional hierarchical classification, and proteins with the same EC number have the same function or reaction, which comes from different species. Therefore, it would be a good example to observe conserved local structure under functional classification because these proteins provide the same function and have local structures which involves in protein function. The experiment is designed as follows: (I) randomly select 10 protein chains from a set of protein chains with the same EC number, (II) run the procedure of mining local structure patterns, (III) repeat I and II until all pairs are selected and verified. As the experimental result shown in Table 1, randomly select 10 EC numbers from about 600 EC numbers to test our goal. The map between protein structure and EC is generated by PDBSprotEC [11]. In this experiment, randomly select 10 protein chains from each EC group and we set 5Å as threshold for substructure conformation and 0.8 as threshold for substructure similarity assessment. In this table, we still have no patterns in few EC numbers, and we guess that too similar global structures can’t generate conserved patterns even we use restrict threshold on comparing them. As the experimental result shown in Table 2, we take EC 1.6.2.4 as example to discover conserved local structure patterns. We randomly select 10 protein chains among 18 protein chains to extract patterns. We. - 1363 -.
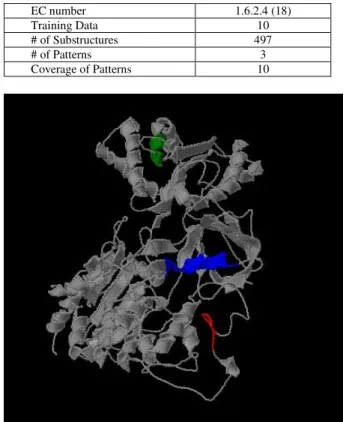
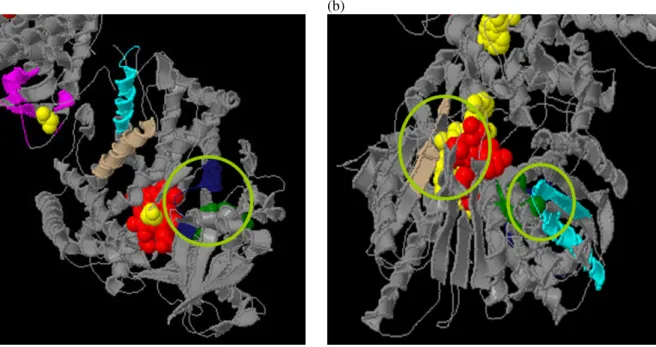
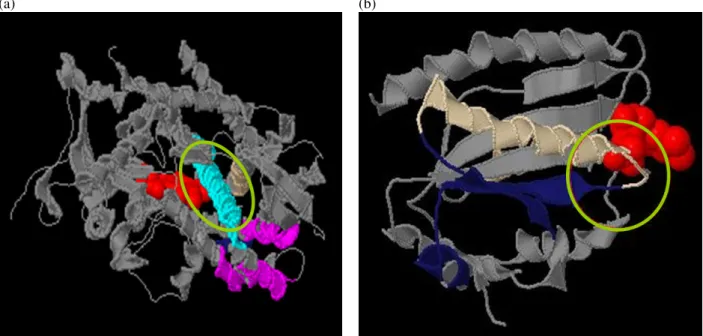
(4) use 5 Å as criterion for substructure conformation and then we can obtain 497 substructures and 3 structure patterns after substructure grouping and representative pattern selection. The coverage of these three patterns covers all training data. In Figure 3, it marks the locations of mined structure patterns of protein PDB ID (1AMO:A) by JMol (http://jmol.sourceforge.net/), and the areas colored in green, blue and red are patterns. Table 1. Experimental results for 10 EC numbers.. Protein Chains. # of Protein Chains for Train. 1.1.1.2. 18. 1.1.1.37 1.2.99.2. EC. # of Substructure. #of Pattern. Coverage. 5 Å. 10 Å. 5 Å. 10 Å. 5 Å. 10 Å. 10. 252. 299. 2. 4. 8. 10. 38. 10. 473. 217. 4. 2. 10. 10. 15. 10. 100. 256. 0. 3. n/a. 9. 1.8.1.2. 15. 10. 336. 493. 3. 4. 8. 10. 1.12.2.1. 16. 10. 61. 188. 0. 2. n/a. 9. 1.14.13.2 5. 33. 10. 429. 497. 7. 4. 10. 10. 1.14.99.3. 39. 10. 236. 162. 4. 3. 8. 10. 1.18.6.1. 30. 10. 312. 420. 4. 4. 9. 10. 2.3.1.74. 16. 10. 244. 121. 3. 0. 10. n/a. 2.7.2.3. 15. 10. 546. 356. 4. 4. 10. 10. Table 2. The experimental result of EC number 1.6.2.4. EC number Training Data # of Substructures # of Patterns Coverage of Patterns. 1.6.2.4 (18) 10 497 3 10. 5: RESULTS AND DISCUSSIONS Although we only test few cases on discovering conserved structure patterns of proteins with same function, the result shows that there exists local structure conservation region under functional classification. In order to verify the threshold value for substructure conformation, we use 5 Å and 10 Å to understand the relationship between conserved patterns and coverage rate, as shown in Table 3. In coverage rate, the result shows no difference except in size of patterns. We only use 5 Å as threshold value for substructure conformation due to keeping spherical conformation of substructure. Table 3. Comparison on different threshold value for substructure conformation.. Pattern Length # of Structures / # of Patterns Coverage of Patterns. Threshold of Substructure Conformation 5Å 10 Å Shorter Longer More The same. In addition, we know that enzymes bind substrates to speeds up biochemical reactions. Therefore, we select all possible substrates information from PDBSum (http://www.ebi.ac.uk/thornton-srv/databases/pdbsum/) related to protein chains within EC 1.6.2.4. In Figure 4, 5, and 6, the pictures show the relationships between conserved patterns and substrates. In Figure 4, (a) is protein 1BVY:A, (b) is protein 1J9Z:A and substructures are areas colored in aqua, midnight-blue, and tan, and the ball colored in red and yellow are substrates (Yellow: EDO, Red: HEM in (a) and Yellow: FAD, Red: NAP in (b)). In Figure 5, (a) is protein 1AMO:A, (b) is protein 1BU7:A and substructures are areas colored in aqua, midnight-blue, and tan, and the ball colored in red, yellow and green are substrates (Yellow: FAD, Red: NAP, Green: FMN in (a) and Red: HEM, Green: EDO in (b)). In Figure 6, (a) is protein 1SMI:A, (b) is protein 1B1C:A and substructures are areas colored in aqua, midnight-blue, and tan, and the ball colored in red is a substrate (Red: HEM (a) and Red: FMN in (b)). From these observations, we can find that some substructures are close to substrates but some are not. The circles on the pictures show the contact areas between substructures and substrates.. 6: CONCLUSIONS WORKS. Figure 3. This is a protein of PDB ID 1AMO:A. The 3D substructure colored in green, blue and red are mined local structures.. Fewer. AND. FUTURE. This work tries to identify relationships between local structures and functional areas. In the experiment, conserved local structure can be discovered and the observations show contact areas but not all elements of substrate contact with a substructure. As we know, the binding site in enzyme is determined by. - 1364 -.
(5) few key residues but not all of contact points will get involved into protein function [7, 13]. Therefore, our conserved patterns correspond with this point. We also find that our approach suffers from too similar global structures within the EC number because the conservation will be the whole protein structure. Therefore, the good situation for this approach is that protein chains share some common substructures and their global structures are a little bit dissimilar. Although this work is an incomplete study, the work of discovering conserved local structure from functional hierarchical classification, is still a beginning to realize relationships between local structures and substrates via local structure comparison based on global structure comparison with parameter restricted for local structure comparison. We can discover conserved local structure region from functional hierarchical classification because proteins have the same function will share some attributes reflect on their structures. Furthermore, we should discover all possible conserved local structure patterns for all EC numbers in the future. The computation time of geometric hashing on comparing with substructures will be a major problem to be improved. The reason is that mass substructures will be generated by pair-wise local structure comparison.. [7]. REFERENCES. [14]. [8]. [9]. [10]. [11]. [12]. [13]. [1-14] [1]. [2]. [3]. [4]. [5]. [6]. H. M. Berman, J. Westbrook, Z. Feng, G. Gilliland, T. N. Bhat, H. Weissig, I. N. Shindyalov, and P. E. Bourne, "The Protein Data Bank," Nucleic Acids Res, vol. 28, pp. 235-42, Jan 1 2000. T. A. Binkowski, L. Adamian, and J. Liang, "Inferring functional relationships of proteins from local sequence and spatial surface patterns," J Mol Biol, vol. 332, pp. 505-26, Sep 12 2003. T. A. Binkowski, P. Freeman, and J. Liang, "pvSOAR: detecting similar surface patterns of pocket and void surfaces of amino acid residues on proteins," Nucleic Acids Res, vol. 32, pp. W555-8, Jul 1 2004. T. A. Binkowski, S. Naghibzadeh, and J. Liang, "CASTp: Computed Atlas of Surface Topography of proteins," Nucleic Acids Res, vol. 31, pp. 3352-5, Jul 1 2003. S. J. Campbell, N. D. Gold, R. M. Jackson, and D. R. Westhead, "Ligand binding: functional site location, similarity and docking," Curr Opin Struct Biol, vol. 13, pp. 389-95, Jun 2003. S. J. Campbell and R. M. Jackson, "Diversity in the SH2 domain family phosphotyrosyl peptide binding site," Protein Eng, vol. 16, pp. 217-27, Mar 2003.. - 1365 -. G. Casari, C. Sander, and A. Valencia, "A method to predict functional residues in proteins," Nat Struct Biol, vol. 2, pp. 171-8, Feb 1995. A. K. Jain, M. N. Murty, and P. J. Flynn, "Data clustering: a review," ACM Comput. Surv., vol. 31, pp. 264-323, 1999. I. Jonassen, I. Eidhammer, D. Conklin, and W. R. Taylor, "Structure motif discovery and mining the PDB," Bioinformatics, vol. 18, pp. 362-7, Feb 2002. I. Jonassen, I. Eidhammer, and W. R. Taylor, "Discovery of local packing motifs in protein structures," Proteins, vol. 34, pp. 206-19, Feb 1 1999. A. C. Martin, "PDBSprotEC: a Web-accessible database linking PDB chains to EC numbers via SwissProt," Bioinformatics, vol. 20, pp. 986-8, Apr 12 2004. R. J. Najmanovich, J. W. Torrance, and J. M. Thornton, "Prediction of protein function from structure: insights from methods for the detection of local structural similarities," Biotechniques, vol. 38, pp. 847, 849, 851, Jun 2005. C. T. Porter, G. J. Bartlett, and J. M. Thornton, "The Catalytic Site Atlas: a resource of catalytic sites and residues identified in enzymes using structural data," Nucleic Acids Res, vol. 32, pp. D129-33, Jan 1 2004. J.-N. W. Yhi Shiau, Yu-Feng Huang, Chien-Kang Huang, "EMPSC: A New Method Based on Ellipsoidal Model for Protein Structure Comparison," (Submitted to Protein Engineering Design & Selection), 2006..
(6) (b). (a). Figure 4. (a) PDB ID: 1BVY:A. (b) PDB ID: 1J9Z:A.. (b). (a). Figure 5. (a) PDB ID: 1AMO:A. (b) PDB ID: 1BU7:A.. - 1366 -.
(7) (a). (b). Figure 6. (a) PDB ID: 1SMI:A. (b) PDB ID: 1B1C:A.. - 1367 -.
(8)
數據
+2
相關文件
With regard to spending structure, visitors from Mainland China spent 66% of their per- capita spending on shopping, whereas those from Hong Kong and Taiwan, China spent 77% and 66%
“In assessing the impact of the PNET Scheme on the professional development of local teachers, the centralised seminars have made a significant contribution and their value should
Define instead the imaginary.. potential, magnetic field, lattice…) Dirac-BdG Hamiltonian:. with small, and matrix
We use neighborhood residues sphere (NRS) as local structure representation, an itemset which contains both sequence and structure information, and then
` Sustainable tourism is tourism attempting to make a low impact on the environment and local culture, while helping to generate future employment for local people.. The
• Dilek Hakkani-Tur, Asli Celikyilmaz, Larry Heck, and Gokhan Tur, Probabilistic enrichment of knowledge graph entities for relation detection in conversational understanding,
In the work of Qian and Sejnowski a window of 13 secondary structure predictions is used as input to a fully connected structure-structure network with 40 hidden units.. Thus,
static: holds values of global variables, shared by all functions in the same class argument: holds values of the argument variables of the current function. local: holds values of
