國
立
交
通
大
學
財 務 金 融 研 究 所
碩 士 論 文
實質選擇權賽局與策略投資:
手機 EMS 產業之應用
Strategic Investments as a Real Options Game:
An Application to Cellphone EMS Industry
研 究 生: 游景璁
指導教授: 黃星華 博士
實質選擇權賽局與策略投資:
手機 EMS 產業之應用
Strategic Investments as a Real Options Game:
An Application to Cellphone EMS Industry
研 究 生: 游景璁 Student: Ching-Tsung Yu
指導教授: 黃星華 博士 Advisor: Dr. Hsing-Hua Huang
國 立 交 通 大 學
財 務 金 融 研 究 所
碩 士 論 文
A Thesis Submitted to Graduate Institute of Finance College of Management
National Chiao Tung University in Partial Fulfillment of the Requirements
for the Degree of Master of Science in Finance
June 2009
Hsinchu, Taiwan, Republic of China
實質選擇權賽局與策略投資:手機 EMS 產業之應用
學生:游景璁
指導教授:黃星華 博士
國立交通大學財務金融研究所
摘要
在手機EMS產業中,產能的供應扮演極為重要的角色。企業為了獲得額外的訂單 以及利潤往往利用企業購併的投資策略來獲取競爭優勢。本文嘗試把實質選擇權 與賽局理論引入策略投資的決策之中,並以富士康與比亞迪的競爭為例,建構實 質選擇權賽局來分析策略投資決策。本文利用賽局理論模型將競爭對手之反應納 入分析,並在每一階段裡探討策略投資的可行性。此外,本文亦將實質選擇權的 價值拆解為策略價值與彈性價值兩部分,配合比較靜態分析將各種可能的情境納 入考量,將不同的策略價值呈現出來。最後,本模型估計購併專案的投資效益, 並將將企業策略投資的競合關係進行整體性的分析。 關鍵字: 賽局理論、實質選擇權、策略投資、EMS 產業、富士康、企業購併Strategic Investments as a Real Options Game:
An Application to Cellphone EMS Industry
Student: Ching-Tsung Yu
Advisor: Dr. Hsing-Hua Huang
Graduate Institute of FinanceNational Chiao Tung University
Abstract
In cellphone EMS industry, capacity supply is an important concern for producer. In
order to earn additional profit, managers may choose capacity expansion strategies,
such as strategic M&A, to compete with their rivals. This study uses the options-game
framework to value an M&A project between Foxconn and its competitor BYD, and
analyzes the investment strategies in each stage. We take account of the effect of
BYD’s responses and distinguish the flexibility and strategic value. In addition, we
examine how sensitive a particular NPV is to changes in underlying assumptions.
誌謝
「論文是寫給人看的。論文的訓練過程才是論文的精華。」
終於,憑著恩師的兩句話完成本文,現在也已經看到當初努力的一點成
果了。兩年前毅然決然投入研究所領域,從對學術研究懵懂無知的大學
畢業生跨入交大財金所,我何其有幸,能在一開始轉變學習方向時就認
識恩師─黃星華博士。恩師 不僅在我遇到困難時給予適當的鼓勵,更讓
我在他身上看到拼命努力學習的精神,讓我真正體會到什麼叫解決問題
的能力。感謝恩師除了學術上引導我之外,生活態度及做人處事的道理
上也使我受教許多。在北京清華大學交換學生期間,更跟著恩師遠端視
訊做研究,恩師不辭辛勞的每個星期跟我在電腦前相約討論,並在研究
過程中,讓我知道做任何事都必須具備明確的動機,有動機才有動力,
有動力才能把事情順利完成,對我而言這樣的身教言教真是受益良多。
同時,感謝口試委員張興華老師、林信助老師、李漢星老師對本論文所
提供諸多寶貴意見,使我的論文更加完整。除了口試老師外,其他財金
所的諸位老師嚴謹治學態度,亦是我應效法的榜樣。此外,語言中心的
陳沛潔老師、吳思葦老師、秦毓婷老師在英文寫作上幫助我許多,每一
次的諮詢都讓我的寫作功力大增。
感謝IOF96的各位,雖然只有短短 兩年的相處時間,但我們一起經歷
金融海嘯、課業壓力,一起玩樂、一起學習、一起成長。在此,特別感
謝星星幫的家維、嵐鈞、茹雲、 璝志與我一起走過研究。以及與我同住
研二305的室友們:紜齊、祥霈、嵐鈞,我不會忘記一起喝酒健身唱歌爬
玉山看日出的時光,因為你們我的生活才充滿了歡樂和溫暖。感謝阿家
與阿鐵經常跟我分享生活上的點點滴滴。感謝好友Wincy總是對我抱持
信心,一直給予我許多鼓勵。求學的道路總是充滿艱辛,路途中我們需
要付出很多;但成長的過程又是快樂的,其間我們也會收穫很多。古人
有云:「鳥隨鑾鳳飛騰遠,人伴賢良品質高。」交大財金這個處處彌漫
著蘭芷芬芳的知識殿堂讓我深深地迷戀。轉眼之間已到畢業時節,回首
走過的交大路,胸中除了複雜的畢業心情之外,更多的是對那些曾給我
帶來薰陶,幫助我成長的師長和同學們的深深感激之情。
最後,於此謹感謝在天堂的父親,親愛的母親以及疼我的哥哥姊姊。
正是因為他們默默的奉獻與堅定的支援,我才能夠走到今天。家人總是
全力支持我個人的決定,讓我能無後顧之憂的完成碩士學位,也是使我
能讓你們驕傲的動力。
游景璁 謹誌
中華民國九十八年七月
Table of Contents
Contents
………... ⅠList of Tables
……….. ⅡList of Figures
……… Ⅲ1 Introduction
……….. 1 1.1Background………... 11.2Motivation and Purpose ………... 2
1.3Research Areas………. 2
2 Literature Review
……….. 32.1 Real Option Model ……….. 3
2.1.1 Introduction ……….. 3
2.1.2 Common Corporate Real Options ……… 4
2.1.3 Real Option Diagnosis Research ………. 6
2.2 Game Theory ………... 7
2.2.1 Introduction ……….. 7
2.2.2 Game Theory Diagnosis Research ………... 8
2.3 Real Options and Games ………. 8
3 Overview of the EMS Industry
………. 103.1 Foxconn Electronic Company ………. 10
3.2 BYD Electronic Company ……….. 11
4 Methodology
………. 124.1 Competitive Strategies Depending on Type of Investment and Nature of Competitive Reaction ……….. 12
4.1.1 Strategic Substitutes versus Strategic Complements ………... 13
4.1.2 Two-Stage Games: Strategic Value of Early Commitment …. 14 4.2 Price Competition ……… 16
4.3 Decision Tree Analysis ………... 18
4.4 EMS Valuation as an Options Game ……….. 19
4.4.1 The Value of Asset in Place ………. 19
4.4.2 Competitive Equilibrium Expansion ……… 20
5 Case Studies
………. 265.1 Competitive Strategy Measure ………. 26
5.2 Parameters Estimation and Results ………. 26
5.2.1 Market Demand Estimation and Nash Equilibrium Price Expression ………... 26
5.2.2 Value of Growth Opportunities Estimation ………. 27
5.3 Value Component ……… 30
5.4 Scenario Analysis ……… 31
6 Conclusions
……… 40A. Mixed Strategy Equilibrium
……… 42B. Strategic Value and Flexibility Value
………... 44List of Tables
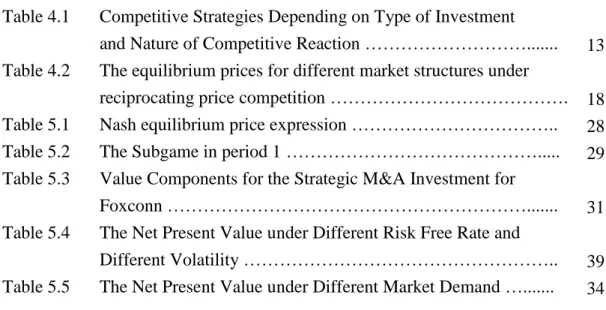
Table 4.1 Competitive Strategies Depending on Type of Investment
and Nature of Competitive Reaction ………... 13 Table 4.2 The equilibrium prices for different market structures under
reciprocating price competition ………. 18 Table 5.1 Nash equilibrium price expression ……….. 28
Table 5.2 The Subgame in period 1 ………... 29
Table 5.3 Value Components for the Strategic M&A Investment for
Foxconn ………... 31
Table 5.4 The Net Present Value under Different Risk Free Rate and
Different Volatility ……….. 39
List of Figures
Figure 4.1 Strategic Substitutes versus Strategic Complements ……….. 14 Figure 4.2 Competitive Investment Strategies in the M&A: Proprietary
versus Shared Investment ……… 23
Figure 4.3 Proprietary Investment ……… 24
Figure 4.4 Shared Investment ……….. 25
Figure 5.1 The Additional Value of Proprietary Investment and Shared
Investment ……….. 37
Figure 5.2 Shared Investment of Foxconn ……… 38
Figure 5.3 NPV with Game Theory versus NPV without Game
Theory ………. 32
Figure 5.4 Expanded NPV and Flexibility Value under Different
Risk-free Rate ……….. 33
Figure 5.5 Strategic Value and Flexibility Value under Different
Risk-free Rate ……….. 34
Figure 5.6 Strategic Value and Flexibility under Different Market
1
1. Introduction
1.1 Background
Since the later 1990s, electronics manufacturing services (EMS) factories clustered together and became a partner of strategy alliance with original equipment manufacturer (OEM). In the originally service area, the EMS factories started to participate in the research and development of OEM industry, and provided the post-sale service to the OEM industry terminal customers. When the market is dominated by a small number of oligopolists, the EMS factories integrated into the coordination-effective industry and succeeded in global market. Nowadays, the influence of economical globalization and integration has led to the keen competition. The EMS enterprises which intend to survive in this market should enhance their competitiveness, advance their own value and strengthen the effectiveness of their investment strategies. The goal of enterprise investment is to make a best decision in an uncertain environment and then to realize its value maximization. Thus, choosing a reasonable method of investment strategy in this industry has becomes the key to modern management.
The traditional discounted-cash-flow (DCF) approach has been used to calculate the net present value (NPV) of projects. Since using this method in investment decision-making has neglected the flexibility and the opportunity cost of investment strategy, DCF approach was found insufficient when evaluating the investment project. The new method in investment decision must consider the flexibility of project, and can provide more feasible policies for enterprises in decision making. Since the beginning of 1980s, real option theory has been used academically, developed for solving the problems of neglected the flexibility value to provide brand new thinking. In the process of investment decision making, the real option method
can help incumbent choose start point flexibility for existing projects and it also depend on the information at different stages for analysis.
1.2 Motivation and Purpose
The purpose of this paper is to use the options-game framework to appraise the project of M&A and investment for capacity expansion in the cellphone EMS industry, and analyze which strategies (proprietary or market shared) is the best for the companies when they face the same competitor. In other words, the expiration of investment decision-making method under the uncertainty environment was replaced by the options-game framework in this paper. Finally, this approach can depend on competition environments to adopt a suitable investment strategy.
When introduced the options-game framework, the case application explains the integration of real options models and game theory. It calculates the bilateral reward in games with option pricing model, and effectively modifies the dispute which the reward from game theory is too simplification.
1.3 Research Areas
Taking EMS mobile phone factory (Foxconn and BYD) for example, the manufacturer when they appraisal investment plan, the important consideration are the quantity of delivery, the competitor now and new factory order form price in the future, market’s point of view of up-to-date mobile phone, as well as possibly make the investment strategy in the new market competition change. Obviously, when company incumbent makes certainly fixed produces investment plan, the difference of the demand of products may change the present value of income and the rival’s investment in the future will be the most important challenge.
This thesis is based on the investment decision analysis foundation method and considers the characteristics of investment strategy. Then, the method observes the
3
used literatures and past real cases of different industry to prove the practicability of the game theory, and proposes an approach which combines the game theory and real options in the decision analysis. Eventually, this paper utilizes the options-game approach which is the best strategy investment pattern in the EMS industry. The main innovations of this thesis are:
1. This research has established the options-game approach application method in the investment strategy of the EMS industry.
2. This research has analyzed how to distinguish between flexibility value and the strategic value in the investment through the practical application, and how to choose the optimal investment strategy.
In our study, we introduce the purpose and research areas in section 1, and then review previous literature in section 2. Next, we make specific statement about the background of Foxconn and BYD in section 3. In the section 4 and 5, we introduce the methodology and give the numerical result by case application. Finally, we give the conclusion of our study in section 6.
2. Literature Review
2.1 Real Option Model
2.1.1 Introduction
The real option model is a concept comes from the financial options. Financial options are one kind of contract, and it entrusts holder in certain time to purchase or sell specific quantity financial product right using the price which has agreed beforehand. While financial options are written on an underlying financial asset, a real option is based on an underlying real asset. Similar to a financial asset, the future value of the underlying real asset is uncertain. Real option entrusts with the right is also the options to investment or management. If company has real option to act the
value change, chooses the investment plan or management nimbly depend on the basic property in certain deadline.
Black and Seholes (1973) proposed the famous option pricing model, and this model solved the European stock option pricing problem; Cox, Ross and Rubinstein (1979) founded the discrete time binomial option pricing law. These three articles have laid the financial option pricing rationale, and impelled the 20th century finance option to develop enormously.
The concept of option contains limits not merely of the financial derivation tool along with the option theory and the real situation development. Moreover, it has represented one kind of new financial thought, the financial theory and the real option theory. This kind of theory may widely apply in the each aspect of economic life, and smoothed the way for the economic evaluation in many domain applications.
At the end of 1980s to the beginning of the 90's, the real option theory appeared in the domain application and the promotion of enterprise’s investment strategy, and it have represented the West in the aspect of business management breakthrough recently. Myers (1977) for the first time proposed " the real option " concept, and first conducts the profundity research to the option pricing theory in the investment project. He proposed that DCF-NPV is not suitable for to the investment strategy valuation, since the economic value of the investment strategy is composed completely by two parts: one was (static state, passive) direct cash flow NPV, and the other one was management elasticity and the strategy interaction option value.
2.1.2 Common Corporate Real Options
The real option is one new thinking mode, and it can help enterprise innovate their investment decision with this new method. Facing uncertainty environment challenge, the enterprise policy-makers should adopt positive treatment of the uncertainty of
5
investment. In addition to discover any kind of uncertainty factor in the project, and uses these factors to enhance the project value. Specifically, enterprise can use the option to defer, option to growth, option to abandon, option to expend, and other corporate real options to increase project management flexibility and to dodge the risk of investment plan.
Kester (1984) compared some investment strategy with the option who can bring the investment opportunities and create the value in the future, and proposed the investment strategy and the option had similarity; Amram and Kulatilaka (1999) pointed out the real option is one of the thinking who introduced into the interior of the enterprise investment strategy decision-making from the money market rule. It can help the superintendent uses it to mark out plan and manage the investment strategy effectively.
Faulkne (1996): Regarding the valuation of investment strategy, real options method even better. He points out many well-known Japanese enterprises, taking example for EastrnanKedak now is uses the real option method to value at the investment strategy. This method is conducive to expose the neglect option value of DCF-NPV, and has guided the massive capitals to invest in the project correctly. Thus, it impelled the Japanese economy development in bloom. Dixit and Pindyck (1994) and Sharp (1991) employ the idea of real option to analyze firm’s investment strategy. They were merely carried on the analysis in theirs descriptions from the specific aspect but not involved to the nucleus. They had not been able to reflect the real value in special cases and make the correct investment decision.
Using the theory of real option to make investment strategy has further development and more comprehension. Since the investment strategy usually has many stage, many decision points, more and more scholars regard it as the compound option. At the same time, real option pricing method is no longer limits to
Black-Scholes option pricing model and Cox-Ross-Rubinstein option pricing models. Instead, it depends on the revision and relaxation of situations which have certain conditions or proposes to set new pricing model.
For example, Kulatilaka (1998) indicated that there are many interactions of real options in an identical investment strategy, and he emphasized it cannot estimate value by itself in the identical investment. Copeland and Antikarow (2001) constructed the multi-stage compound option using Cox-Ross-Rubinstein option pricing models, and appraised multiple period investment plans. Real option pricing model of investment strategy provided the realistic decision method in the economic life.
2.1.3 Real Option Diagnosis Research
Paddock, Siegal and Smith (1988) analyzed the right of rent in an offshore oil field project, and compared the difference between the value of traditional method of DCF and option to defer. Bailey (1991) examined the contingent-claims approach to valuing real assets. Empirical tests using prices of rubber and palm-oil estates and, the real option model differs markedly from conventional discounted-cash-flow models. Quigg (1993) first examine the empirical predictions of a real option-pricing model using a large sample of market prices.He found empirical support for a model that incorporates the option to wait to develop land. The option model has explanatory power for predicting transactions prices over and above the intrinsic value. Herath et al. (1999) offered that the NPV model is able to account for the sequential nature of decisions involved in an R&D project – the option to wait – without assuming the existence of a market valued security that reflects the project. He find that additional option valuation assumptions to reflect uncertainty bring little analytical advantage and great practical problems. He and Park (1999) also developed a valuation model
7
incorporating the risk-free arbitrage features of the binomial option pricing model into a decision framework and applied it to the introduction of a new product: the new Mach III from Gillette. They demonstrated the value of innovation and its impacted on the stock value.
2.2 Game Theory
2.2.1 Introduction
In the game theory proposed by Von Neumann and Morgenstern (1942), they advocated when taking an action, the player should not only consider their own gains, but must also further consider the opponent’s behavior, with its emphasis on a zero-sum game. It describes a situation in which a participant's gain or loss is exactly balanced by the losses or gains of the other participants, yet its application is very limited. It will be inapplicable when the counterparties are acting rationally in a strictly competitive non-zero-sum game.
Until Nash (1950) proposed Nash Equilibrium, showing that in non-zero sum and non-cooperative game, equilibrium must exist. As long as the opponent’s strategy is identified, the competitor will be able to make the optimal response (best response). When each player has chosen a strategy that they consider as their best response, then the current set of strategy choices and the corresponding payoffs constitute the Nash equilibrium.
Game theory divides into two parts, one is cooperative game, and the other one is non-cooperative game. Cooperative game permits of profits, to some degree, consultations, negotiations, and even collusions between players, but cooperative Game does not allow both players to implement communication and negotiation. Hence, Non- Cooperative Game more conforms to the industrial competition situation. For a company, it has to make strategic investment decisions all the time. That is, a
company must deliberate not only the competitor's reactions, but also exponential effects of the competitor’s reactions to company's value, including positive and negative effects.
2.2.2 Game Theory Diagnosis Research
Chuang, Wu and Varaiya (2001) applied a Cournot model to analyze industry investment, market participation, and the reliability of multi-player expansion rather than expansion by a traditional monopolist. Butterfield and Pendegraft (2001) cited game theory and an extension, the theory of moves, are presented as alternative methods of modeling IT investment decisions. This technique specifically considers investments motivated by operating or competitive necessity.
Kaleelazhicathu (2004) considered which game theory is a tool primarily used to solve multi-personal decision problems. Oligopolies like mobile communications industry, with typically 3 to 6 operators, provide ample opportunities to use game theory in solving such problems. His thesis gives an overview of game theory and looks at areas of application within the mobile industry. It also mentions the relevance of game theory in the Mobile Operator Business (MOB) game.
2.3 Real Options and Games
For the early literature about real options, researchers either ignored competitive entry or assumed that it was exogenous. If there is competition, each firm’s payoff is affected by the actions of the other players, and competitive interaction can change the optimal investment criterion. McGahan(1993) explored the tension between competitive pressure to invest and the real option value in an entry opportunity under uncertainty about demand. If an outsider's expectation about buyer valuation makes entry appear less attractive and if an incumbent can keep proprietary its updated information about demand, then it may be able to secure its advantage and partially
9
deter imitators without a substantial initial capacity investment. Kulatilaka and Perotti (1998) proposed that in a Cournot duopoly setting the first firm to invest can gain a strategic advantage since market share and the value of early investment increase more with higher demand uncertainty than does the value of waiting. In addition to, they consider a Stackelberg growth option when a firm has a first-mover advantage and also conclude that higher demand uncertainty justifies earlier exercise of the growth option in 1999.Huisman (2001) showed that the new theory of strategic real options can be used to fill the “empty hole”. Based on the work by Smets (1991) standard models are identified, and they are analyzed by applying a method involving symmetric mixed strategies. Finally, they established to what extent investments are delayed when technological progress is anticipated, and it is found that competition can be bad for welfare.
In the real competition environment, game theory reveals the strategic effect adopted by rival companies in the duopoly market. It strengthens real option theory which takes variety of opportunities for investment and management flexibility as options to analyze. Paxson and Pinto (2004) major reported investment plans indicate “leader-follower” patterns. Using three real competition options models (The options-game approach), they determine the optimal timing of 3G investment of one Portuguese mobile company, Optimus, taken as the follower. Smit and Trigeorgis (2004) synthesize the newest developments in corporate finance and related fields, in particular real options and game theory, to help bridge the gap between traditional corporate finance and strategic planning. They analyzed competitors’ interaction in this game based on the theory of duopoly market and divided competitors’ responses into Strategic Substitute and Complement. Moreover, they illustrate the use of real options valuation and game theory principles to analyze prototypical investment opportunities involving important competitive/strategic decisions under uncertainty in
2006.
The response of competitors to enterprises’ investment strategies is evaluated through the analysis of the options-game approach in order to calculate the profit. The blind spot of real options which derives from neglect of competition in the dynamic market could be amended by means of game theory. Owing to the deficiency of entering limit, it causes competitor situation in distribution of new products, marketing plan and R&D. The decision-making pattern which is proposed in this research will be discussed and be explained through EMS investment competition cases in the section 5.
3. Overview of the EMS Industry
A generalized coordination EMS industry provides the service of entire process manufacture and the wholesale solutions for the international OEM; therefore, the OEM industry can apply the outsourcing strategy on enhance its core competitive power. For example, in the strategic cooperation implemented by Sony Ericsson Corporation and world-wide EMS enterprise Flextronics, Sony used OEM and passed on most of its products to electronics manufactory such as Flextronics, and mainly focused on R&D and marketing. Within years both companies reached to a great success. Similarly, Nokia Corp. used the same strategy with Foxconn and obtained the vast success in global market as well.
3.1 Foxconn Electronic Company
Foxconn is the trade name of the Taiwan based firm Hon Hai Precision Industry Corporation. Foxconn is the largest manufacturer of electronics, and mainly manufactures on contract to other companies. Presently, Foxconn has 40% market share in 2G and 3G mobile phone EMS industry. Although sometimes referred to as the OEM, Foxconn would be more accurately described as the original design
11
manufacturer (ODM).
The global wireless communication industry is bloomy development, which attracts ESM industry to invest and to compete intensely. Under such circumstances, Hon Hai has set the Foxconn Precision Component Beijing Corporation in order to obtain the orders from Nokia, this business pursuit consist with of which that of Hon Hai : Hon Hai tends to set the R&D center nearby its major customers or to merge its component factories. Foxconn proceeds to vertical integration to enter the 2G and 3G mobile phone markets, and strives to obtain the orders from the first three international mobile phone corporations (Nokia, Samsung, and Motorola). The M&A strategy is provide to be successful, which is manifested in the fact that the 25% of Nokia’s output and 40% of Motorola’s were mainly taken by Foxconn. For instance, Foxconn not only merged Nokia’s component factory in Finland to successfully strive the orders from Nokia, but also acquired the ODM factory, Chi Mei Communication Systems (CMCS), to improve the quality of its product research and development since CMCS has a strong team in designing. Nevertheless, due to decrease of Motorola and increase of Samsung and LG, Foxconn in 2007 turned its goal orders to Korea mobile phone corporations.
3.2 BYD Electronic Company
BYD Electronic, the subsidiary of BYD Company Limited, is engaged in the manufacture and sales of mobile phone components, mobile phone modules and assembly services to mobile phone manufacturers. Presently, BYD has 10% market share in 2G and 3G mobile phone EMS industry. One of its customers is Nokia, which is the world’s leading mobile phone supplier.
In 2003, BYD followed Foxconn’s “the reversion of vertically integrated strategy” and started to enter the EMS industry. Due to the growing demands on
mobile phones in the global market, the mobile manufacturers have been moved to Asia and other new markets as Russia, Brazil, Mexico and Eastern Europe. Besides, the companies famous for designing mobile phones (such as Nokia, Motorola, Samsung, LG and SonyEricsson) have adopted the outsourcing strategy. They tended to choose the suppliers who pursue a vertical integrated goal and provided manufacturing/service platforms for global use as their cooperative partners. Therefore, BYD, proceeding as vertically integrated, started to offer mobile phone assembly service for Nokia and Motorola. In 2006, BYD firmly established their roles as “component suppliers of one-stop mobile phone” in the international market. After that, BYD further advanced the ability of product design and its production capacity to provide high-end products. It expanded new production facilities at Huizhou in Guangdong Province (China), Chennai (India), Komarno (Hungary), and Cluj (Romania) in order to make a platform for globalization production. At present, its assembly services for mobile phone modules have included the manufacturing of battery, keyboards, and cell phone components. Hence, BYD has obtained the authorization to assembling mobile phone.
4. Methodology
This section 4.1 and 4.2 follows Smit (2003) and then we use decision tree to describe the expansion of EMS industry. Afterwards, we evaluate the value of real option by the present value of growth opportunities (PVGO) approach, and use the decision tree which integrates game theory to be the target of this paper analysis.
4.1 Competitive Strategies Depending on Type of Investment and
Nature of Competitive Reaction
Before the development of game theory, it is generally believed that the company may neglect the influence of strategies on the competitors’ responses in perfect
13
competition or the monopoly market, which is not true under duopoly market. Game theory is the method to understanding how interactions of decision making happen.
Fudenberg and Tirole (1984) presented that the outcomes of many strategic interactions in industrial organizations can be predicted by using the basic framework of strategic effects in simple two-period model, in which the interactions between company and its rival’s influence on the investment decision ware analyzed. The response of competitor investment is faced by two affects (See Table 4.1):
(1)Nature of competitive reactions: Contrarian or Reciprocating
(2)Competitive strategies on type of investment: Tough or Accommodating
Specifically, a competitor’s response to a strategic investment decision is likely to depend on two dimensions: the type of competitive actions-strategic substitutes or complements-and whether the strategic investment is tough or accommodating.
Table 4.1
Competitive Strategies Depending on Type of Investment and Nature of Competitive Reaction
Contrarian (down-sloping reaction/strategic substitutes) Reciprocating (up-sloping reaction/strategic complements) Tough e.g. Proprietary investment
Committing and offensive
Invest(+strategic effect)
Flexible and inoffensive
Don’t invest/wait (-strategic effect) (Nash Price competition)
Accommodating
e.g.
Shared investment
Flexible and offensive
Don’t invest/wait (-strategic effect)
Committing and inoffensive
Invest(+strategic effect)
(Leader-follower/accommodation or Nash Price competition)
Source: Smit and Trigeorgis (2004) pp. 232
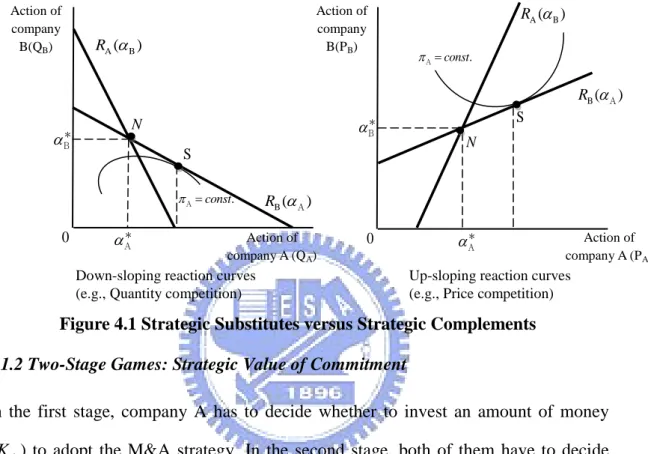
4.1.1 Strategic Substitutes versus Strategic Complements
Strategic Substitutes (Quantity Competition) or Strategic Complements (Price Competition) has an essential difference: (1) Strategic Substitutes is the competition
type where a competitor’s response to a strategic investment decision is using quantity to rival with its competitor (down-sloping reaction curves). (2) Strategic Complements is the competition type which a competitor’s response to a strategic investment decision is using price to rival its competitor (up-sloping reaction curves).
Figure 4.1 Strategic Substitutes versus Strategic Complements
4.1.2 Two-Stage Games: Strategic Value of Commitment
In the first stage, company A has to decide whether to invest an amount of money (K ) to adopt the M&A strategy. In the second stage, both of them have to decide A
whether to invest in new factories to increase capacity or to accelerate resource utilization (expending), and then to choose the optimal strategiesA*(KA)andB*(KA). Thus, the profit present value of two companies A and B in second stage are
* *
( , ( ), ( ))
A A A A B A
V K K K andV KB( A,*A(KB),B*(KA))which are effected by investing amount of money (K ), and the optimal strategies A
* *
( ) ( )
A KA and B KA
of both
companies in second stage.
There are two effects in the first stage, one is direct effect such as Foxconn obtaining the orders from original mobile phone corporations to increase the profit which was earned in second stage, and the other is strategic effect which changes the rival’s behavior such as forcing them to accept small market shares or withdraw from
Down-sloping reaction curves (e.g., Quantity competition)
A( B) R B( ) R A * B * A . const A N S Action of company A (QA) Action of company B(QB) 0
Up-sloping reaction curves (e.g., Price competition)
A( B) R B( ) R A * B * A . const A N S Action of company A (PA) Action of company B(PB) 0
15
a competition. To illustrate, Foxconn want to be monopolist who owns a large amounts of revenue in the market, so it considers investing through using the M&A strategy in the first stage investment to deter BYD from entering the market (NPVB0).
If company A invests an amount of money (K ) at the first stage, then the A
effect of present profit value on company B in the second stage is expressed as follows: * * * (4.1) (4.2) B B B B A A B A A B B B B A A A A A V V V dV dK d d K dV V V d dK K dK
If the investment strategy of the first strategy is tough, then it causes its competitor’s entry unprofitable in the second stage (e.g. B 0
A
dV
dK ), and will enable company B to
defer the entry into the market. Instead, if the strategy which causes the rival to defer the entry into the market is useless, company A can use the accommodating strategy
(e.g. B 0
A
dV
dK ), the strategy of which is invested in the first stage. Then, the effect of
present profit value on company B in the second stage is expressed as follows:
* * * (4.3) (4.4) A A A A A B B A B B A A A B A A B A V V V dV dK d d K dV V V d dK K dK
Hence, the essential condition of the tough or accommodating strategy which company A used is A 0
A
dV
dK , and the commitment effect consists to two
The direct effect is when A invests in the first stage, it influences company A’s own second stage profit value with the competitor’s reaction constant. The strategic effect results from the impact of company A’s strategic investment on competitor B’s optimal second-stage action,
* B A d dK
, and its resulting indirect damages on company A’s profit value. The reliable investment strategy can change the rival’s expectancy and then changes its reaction.
Company A adopts investment strategy at first stage to produce the strategic effect to its present profit value at second stage, the strategic of which can be distinguish into following two factors:
(1) In first stage, company A has tough or accommodating position to its competitor. If it is tough, then B 0
A
dV
dK (e.g., proprietary); Otherwise, if it is accommodating,
then B 0
A
dV
dK (e.g., share the market).
(2) In second stage, the reaction of the rival is RB(A) B( A), which is strategic substitute ( B 0
A
, quantity competition) or strategic complement ( 0
B A ,
price competition). And the strategic effect is following:
* * * * * * * = ' ( ) (4.6) B B B A B A A B A A B A B A A A d V d V d d d R dK dK d dK dK where * ' (B A)
R denotes the slope of company B’s reaction function to A’s action.
4.2 Price Competition
In the competition of Foxconn and BYD, the nature of competitive reaction is reciprocating. Bertrand (1883)developed the duopoly market model (Bertrand model)
* (4.5) ( ) A A A B A A B A dV V V d dK K dK
commitment effect direct effect strategic effect
17
which took the price as the competition factor. In this section, we present the analytic derivation of reaction functions and equilibrium outcomes for market structures under price competition. We assume for simplicity that the demand for product is linear in prices:
, ,
( , , ) (4.7)
i i j i t i t i j
Q P P bPdP
The quantity sold by company i is a function of its own price ( )P as well as that of its i
competitor(Pj). The coefficients b and d capture the sensitivities of the quantity sold to the firm’s own and its competitor’s price settings, respectively. The profits of each firm i (i = A or B) are then given by
, ,
( , , ) ( )( ) (4.8)
i P Pi j i t Pi ci i t bPi dPj
The reaction function of each company i is again obtained by maximizing its profit value ( , ) i
i i j
V P P k
over its own price ( )P . Settingi i 0
i V P , gives , ( )(1 ) ( ) (4.9) (2 ) i t j i i i j i dP bq bc R P b bq
A company engaged in price competition has a best (profit-maximizing) response to competitor price changes according to its reaction function. Substituting the expression for in the place of in equation (4.9) gives the general asymmetric Nash equilibrium price expression:
, , * 2 2 2 ( ) ( ) (4.10) 4 i t i j t j i b dc d bc P b d
The equilibrium prices for different market structures under reciprocating price competition can be seen in Table 4.2.
( ) i j
Table 4.2
Equilibrium Prices for Different Market Structures under Reciprocating Price Competition
Action (A,B) Market Structure N/M/S/A/D Equilibrium Price, Pi
Period 2
(DI, DI) Nash price competition (N)
(DI, DD) Monopolist (M)
(II, DI) Stackelberg price leader (SL)
Stackelberg price follower (SF) (mainly aimed at Pj)
(DD, DD) Abandon (A)
Period 1
(I, I) Nash (N)
(I, D) Stackelberg price leader (SL) /
Monopolist (M)
(D, D) Defer (D)
Source: Smit and Trigeorgis (2004), pp. 265-266
4.3 Decision Tree Analysis
The construction of the decision tree is crucial, and we use it to describe in detail how decision of M&A investment and expansion game happened. First, Figure 4.2 constructs two different competitive strategies on type of investment: Proprietary or Market Shared. Second, if company A makes the M&A investment, it has options to choose whether to execute expansion investment in period 1.
Panel A describes that company uses proprietary investment strategy to deter the rival from entering market, and then earns the profit as a monopolist. For example, Foxconn can delay BYD Electronic being listed in Hong Kong by action at law, which causes BYD unable to collect enough money to make M&A investment, and then Foxconn merges with LG’s component suppliers gain the manufacturing potency
, , 2 2 2 ( ) ( ) 4 i t i j t j b bc d bc b d ( ) 2( ) t c b d b d , , 2 2 2 ( ) ( ) 4 2 i t i j t j i b bc d bc dc b d 2 2 2 2 ( ) ( ) 2 2 2 (4 2 ) j Cj bd i bCi d j bCj dCi b b b d , , 2 2 2 ( ) ( ) 4 i t i j t j b bc d bc b d , , 2 2 2 ( ) ( ) 4 2 i t i j t j i b bc d bc dc b d
19
of LG’s mobile phone. Simultaneously, it prevents BYD from obtaining the Korean mobile phone orders (detail see Figure 4.3). After Foxconn chooses the first action, demand move again and the decision is repeated at period 2.
Panel B illustrates the company who uses accommodating investment strategy to share market profit with its competitor (detail see Figure 4.4). For instance, Foxconn obtains the property rights of the Diabell, which is one of LG’s component suppliers, and leaves the options for BYD to decide whether to merge with other component factories (Sinyoung, Mosen and the other five factories). If BYD invests in M&A, then both companies can share market. Thus, Figure 4.4 depicts a simultaneous game which determines whether the companies can successfully obtain the order from LG.
4.4 EMS Valuation as an Options Game
This research uses PVGO approach to analyze real options in the M&A project. The
PVGO is a concept that originated with the work of Miller and Modigliani (1961).
The value of the firm is separated into the value of assets in place plus the NPV of
future growth projects.
4.4.1 The Value of Asset in Place
We assume the project will last n periods and generate an expected (free) cash flow
TCFt, t = 1, 2, . . . , n in each of these periods. We also assume that the cash flows are
paid immediately at the end of each time period in a manner analogous to the
dividends of a stock. 1 (4.12) t TCF V k g t
the perpetual expected growth rate of cash flow. Note that Vt does not include the
cost of investment at period i,I . i In order to construct a binomial option framework, it
is assumed that the project value of the next period can either move up by rate u with
probability p or move down by rate d with probability 1− p, where p presents
risk-neutral probability.
Let σ be the volatility, r be the risk-free discount rate, and t be the subinterval of
a small period. Cox et al. (1979) derived p e d u d rt ,ue t andd 1 u . Using these formulas, the binomial option framework of the project with its cash flow can be
constructed as Figure 4.2 illustrates. We consider a situation where there is
uncertainty about the value of V at period 1. In addition to the above, assume:V1= Present value at period 1 of the future cash flows from expending if market is favorable;V1= Present value at period 1 of the future cash flows from expending if market is unfavorable. The value of asset in place (Vi,j) at period i and state j can be calculated by the following recursive equation (4.13) to (4.15).
1 1 0 (1 ) , 0, 0 (4.13) 1 pV p V V V i j r i,j 2 2 1 (1 ) , 1, 0; (4.14) 1 pV p V V V i j r i,j 2 2 1 (1 ) , 1, 1; (4.15) 1 pV p V V V i j r i,j
4.4.2 Competitive Equilibrium Expansion
This section surveys the basis for the formulas used to calculate the present value of a proposed M&A investment of a two-stage decision structure. We consider the situation where there is uncertainty about the success of the M&A activity. For company A, the value of the M&A project calculated using the traditional NPV approach is:
21
A
K = M&A investment at period 0 (cost of real option);
t
I = Cost to expending at period t (exercise price);
t
V = Present value at period t of the future cash flows from expending
If the M&A activity is unsuccessful, then company A cannot expand because there is no enough purchase orders. Take the Foxconn for example, in period 0, it has successfully used the M&A strategy to merge Diabell, the important component factory, and then make an investment (It) to expand its business in period 1. First, we take the additional capacity (Qt,F) created by the expending strategy, and multiply the price of four investment-timing scenarios: Nash, Stackelberg Leader, Stackelberg Follower and Monopolist; Further, we obtain the additional cash flow of competitions (TCFt,F) under the expending state, and use the above method to calculate the additional expansion value. In addition, in the real options concept, the option to expand would be analogous to a call option (Ct,F) on this added cash flow value.
The exercise price would be equal to the extra investment outlay (I ) required t
building additional capacity, and then the option to expand (Ct i,=Vt,FIt ,i = Foxconn or BYD) can be expressed as: (1) both companies invest simultaneously (N)CNt i,=VNt i, It (2) the first mover (L) preempts the market CLt i,=VLt i, It (3) the second mover (F) follows the leader CFt i, =VFt i, It(4) the monopolist (M) monopolizes the market CMt i, =VMt i, It. For each subgame, we first identify pure dominant strategies, and then find the Nash equilibrium to be the result that neither company can improve by making a unilateral move.
We use backward induction to calculate the value, which is the result of the strategic choice by Subgame Perfect Nash Equilibrium. Moreover, backward (4.16) (1 ) t c A t A V I NPV K r
induction is the method using the associated risk-neutral probabilities to compute the process which moves backward over random demand moves. In my case, the expansion option value for company i (i = Foxconn or BYD) at time t (PVGOi,t) is
estimated by adding to the expectation of future growth value to the cash-flow value creation at the current expansion subgame, Ct i, :
, 1 , 1 , (1 ) 0, (4.17) (1 ) i t i t i t t pC p C PVGO Max r
23
Panel A. Proprietary investment: flexible and inoffensive strategy
Panel B. Shared investment: committing and inoffensive strategy
23
θ
A
B B
Make Strategic M&A Investment commitment (KA)
Do not invest / wait ( base case) Invest in M&A (KB) Invest in M&A(KB) Defer (D) Defer (D) u d D N S S I D A B B I D I D A N S S I D A B B I D I D u d A A θ A u u θ θ A A d d I D I D D D M D M D
Make Strategic M&A Investment and litigation (KA*)
Do not invest / wait
( base case) Period 0
Period 0 Period 1
Period 1
Notes: The combination of competitive decisions (A or B) and market demand moves (θ ) may result in one of the following market structure game outcomes:
The square (□) in represent the decision note which company A chooses the actions to the next period, and the circle (○) shows the resolution of market demand uncertainty on this two period example. N: Cournot Nash price competitive equilibrium outcome; S: Stackelberg leader / follower outcome; M: Monopolist outcome; A: Abandon (0); D: Defer / stay flexible (option value)
24
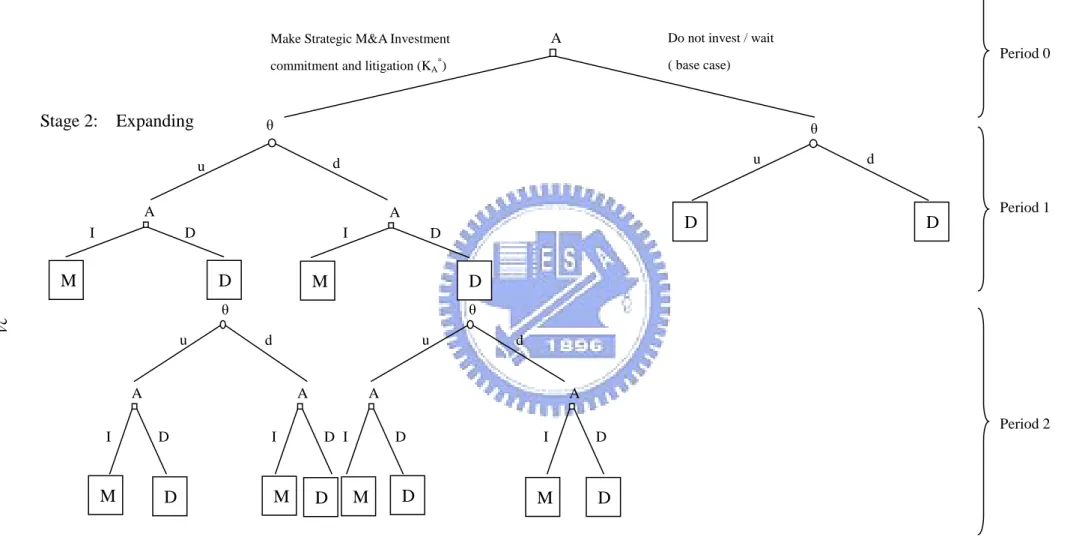
Figure 4.3 Proprietary Investment
Notes: The investment decisions and market demand moves (θ ) may result in one of the following market structure game outcomes: M: Monopolist outcome; A: Abandon (0); D: Defer / stay flexible (option value)
24
Make Strategic M&A Investment commitment and litigation (KA*)
Do not invest / wait ( base case) A D D u θ d Period 0 Period 1 Period 2
Stage 1: M & A competition
M D M D u θ A A d I D I D u θ d u θ d A D I A D I A D I A D I M D M D M D M D Stage 2: Expanding
25
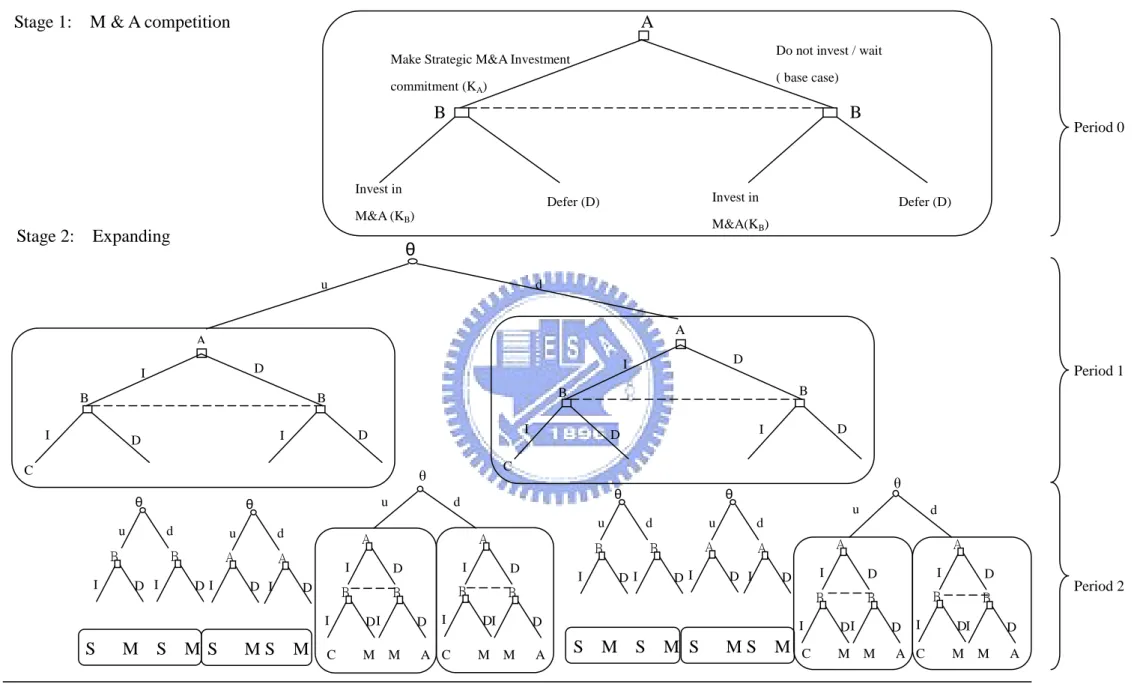
Figure 4.4 Shared Investment
Period 0
Period 1
Period 2
Stage 1: M & A competition
Stage 2: Expanding S M S M S M S M S M S M S M S M θ u d θ u d B I D B I D θ u d A I D A I D θ u d A I D A I D θ u d B I D B I D A B B
Make Strategic M&A Investment commitment (KA)
Do not invest / wait ( base case) Invest in M&A (KB) Invest in M&A(KB) Defer (D) Defer (D) C A I D I D D I B B C A I D I D D I B B u d A I D A I D B I D B I D B I D B I D C M M A C M M A C M M A C M M A θ A I D A I D B I D B I D B I D B I D u d θ
Notes: The combination of competitive decisions (A or B) and market demand moves (θ ) may result in one of the following market structure game outcomes: N: Cournot Nash price competitive equilibrium outcome; S: Stackelberg leder / follower outcome;
M: Monopolist outcome; A: Abandon (0); D: Defer / stay flexible (option value)
5. Case Studies
5.1 Competitive Strategy Measure
Foxconn and BYD are EMS providers who improve the technical design and provide post-sale service to the OEM industry. The type of competitive actions that belong to the cellphone EMS industry is price competition. In order to ascertain the relationship between Foxconn and BYD, we use the competitive strategy measure (CSM), which was provided by Sundarum et al. (1996). Their experiment pointed out the rule: When CSM is less than zero, it defines quantity competition, and when CSM is greater than zero, it defines price competition.
Since there are seasonal fluctuations in the EMS industry, we derive the quarterly change to compute the measure. Using 16 quarters of data on net income and net sales from 2003 to 2007, we obtained the CSM which is 0.463. Since it is greater than zero, it implies that the competitive action of Foxconn and BYD is price competition.
5.2 Parameters Estimation and Results
5.2.1 Market Demand Estimation and Nash Equilibrium Price Expression
According to both companies’ quarterly reports, we use 20 quarters of data on the quantity and average price of orders from 2003 to 2007 to develop a regression equation: The market demand function of Foxconn and BYD:
F( ,F B, F,t) F t, 528990 F 602799 B (5.1)
Q P P P P
where Q is the purchase orders quantity of mobile phones from Foxconn,F PFis the
order price of Foxconn, PBis the order price of BYD, and F,t is the market demand of Foxconn at period t. We consider that the date from quarterly reports can substitute for market demand, since EMS industry’ orders equal to its customers’ quantity
27
demand. In this regression equation, we obtained the series of F,tfrom 2003 to 2007,
and then we computed the volatility of market demand (F,t) which was 0.7633. Our following step is to deriveue t=2.145,d 1 0.466
u , and p d 0.326 u d rt e , where the average risk free rate was 4.06% during 2007.
5.2.2 Value of Growth Opportunities Estimation
According to the computed result above, we use the u and d to estimate the additional quantity (Qt,F) in each state, and then use the coefficient of regression equation to compute the Nash equilibrium price expression (Nash, Stackelberg Leader, Stackelberg Follower and Monopolist) in the second stage. Table 5.1 shows the competition price on the different market structure and different interaction actions. We take both companies’ total addition quantity (Qt,F,Qt,B) in the second stage, and multiply the price of four investment-timing scenarios to obtain the total additional cash flow (TCFt,F ,TCFt B, ), which was created by the order from LG’s mobile phones and the equilibrium price from Table 5.1.
Based on (4.12) and (4.16) where k = 16.74%, g =13.16% for Foxconn (23.36% and 19.07% for BYD), Figure 5.1 and 5.2 illustrate the valuation results for the proprietary investment and shared investment in both periods during the expansion stage. In Figure 5.1, if Foxconn invests 0.064 billion dollars (KA*), it has the option to capture the whole market share by taking legal action to delay BYD from entering market and merging LG’s component supplier in stage 1. It then has the choice to invest 1 billion dollars to expand its capacity by building an industrial park in northeast China or not in stage 2.
Monopolist value at the end (where P is monopolist price at period 1 and FM,1 c is F average cost) is F,1 ,1 ,1 1 ( ) 15021645(75.084-52.3) C 1000000000 8.55 ( ). 0.1674-0.1316 M F F F Q P c I billions k g
When demand is up (F,1uF,0), Foxconn can invest immediately (42.9 billion dollars) or defer the expanding investment for one period making the value of backward induction (
F,1 +
C ) 79.3 billion dollars. Thus, the expected equilibrium value is computed by using equation (4.17):
* 1 1 * F A (1 ) 0.326(79.3) 0.674(8.55) NPV = 0.064 30.2. 1 1.046 pC p C K r
Table 5.1 Nash equilibrium price expression
Action (A,B) Market Structure N/M/S/A/D Foxconn Equilibrium Price, PF BYD Equilibrium Price, PB
Period 2 upper Down upper down
(DI, DI) Nash price competition (N) 68.48 57.35 44.34 38.48
(DI, DD)
(DD,DI) Monopolist (M) 95 62.19 49.74 41.54
(II, DI) (DI,II)
Stackelberg price leader (SL) 83.44 62 47.29 39.6
(DI, II) (II,DI)
Stackelberg price follower (SF) 64.99 49.04 44.33 37.41
(DD,DD) Abandon (A)
Period 1
(I, I) Nash price competition (N) 61.04 40.54
(I, D) (D, I)
Stackelberg price leader (SL)/Monopolist (M)
75.08 62.68
(D, D) Defer (D)
In Figure 5.2, If Foxconn invests 12.8 million dollars (KA) and BYD invests 12.8 million dollars (KB) at same time, both of them obtain the option to choose whether to invest 1 billion dollar to expand its capacity by building industrial parkat
29
northeast China or not in stage 2. In the same way, when demand is up (F,1uF,0) and both companies defer (D, D) then market demand move down and both companies invest (I, I). The Cournot-Nash equilibrium value (N) at the end (where
N ,2 F
P is monopolist price at period 1 and c is average cost) is F
F,2 ,2 ,2 2 ( ) 32228000(68.481-52.3) 1000000000 13.5. 0.1674-0.1316 N F F F N Q P c C I k g
When demand is up in period 2, the resulting Cournot-Nash equilibrium value is 65.9. Thus, the expected equilibrium value is computed by using equation (4.17):
,2 ,2 ,1 (1 ) 0.326(65.9) 0.674(13.5) = 29.4. 1 1.046 N N F F D F pC p C C r
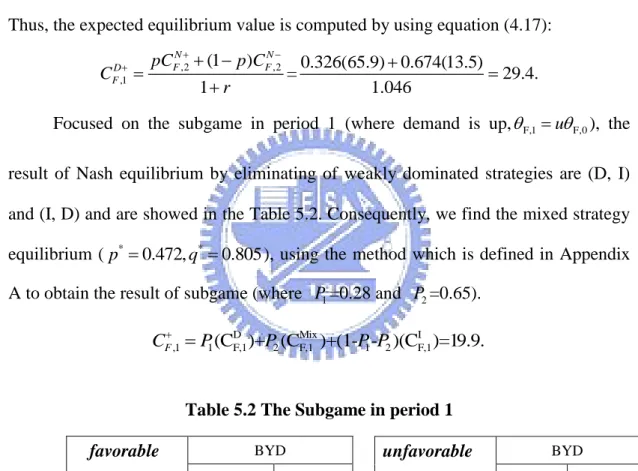
Focused on the subgame in period 1 (where demand is up,F,1uF,0), the result of Nash equilibrium by eliminating of weakly dominated strategies are (D, I) and (I, D) and are showed in the Table 5.2. Consequently, we find the mixed strategy equilibrium (p* 0.472,q*0.805), using the method which is defined in Appendix A to obtain the result of subgame (where P =0.28 and 1 P =0.65). 2
D Mix I
,1 1(C )+ (CF,1 2 F,1 )+(1- - )(C )=19.9.1 2 F,1 F
C P P P P
Table 5.2 The Subgame in period 1
favorable BYD
Invest Defer
Foxconn
Invest (15.8, 5.8) (58.5, 9.4) Defer (22.8, 12.6) (29.4, 9.4)
When demand is down (F,1 dF,0), the result of Nash Equilibrium by eliminating of weakly dominated strategies is (I, I), and the Cournot-Nash equilibrium value is 2.6. Thus, in the same ways, the expected equilibrium value is computed by using equation (4.17):
unfavorable BYD
Invest Defer
Foxconn Invest (2.6, 1.6) (2.9, 0.2) Defer (0, 1.7) (1.1, 1.1)
* 1 1 * F A (1 ) 0.326(19.92) 0.674(2.65) NPV = 0.018 7.9 1 1.046 pC p C K r .
5.2.3 Base Case NPV Estimation
In the beginning, if both companies choose not to take any strategies (proprietary or shared investment), they would keep their original business, obtaining the orders from international mobile phone corporations (i.e. Nokia and Motorola). After obtaining the result of the volatility (σ ), we compute the value of asset in place (Vi,j) which is made up by quantity (Qt,F) in each state and the price of Nash competition from Table 5.1. Then, the value of asset in place (Vi,j) at period i and state j can be calculated by using equation (4.13) to (4.15): 1 1 0 2 2 1 2 2 1 (1 ) 0.326(175) 0.674(11.8) 62.8 , 0, 0; 1 1.046 (1 ) 0.326(387) 0.674(84) 175 , 1, 0; 1 1.046 (1 ) 0.326(26.1) 0.674(5.68) 11.8 , 1 1.046 pV p V V i j r pV p V V i j r pV p V V i r i,j i,j i,j V V V 1, j 1;
5.3 Value Component
Now we would like to separate the different value components from the total value and to identify sign of the strategic effects. Generally, total value creation (expanded NPV) consists of the net present value (NPV) plus the value of the growth opportunities (PVGO). Furthermore, PVGO has two main effects on a company’s value compared to M&A strategy: (1) flexibility (2) strategic commitment effect. In the broader context of consolidating flexibility and strategic considerations of competitive interaction, expanded NPV becomes
Expanded (strategic) NPV = direct NPV + PVGO
= direct NPV + flexiblity (option) + strategic (game-theoretic) value .
31
first-stage M&A investment and Table 5.3 make summaries of value components for the strategic M&A investment for Foxconn.
Table 5.3
Value Components for the Strategic M&A Investment for Foxconn
Base Case (no M&A) Proprietary M&A (K*A=0.64) Shared M&A (KA=0.012) 1. Strategic reaction 0 -5.668 2.Strategic preemption 0 12.32 3.Strategic value (1+2-K) -0.64 6.62 4.Flexibility 0 30.9 1.28
5.Bace case (direct) NPV 62.8 62.8 62.8
Total Expanded NPV 62.8 93.06 70.75
(The detail record of computation, see Appendix B)
In the first-stage proprietary M&A investment, since Foxconn directly earns monopolist profit, it does not have any effect of strategic reaction and strategic preemption. In addition, Foxconn has an option to expand and can choose whether to make expansion investment in period 2. Thus, it has highly flexibility (30.9), and the expanded NPV of proprietary M&A investment is 93.08.
On the other hand, in the shared M&A investment, BYD may enter the market by merging another component factories; therefore Foxconn faces the reversal sign of the strategic reaction effect (-5.668) by offensive strategy of M&A investment under reciprocating competition. The expanded NPV of shared M&A investment is 70.75.
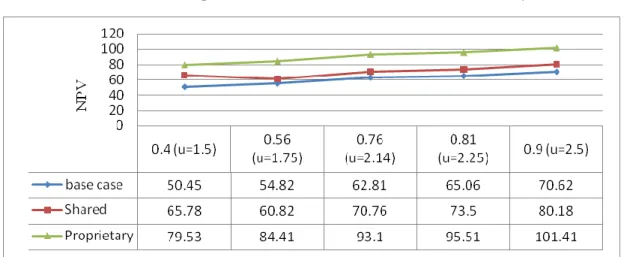
5.4 Scenario Analysis
In this part, we compare the NPV under different volatility in the following situations:
one is NPV with game theory and the other one is the NPV without game theory.
Figure 5.3 show the result of different NPV under different volatility. When market
game theory. If we do not consider the competitor’s responses, we will not change the
type of investment. In our case, Foxconn do not change its strategy when market
demand under high volatility. However, when the NPV of shared investment is
greater than the NPV of proprietary investment, Foxconn will change its investment
type. Therefore, NPV with game theory can examine how sensitive a particular NPV
when we use this framework in another case study.
Figure 5.3 NPV with Game Theory versus NPV without Game Theory
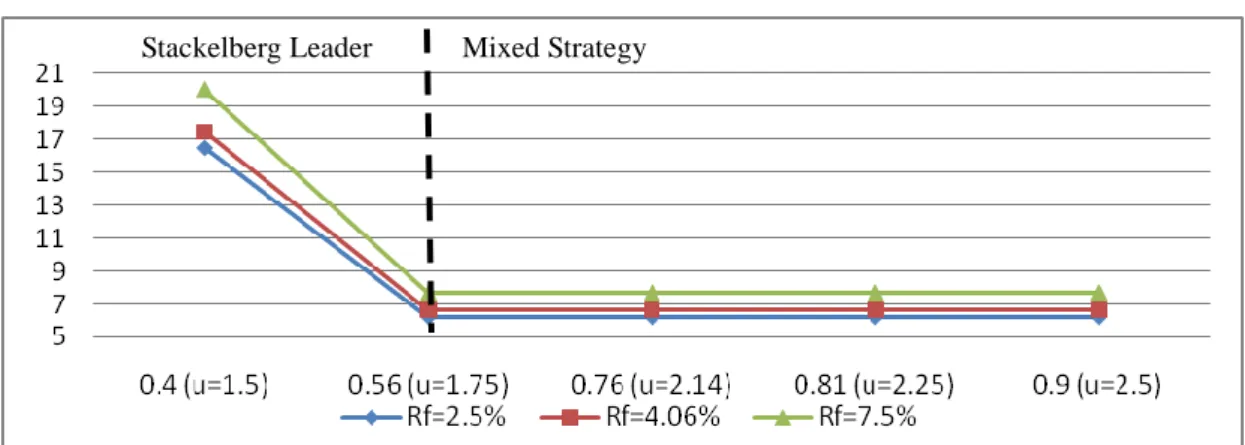
Afterwards, we set two variables which are risk-free rate and market demand (Rf
and t) to compare the value of base case and the difference expanded NPV, hoping
to describe the strategy value and the flexibility between the different investment
types under uncertainty by scenario analysis. Table 5.5, demonstrates the relationship
between risk-free rate and the flexibility; the higher risk-free rate is, the higher
expanded value and flexibility are (See Figure 5.4).
( volitility)