O R I G I N A L A R T I C L E – T R A N S L A T I O N A L R E S E A R C H A N D B I O M A R K E R S
Prognostic Significance of NBS1 and Snail Expression
in Esophageal Squamous Cell Carcinoma
Kuang-Tai Kuo, MD1,5, Teh-Ying Chou, MD3,5, Han-Shui Hsu, MD4,6, Wen-Liang Chen, PhD2,7, and Liang-Shun Wang, MD1,8
1Division of Thoracic Surgery, Department of Surgery, Shuang Ho Hospital, Taipei Medical University, Taipei, Taiwan; 2Translational Research Laboratory, Shuang Ho Hospital, Taipei Medical University, Taipei, Taiwan;3Department of
Pathology, Taipei Veterans General Hospital, Taipei, Taiwan;4Division of Thoracic Surgery, Department of Surgery, Taipei Veterans General Hospital, Taipei, Taiwan;5Institute of Clinical Medicine, National Yang-Ming University, Taipei, Taiwan;6Institute of Emergency and Critical Care Medicine, National Yang-Ming University, Taipei, Taiwan;
7Department of Biological Science and Technology, National Chiao Tung University, Hsinchu, Taiwan;8Graduate
Institute of Clinical Medicine, Taipei Medical University, Taipei, Taiwan
ABSTRACT
Background. Esophageal squamous cell carcinoma (ESCC) is a lethal malignancy, but only limited molecular markers can predict its prognosis. Recently, a DNA double-strand break repair protein Nijmegen breakage syndrome 1 (NBS1) was reported to induce Snail expression and pre-dict poor prognosis in head and neck cancers. However, the clinicopathologic roles of NBS1 and Snail in ESCC remain unclear.
Methods. From January 1995 to September 1999, tissue samples from 153 patients with ESCC who underwent esophagectomies at our institutions were collected and made into tissue core arrays for study. Expression of NBS1 and Snail was examined by immunohistochemical staining. The clinicopathologic data were analyzed, and some additional studies were performed to explore the relation-ship between NBS1 and Snail.
Results. NBS1 overexpression was observed in 28.1% (43/153) of ESCC, whereas Snail overexpression was observed in 26.1% (40/153) of ESCC. Overexpression of NBS1 correlated inversely with nodal status (P = 0.009) and was associated with better overall survival (P = 0.002). On the other hand, overexpression of Snail correlated positively with lymphovascular invasion
(P = 0.034) and was associated with worse overall sur-vival (P = 0.036). Meanwhile, NBS1 overexpression correlated inversely with Snail overexpression marginally (P = 0.084). Using the Cox regression analysis, T status (P = 0.006), M status (P = 0.008), and NBS1 overex-pression (P = 0.007) were the independent factors of overall survival.
Conclusions. Our results showed that NBS1 overexpres-sion was an independent factor of better survival and Snail overexpression predicted a worse survival in ESCC. Combination of NBS1 plus Snail expression status could be used as a predictor of prognosis in ESCC.
Esophageal cancer is one of the most aggressive human malignancies in the world and is currently responsible for *1,350 deaths per year in Taiwan.1 In recent years, administration of preoperative chemoradio-therapy for locally advanced esophageal cancers has become a standard treatment option, because it enabled more complete surgical resections and improved local regional control.2,3 However, the overall 5 year survival rate of esophageal cancer remains less than 20%.4 Because conventional therapies achieve limited improve-ment in outcomes, incorporation of targeted agents and the use of molecular predictors to tailor individualized treatment are valuable to break through the bottleneck in treating esophageal cancer.
Nijmegen breakage syndrome (NBS) is an autosomal recessive chromosomal instability syndrome, characterized by microcephaly, growth retardation, recurrent respiratory
Ó Society of Surgical Oncology 2011 First Received: 22 February 2011; Published Online: 1 September 2011 L.-S. Wang, MD
e-mail: [email protected] DOI 10.1245/s10434-011-2043-2
tract infections, immunodeficiency, and an increased risk for cancers.5,6 The chromosomal instability disorder is caused by germ-line mutations in the NBS1 gene situated on chromosome 8q21, encoding a protein called nibrin, also referred to as p95.7 NBS1 is a part of the MRE11/ RAD50/NBS1 (MRN) complex, which plays a central role in DNA double-strand break repair.8 Previously, it had been demonstrated that c-Myc directly activates NBS1 expression9and constitutive expression of NBS1 in Rat1a and HeLa cells induces/enhances their transformation.10 Recently, it was reported that increased NBS1 expression is a significant prognostic marker of advanced head and neck squamous cell carcinoma (HNSCC),11 and this may be linked to the finding that NBS1 overexpression induces epithelial-mesenchymal transition (EMT) through the up-regulation of Snail expression via the phosphatidylinositol 3-kinase (PI3 K)/Akt pathway in HNSCC.12
The zinc-finger transcriptional repressor Snail is one of the key regulators involved in EMT, which mediates invasiveness and metastasis of several human epithelial tumors.13,14 Snail induces EMT mainly by repressing E-cadherin transcription through binding to the E-box in the E-cadherin promoter.15 It also down-regulates other epi-thelial markers, such as claudin-1, occludin, desmoplakin, and cytokeratins, and up-regulates mesenchymal markers, including fibronectin and vimentin during EMT.16,17 Increased expression of Snail has been reported to be associated with poor prognosis in different types of cancers, including ESCC.18–21
Nevertheless, until now, there have been scarce reports studying the relationship between NBS1 and Snail in malignancies other than HNSCC. Meanwhile, the clinico-pathologic significance of NBS1 and Snail overexpression in ESCC needs further investigation. In the present study, we examined expression of NBS1 and Snail in 153 patients with resected ESCC by immunohistochemistry (IHC). The relationships between NBS1, Snail overexpression, and clinicopathologic parameters were analyzed. To elucidate the relationship between NBS1 and Snail, some additional studies were performed.
MATERIALS AND METHODS Patients
Approval for this retrospective study was obtained and the need for individual patient consent was waived by the Institutional Review Board. Radical en bloc esophagec-tomy was performed for every patient. Tumor parts of surgical specimens from 153 patients with ESCC who underwent esophagectomy at our institutions from January 1995 to September 1999 were collected for study. None of
these patients received neoadjuvant radiotherapy or che-motherapy, nor did they have distant organ metastasis in preoperative assessments. Stage of disease progression was classified according to the 6th edition American joint committee on cancer (AJCC) staging system. All stage IV patients in the present series were due to distant lymph node metastasis (M1a disease in U/3 and L/3 esophageal cancers; M1b disease in M/3 esophageal cancers). Post-operative adjuvant therapy was administered for the patients at stage IIB or beyond, or when tumor recurrence was noticed. The irradiation dose was 60 Gy (10 Gy/5 fractions/wk), and a combined chemotherapy regimen of choice consisted of cisplatin (20 mg/m2/day), 5-fluoroura-cil (600 mg/m2/day), and leucovorin (120 mg/m2/day) administered by 24 h infusion for 4 days. After treatment, all patients were followed up with systemic examinations of biochemical tests, chest radiography, sonogram of abdomen and neck, and whole body bone radioisotope scanning every 3–6 months. Computed tomography (CT) scan of chest and abdomen also was performed if indicated. Ten patients were lost to follow-up, and the follow-up rate was 93.5%.
Tissue Core Array
The method of construction of tissue core array has been previously described.22 Briefly, all of the pathological sections were reviewed by one pathologist (TYC), and cores of embedded tissue in demand were manually bored from the tissue blocks by a needle. The cores were placed in a warm cast containing melted paraffin wax and a marker for orientation was left. The positions of each core were recorded on reference sheets to facilitate data acquisition.
Immunohistochemical Staining
An immunoperoxidase procedure was used to detect the expressions of NBS1 and Snail in the pathological sec-tions.23 For further validation of the relationship between NBS1 and Snail, expression of phosphorylated Akt (pAkt) and E-cadherin were evaluated simultaneously. Briefly, the tissue arrays were cut into 4 lm sections. The sections were deparaffinized and incubated with 3% hydrogen peroxide to inactivate endogenous peroxides. Specific rabbit polyclonal anti-NBS1 antibody (NB100-143, Novus Biologicals, Littleton, CO) and specific rabbit polyclonal anti-Snail antibody (ab63371, Abcam, Cambridge, MA) were used at a dilution of 1:100 and incubated at 4°C overnight. Specific rabbit polyclonal anti-pAkt (Ser473) (No.4060, Cell Signaling, Danvers, MA) and specific rabbit polyclonal anti-E-cadherin antibody (No. 4065, Cell Sig-naling) were incubated at 4°C overnight with a dilation of
1:50 and 1:200, respectively. They were then washed and incubated with secondary antibody (DAKO, LSAB II kit, Carpinteria, CA). Finally, the sections were counterstained with hematoxylin.
Evaluation of NBS1, Snail, pAkt, and E-Cadherin Immunostaining
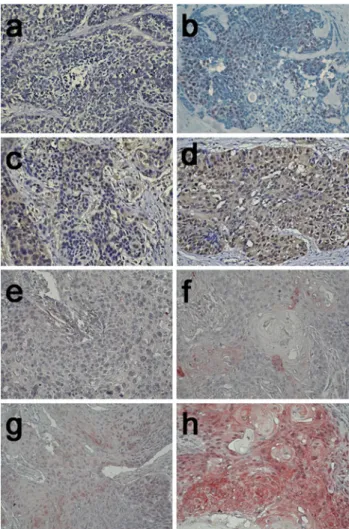
All immunostained tissue array sections were evaluated in a coded manner without knowledge of the clinical and pathological backgrounds of the patients. Each stained core was evaluated according to the gross percentage of cells demonstrating nuclear and cytoplasmic immunoreactivity on the tumor part, and the assessment was accomplished independently by two examiners (KTK and HSH). The scoring criteria for NBS1 had been applied previously11 and was shown as illustrated (Fig.1a–d): 0, no appreciable staining in cells; 1?, only nuclear staining and no detect-able cytoplasmic staining; 2?, apprecidetect-able nuclear staining with cytoplasmic staining in \25% of cells; 3?, significant nuclear staining and strong cytoplasmic staining ([25% of cells with cytoplasmic staining, which obscures cytoplasm and/or nucleus). Only 3? staining was defined as NBS1 overexpression or NBS1 (?). The scoring criteria for snail also had been applied before24and was shown as illustrated (Fig.1e–h): 0, no staining; 1?, 1–25% of nuclear staining; 2?, 26–50% of nuclear staining; 3?, [50% of nuclear staining and only 3? staining was considered as Snail overexpression or Snail (?). The scoring of pAkt was as follows: 0, no appreciable staining in tumor cells; 1?, barely detectable staining in cytoplasm and/or nucleus compared with stromal elements; 2?, readily appreciable brown staining distinctly marking tumor cell cytoplasm and/or nucleus; 3?, dark brown staining in tumor cells completely obscuring cytoplasm and/or nucleus. Levels 0 and 1? were grouped as nonexpression, and levels 2? and 3? were grouped as overexpression according to the published reports.11,25 Expression of E-cadherin was compared between cancer cells and normal epithelial cells located distant from the tumor. Cancer cells that stained as strongly as normal epithelial cells were considered to have preserved expression, whereas those that exhibited weaker staining patterns than normal epithelial cells or did not stain at all were considered to have reduced expression.26If there was discordance with immunohistochemistry scoring, a pathologic peer review will be done to consolidate the result into a final score.
Western Blot Analysis
IHC staining of NBS1 overexpression was confirmed by Western blot analysis in part of paired surgical specimens. Expression of corresponding Snail and pAkt also was
examined. Procedures for Western blot had been described previously22,27and 50 lg of protein extracts were loaded. The antibodies for NBS1, Snail, and pAkt were the same as those for immunohistochemistry and the dilution was 1:5000, 1:500, and 1:1000, respectively. Beta-actin (ab6276, Abcam, Cambridge, MA) was used as the protein loading control.
Clinicopathologic Variables and Statistical Analysis Age, sex, history of smoking or habitual alcohol con-sumption, differentiation of tumor, lymphovascular invasion, tumor location, length of tumor, depth of tumor invasion (‘‘T’’ status), status of lymph node metastasis
FIG. 1 Representative examples of NBS1 and Snail immunohisto-chemical stains. For NBS1: a 0, no appreciable staining in cells; b1?, only nuclear staining and no detectable cytoplasmic staining; c 2?, appreciable nuclear staining with cytoplasmic staining in \25% of cells; d 3?, significant nuclear staining and strong cytoplasmic staining ([25% of cells with cytoplasmic staining, which obscures cytoplasm and/or nucleus). Only d 3? staining was defined as NBS1 overexpression. For Snail: e 0, no staining; f 1?, 1–25% of nuclear staining; g 2?, 26–50% of nuclear staining; h 3?, [50% of nuclear staining. Only h 3? staining was considered as Snail overexpression. (original magnification 9200)
(‘‘N’’ status), status of distant metastasis (‘‘M’’ status), and tumor stage in the database were reviewed. The relation-ship between clinicopathologic factors and NBS1, Snail expression status was analyzed by v2 test (or two-tailed Fisher’s exact test when the expected number in any cell was less than 5 cases). The relationships between two variables were evaluated by Pearson correlation. Survival was plotted, and median survival was estimated by the Kaplan-Meier method. Survival and the strength of asso-ciations between categories within a variable were compared with the log-rank test. The variables with a P value \0.1 were entered into the multivariate analysis by using a Cox proportional hazards stepwise model. Statis-tical significance was defined as a probability value less than 0.05. All statistical analyses were performed with SPSS software version 12.0 (SPSS, Inc., Chicago, IL). Five variables were analyzed: T status, N status, M status, NBS1 expression, and Snail expression.
RESULTS
During the study period, 161 patients underwent esophagectomies. The surgical mortality rate was 5.2% (8 patients), and the causes of surgical mortality were all pulmonary complications. These eight patients were excluded from the study. Among the remaining 153 patients, there were 143 men and 10 women. The mean age was 64.7 (range, 36–85) years, and the median follow-up period was 25.2 (range, 2.3–136.4) months. The overall median survival time was 19.3 months, and the cumulative 5 year survival rate was 23.5%. The cumulative 5 year survival rate for N0 patients (n = 57) was 37.5% and for N1 patients (n = 96) was 14.1%.
Immunohistochemically, normal tissues may have moderate NBS1 nuclear staining but Snail staining was exclusively found in tumor cells. NBS1 overexpression was observed in 43 patients (28.1%), and Snail overex-pression was observed in 40 patients (26.1%). Reduced E-cadherin was found in 53 patients (34.6%), and over-expressed pAkt was found in 28 patients (18.3%).
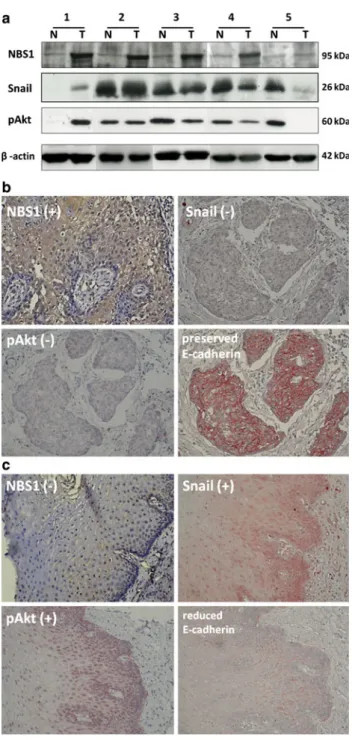
The overexpression of NBS1 in five pairs of surgical specimens was further confirmed by Western blot analysis. As shown in Fig.2a, NBS1 was indicated as a band around 95 kDa. The band was not exclusively present in tumorous tissues but also could be detected in nontumorous coun-terparts. The expression of pAkt and Snail in corresponding samples was shown. It revealed that NBS1 overexpression did not consequentially result in overexpression of pAkt or Snail.
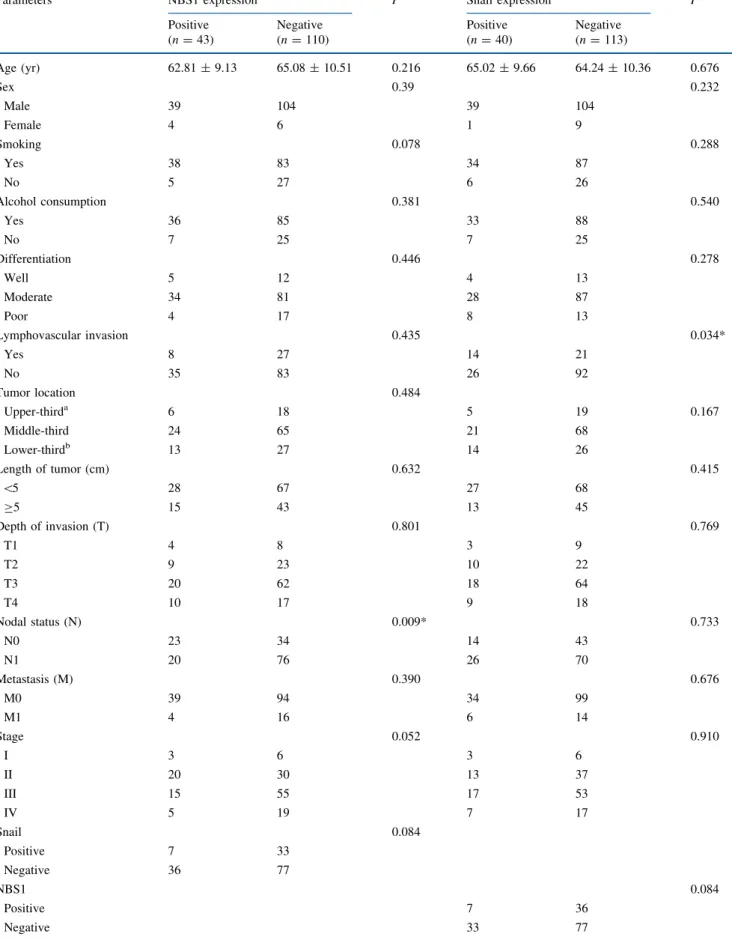
As shown in Table1, NBS1 overexpression correlated inversely with N status significantly (P = 0.009), and Snail overexpression correlated positively with lymphvascular
invasion significantly (P = 0.034). No significant differ-ence in other clinicopathologic variables was observed between tumors with and without NBS1 or Snail overex-pression. Meanwhile, NBS1 overexpression correlated inversely with Snail overexpression marginally (P = 0.084, correlation coefficient: -0.14). At the same time,
FIG. 2 aWestern blot of NBS1, Snail, and pAkt in tumorous (T) and nontumorous (N) tissue pairs from five representative patients with NBS1 overexpression in ESCC. b Representative patient with NBS1 (?), Snail (-), pAkt (-), and preserved E-cadherin is shown (original magnification 9200). c Representative patient with NBS1 (-), Snail (?), pAkt (?), and reduced E-cadherin is shown (original magnifi-cation 9200)
TABLE 1 Relationship between NBS1, Snail expression, and clinicopathologic parameters
Parameters NBS1 expression P Snail expression P Positive Negative Positive Negative
(n = 43) (n = 110) (n = 40) (n = 113) Age (yr) 62.81 ± 9.13 65.08 ± 10.51 0.216 65.02 ± 9.66 64.24 ± 10.36 0.676 Sex 0.39 0.232 Male 39 104 39 104 Female 4 6 1 9 Smoking 0.078 0.288 Yes 38 83 34 87 No 5 27 6 26 Alcohol consumption 0.381 0.540 Yes 36 85 33 88 No 7 25 7 25 Differentiation 0.446 0.278 Well 5 12 4 13 Moderate 34 81 28 87 Poor 4 17 8 13 Lymphovascular invasion 0.435 0.034* Yes 8 27 14 21 No 35 83 26 92 Tumor location 0.484 Upper-thirda 6 18 5 19 0.167 Middle-third 24 65 21 68 Lower-thirdb 13 27 14 26 Length of tumor (cm) 0.632 0.415 \5 28 67 27 68 C5 15 43 13 45 Depth of invasion (T) 0.801 0.769 T1 4 8 3 9 T2 9 23 10 22 T3 20 62 18 64 T4 10 17 9 18 Nodal status (N) 0.009* 0.733 N0 23 34 14 43 N1 20 76 26 70 Metastasis (M) 0.390 0.676 M0 39 94 34 99 M1 4 16 6 14 Stage 0.052 0.910 I 3 6 3 6 II 20 30 13 37 III 15 55 17 53 IV 5 19 7 17 Snail 0.084 Positive 7 33 Negative 36 77 NBS1 0.084 Positive 7 36 Negative 33 77
pAkt overexpression correlated inversely with NBS1 overexpression in a marginal significance (P = 0.073, correlation coefficient: -0.15) and correlated positively with Snail overexpression (P = 0.007, correlation coeffi-cient: 0.22). Meanwhile, reduced E-cadherin expres-sion correlated inversely with NBS1 overexpresexpres-sion (P = 0.009, correlation coefficient: -0.21) and correlated positively with Snail overexpression (P \ 0.001, correla-tion coefficient: 0.51). Representative pictures of a patient with NBS1 (?), Snail (-), pAkt (-), and preserved E-cadherin (Fig.2b) and another patient with NBS1 (-), Snail (?), pAkt (?), and reduced E-cadherin (Fig.2c) were illustrated.
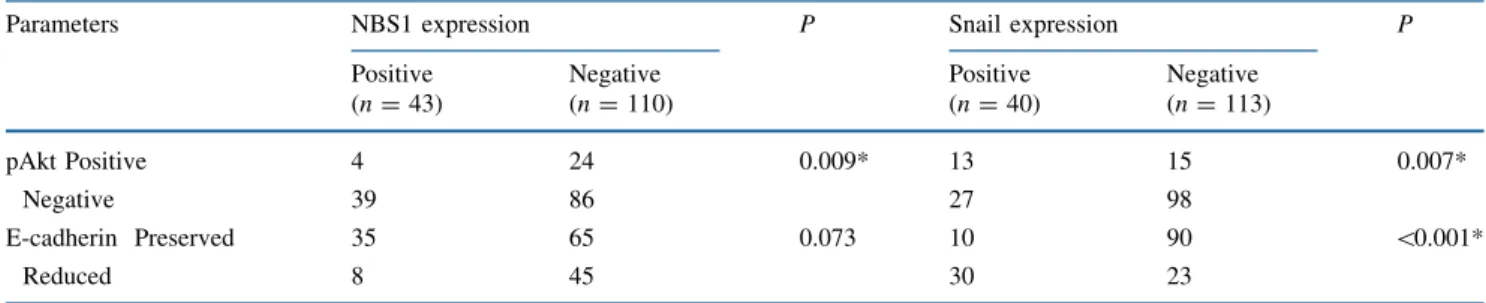
The overall survival was significantly different between patients with and without NBS1 overexpression (P = 0.002; Fig.3a). NBS1 overexpression was associated with better overall survival, with the 5 year survival rate 32.6% in NBS1 (?) patients and 16.2% in NBS1 (-) patients. On the other hand, the overall survival was also significantly different between patients with and without Snail overexpression (P = 0.036; Fig.3b), and Snail overexpression was associ-ated with worse overall survival. The 5 year survival rate
was 11.0% in Snail (?) patients and 24.3% in Snail (-) patients. When we divided all 153 patients into four sub-groups according to NBS1 and Snail expression status, namely NBS1 (?) and Snail (-) (n = 36), NBS1 (?) and Snail (?) (n = 7), NBS1 (-) and Snail (?) (n = 33), and NBS1 (-) and Snail (-) (n = 77), the NBS1 (-) and Snail (?) subgroup significantly had the worst prognosis (P = 0.002; Fig.3c). Interestingly, when we looked into the survival curves of Fig. 3c, we found that no matter in Snail (?) group (n = 40) or Snail (-) group (n = 113), NBS1 (?) was a significant indicator of better survival (P = 0.03 in both groups). However, Snail (?) was only significant in predicting the prognosis of NBS1 (-) group (n = 110; P = 0.032) but had no significant impact on NBS1 (?) group (n = 43; P = 0.986).
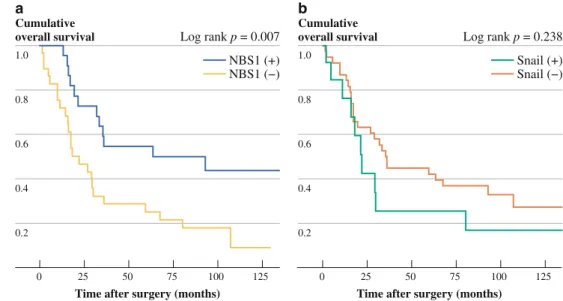
Furthermore, among the patients who did not receive postoperative adjuvant therapy, namely those with T1-3N0M0 status (n = 51), NBS1 overexpression was significantly associated with better survival (P = 0.007; Fig.4a), but Snail overexpression was not associated with survival significantly (P = 0.238; Fig.4b). Meanwhile, the median survival of NBS1 (?) patients was 63.5 months
1.0 0.8 0.6 0.4 0.2 NBS1 (+) NBS1 (−) 125 0
Time after surgery (months)
a
Cumulative
overall survival Log rank p = 0.002 1.0 0.8 0.6 0.4 0.2 Snail (+) Snail (−) 125 0
Time after surgery (months)
b
Cumulative
overall survival Log rank p = 0.036 1.0 0.8 0.6 0.4 0.2 NBS1 (+) & Snail (+) NBS1 (+) & Snail (−) NBS1 (−) & Snail (−) NBS1 (−) & Snail (+) 125 0
Time after surgery (months)
c
Cumulative
overall survival Log rank p = 0.002
25 50 75 100 25 50 75 100 25 50 75 100
FIG. 3 aThe 5 year overall survival rate in NBS1 (?) patients was 32.6% compared with 16.2% in NBS1 (-) patients (P = 0.002). b The 5 year overall survival rate in Snail (?) patients was 11%
compared with 24.3% in Snail (-) patients (P = 0.036). c NBS1 (-) and Snail (?) patients had a significantly worst prognosis than other subgroup of ESCC patients (P = 0.002)
TABLE 1continued
Parameters NBS1 expression P Snail expression P Positive Negative Positive Negative
(n = 43) (n = 110) (n = 40) (n = 113)
pAkt Positive 4 24 0.009* 13 15 0.007*
Negative 39 86 27 98
E-cadherin Preserved 35 65 0.073 10 90 \0.001*
Reduced 8 45 30 23
a Including one tumor over cervical esophagus b Including three tumors over esophagogastric junction
(n = 22) but was only 22.0 months in NBS1 (-) patients (n = 29).
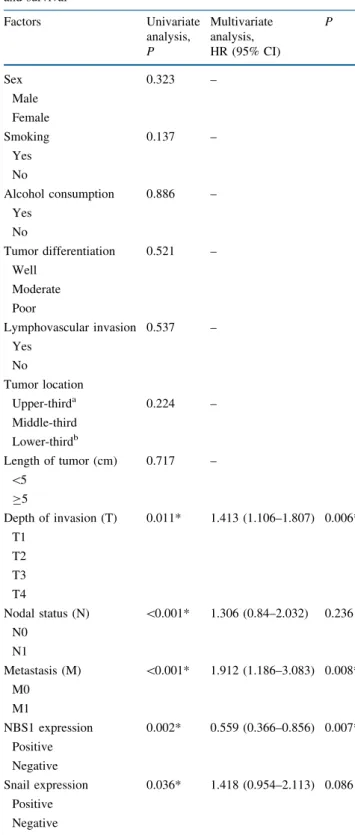
As shown in Table2, in the univariate analysis, T status (P = 0.011), N status (P \ 0.0001), M status (P \ 0.0001), NBS1 expression (P = 0.002), and Snail expression (P = 0.036) were significant predictors of overall survival. When we used the backward stepwise Wald method for multivariate analysis, T status (P = 0.006, hazard ratio: 1.413), M status (P = 0.008, hazard ratio: 1.912), and NBS1 expression (P = 0.007, hazard ratio: 0.559) were the inde-pendent factors of overall survival. However, Snail expression was not an independent factor (P = 0.086). Furthermore, when we narrowed the range to the patients with T1-3N0M0 status (n = 51), only NBS1 expression was the independent factor (P = 0.01; hazard ratio, 0.397) and neither Snail expression (P = 0.421) nor T status (P = 0.293) was a significant indicator.
DISCUSSION
This report investigated the prognostic role of NBS1 and Snail expression in ESCC patients who had esophagecto-mies. Our results showed that NBS1 overexpression was an independent factor of better overall survival, whereas Snail overexpression predicted a worse prognosis. Interest-ingly, the prognostic role of NBS1 overexpression in this report was quite different from those regarding NHSCC, oral squamous cell carcinoma (OSCC), or uveal mela-noma.11,12,28,29We considered that this discrepancy could be attributed to some possible causes. First, in our study, NBS1 overexpression correlated negatively with the N status sig-nificantly and may result in better survival. Second, NBS1 overexpression also correlated inversely with Snail overex-pression in a marginal significance (P = 0.084), and Snail overexpression was shown to be associated with worse
survival in this study. Third, the biological characteristics of ESCC and other tumors are not exactly the same, and NBS1 may have an inconsistent role in different types of tumors.
To elucidate the relationship between NBS1 and Snail, we examined the expression of pAkt and E-cadherin on the same tissue core arrays by immunohistochemistry. As shown in previous reports,11,12 overexpression of NBS1 correlated positively with phosphorylation of Akt and induced Snail overexpression in HNSCC. On the other hand, Snail overexpression conceptually results in reduced E-cadherin expression.15,17 Thus the NBS1/pAkt/Snail/ E-cadherin cascade has been well established in HNSCC. In the present study, however, we found that NBS1 overex-pression correlated inversely with both pAkt overexoverex-pression (P = 0.073) and reduced E-cadherin expression (P = 0.009). Meanwhile, Snail overexpression correlated posi-tively with both pAkt overexpression (P = 0.007) and reduced E-cadherin expression (P \ 0.001). These data not only gave support to the inverse relationship between NBS1 overexpression and Snail overexpression but also suggested that perhaps the NBS1/pAkt/Snail/E-cadherin cascade found in HNSCC does not exist in ESCC. Nevertheless, the detailed mechanisms were not clear and further investiga-tions are warranted.
In fact, the prognostic role of NBS1 in cancers was still debated. It has been reported that strong expression of NBS1 was related to earlier tumor stage and favorable survival in colorectal cancer.30In patients with early breast cancer, intact MRE11/RAD50/NBS1 (MRN) complex was reported to predict good response to radiotherapy due to its importance in tumor cell eradicating effect of radiotherapy. In the same study, patients with tumors that expressed stronger NBS1 also had significantly fewer local recur-rences and better recurrence-free survival.31 Our current report showed that NBS1 overexpression correlated with
1.0 0.8 0.6 0.4 0.2 NBS1 (+) NBS1 (−) 125 0
Time after surgery (months)
a
Cumulative
overall survival Log rank p = 0.007
1.0 0.8 0.6 0.4 0.2 125 0
Time after surgery (months)
b
Cumulative
overall survival Log rank p = 0.238
25 50 75 100 25 50 75 100
Snail (+) Snail (−)
FIG. 4 Survival curves of patients who did not receive postoperative adjuvant therapy (T1-3N0M0 status, stage I and IIA, n = 51): a with or without NBS1 overexpression
(P = 0.007); b with or without Snail overexpression
earlier tumor stage (P = 0.052) and better survival. In our opinion, this should be largely caused by the finding that NBS1 overexpression correlated inversely with the N status
and Snail overexpression. Nevertheless, further studies to clarify the mechanistic details are needed.
Previously, we have shown that overexpression of PGE2 receptor EP2 was associated with worse survival in ESCC patients with T1-3N0M0 status.22In the present study, we demonstrated that NBS1 overexpression was associated with better survival in patients with T1-3N0M0 status and was the only independent factor of overall survival among these patients. Although NBS1 overexpression was not indicating a worse prognosis, the clinical significance of this finding is still important. From our current data, patients without NBS1 overexpression are at risk of a worse prognosis and postoperative adjuvant therapy may be applied earlier to achieve better outcomes.
In conclusion, our results showed that NBS1 was over-expressed in 28.1% of ESCC specimens and Snail was overexpressed in 26.1%. NBS1 overexpression was sig-nificantly associated with better overall survival and correlated inversely with the N status in ESCC. Instead, Snail overexpression was significantly associated with worse overall survival and correlated positively with lym-phovascular invasion in ESCC. NBS1 overexpression tends to have an inverse relationship with Snail overexpression in ESCC, and this was supported by additional immunohis-tochemistry studies of pAkt and E-cadherin. Patients without NBS1 overexpression but with Snail overexpres-sion had the worst prognosis. Among the patients with T1-3N0M0 status, NBS1 overexpression was the only independent factor of overall survival. These findings suggested that combination of NBS1 plus Snail expression status could be used as a good predictor of prognosis in ESCC and NBS1 alone may be applied as a reference for adjuvant treatment in selective ESCC patients.
ACKNOWLEDGMENT This study was supported by grants from National Science Council (NSC95-2314-B-303-023) and Tzu Chi Foundation Medicine Mission (TCRD-I9603-03). The authors also thank Professor Kou-Juey Wu and Professor Muh-Hwa Yang in National Yang-Ming University for their expert opinions on initial preparation of this study and Dr. Hao-Wei Wang at Cornell Univer-sity for his critical review of the manuscript.
REFERENCES
1. Department of Health, the Executive Yuan, Republic of China. Statistics of Causes of Death and Cancer Registry Annual Report in Taiwan area, 2010.
2. Law S, Kwong DL, Kwok KF, et al. Improvement in treatment results and long-term survival of patients with esophageal cancer: impact of chemoradiation and change in treatment strategy. Ann Surg. 2003;238:339–47.
3. Berger AC, Farma J, Scott WJ, et al. Complete response to neoadjuvant chemoradiotherapy in esophageal carcinoma is associated with significantly improved survival. J Clin Oncol. 2005;23:4330–7.
4. Jemal A, Siegel R, Xu J, Ward E. Cancer statistics, 2010. CA Cancer J Clin. 2010;60:277–300.
TABLE 2 Relationship between clinicopathologic characteristics and survival Factors Univariate analysis, Multivariate analysis, P P HR (95% CI) Sex 0.323 – Male Female Smoking 0.137 – Yes No Alcohol consumption 0.886 – Yes No Tumor differentiation 0.521 – Well Moderate Poor Lymphovascular invasion 0.537 – Yes No Tumor location Upper-thirda 0.224 – Middle-third Lower-thirdb Length of tumor (cm) 0.717 – \5 C5 Depth of invasion (T) 0.011* 1.413 (1.106–1.807) 0.006* T1 T2 T3 T4 Nodal status (N) \0.001* 1.306 (0.84–2.032) 0.236 N0 N1 Metastasis (M) \0.001* 1.912 (1.186–3.083) 0.008* M0 M1 NBS1 expression 0.002* 0.559 (0.366–0.856) 0.007* Positive Negative Snail expression 0.036* 1.418 (0.954–2.113) 0.086 Positive Negative
5. Chrzanowska KH, Kleijer WJ, Krajewska-Walasek M, et al. Eleven Polish patients with microcephaly, immunodeficiency, and chromosomal instability: the Nijmegen breakage syndrome. Am J Med Genet. 1995;57:462–71.
6. van der Burgt I, Chrzanowska KH, Smeets D, Weemaes C. Nij-megen breakage syndrome. J Med Genet. 1996;33:153–6. 7. Varon R, Vissinga C, Platzer M, et al. Nibrin, a novel DNA
double-strand break repair protein, is mutated in Nijmegen breakage syndrome. Cell. 1998;93:467–76.
8. D’Amours D, Jackson SP. The Mre11 complex: at the crossroads of DNA repair and checkpoint signaling. Nat Rev Mol Cell Biol. 2002;3:317–27.
9. Chiang YC, Teng SC, Su YN, et al. c-Myc directly regulates the transcription of the NBS1 gene involved in DNA double-strand break repair. J Biol Chem. 2003;278:19286–91.
10. Chen YC, Su YN, Chou PC, et al. Overexpression of NBS1 contributes to transformation through the activation of phospha-tidylinositol 3-kinase/Akt. J Biol Chem. 2005;280:32505–11. 11. Yang MH, Chiang WC, Chou TY, et al. Increased NBS1
expression is a marker of aggressive head and neck cancer and overexpression of NBS1 contributes to transformation. Clin Cancer Res. 2006;12:507–15.
12. Yang MH, Chang SY, Chiou SH, et al. Overexpression of NBS1 induces epithelial-mesenchymal transition and co-expression of NBS1 and Snail predicts metastasis of head and neck cancer. Oncogene. 2007;26:1459–67.
13. Gupta GP, Massague´ J. Cancer metastasis: building a framework. Cell 2006;127:679–95.
14. Thiery JP. Epithelial-mesenchymal transitions in tumour pro-gression. Nat Rev Cancer. 2002;2:442–54.
15. Batlle E, Sancho E, Francı´ C, et al. The transcription factor snail is a repressor of E-cadherin gene expression in epithelial tumour cells. Nat Cell Biol. 2000;2:84–9.
16. Ohkubo T, Ozawa M. The transcription factor Snail downregu-lates the tight junction components independently of E-cadherin downregulation. J Cell Sci. 2004;117:1675–85.
17. Cano A, Perez-Moreno MA, Rodrigo I, et al. The transcription factor snail controls epithelial-mesenchymal transitions by repressing E-cadherin expression. Nat Cell Biol. 2000;2:76–83. 18. Martin TA, Goyal A, Watkins G, Jiang WG. Expression of the
transcription factors snail, slug, and twist and their clinical signif-icance in human breast cancer. Ann Surg Oncol. 2005;12:488–96. 19. Elloul S, Elstrand MB, Nesland JM, et al. Snail, Slug, and Smad-interacting protein 1 as novel parameters of disease aggressiveness
in metastatic ovarian and breast carcinoma. Cancer. 2005;103: 1631–43.
20. Miyoshi A, Kitajima Y, Kido S, et al. Snail accelerates cancer invasion by upregulating MMP expression and is associated with poor prognosis of hepatocellular carcinoma. Br J Cancer. 2005; 92:252–8.
21. Natsugoe S, Uchikado Y, Okumura H, et al. Snail plays a key role in E-cadherin-preserved esophageal squamous cell carcinoma. Oncol Rep. 2007;17:517–23.
22. Kuo KT, Wang HW, Chou TY, et al. Prognostic Role of PGE2 Receptor EP2 in Esophageal Squamous Cell Carcinoma. Ann Surg Oncol. 2009;16:352–60.
23. Wang LS, Chow KC, Wu CW. Expression and up-regulation of interleukin-6 in oesophageal carcinoma cells by n-sodium buty-rate. Br J Cancer. 1999;80:1617–22.
24. Hung JJ, Yang MH, Hsu HS, Hsu WH, Liu JS, Wu KJ. Prognostic significance of hypoxia-inducible factor-1a, TWIST1 and Snail expression in resectable non-small cell lung cancer. Thorax. 2009; 64:1082–9.
25. David O, Jett J, LeBeau H, et al. Phospho-Akt overexpression in non-small cell lung cancer confers significant stage-independent survival disadvantage. Clin Cancer Res. 2004;10:6865–71. 26. Uchikado Y, Natsugoe S, Okumura H, et al. Slug Expression in
the E-cadherin preserved tumors is related to prognosis in patients with esophageal squamous cell carcinoma. Clin Cancer Res. 2005;11:1174–80.
27. Wang YF, Chow KC, Chang SY, Chiu JH, Tai SK, Li WY, Wang LS. Prognostic significance of nm23-H1 expression in oral squamous cell carcinoma. Br J Cancer. 2004;90:2186–93. 28. Hsu DS, Chang SY, Liu CJ, et al. Identification of increased
NBS1 expression as a prognostic marker of squamous cell car-cinoma of the oral cavity. Cancer Sci. 2010;101:1029–37. 29. Ehlers JP, Harbour JW. NBS1 expression as a prognostic marker
in uveal melanoma. Clin Cancer Res. 2005;11:1849–53. 30. Gao J, Zhang H, Arbman G, Sun XF. RAD50/MRE11/NBS1
proteins in relation to tumour development and prognosis in patients with microsatellite stable colorectal cancer. Histol His-topathol. 2008;23:1495–502.
31. So¨derlund K, Sta˚l O, Skoog L, Rutqvist LE, Nordenskjo¨ld B, Askmalm MS. Intact Mre11/Rad50/Nbs1 complex predicts good response to radiotherapy in early breast cancer. Int J Radiat Oncol Biol Phys. 2007;68:50–8.