國 立 交 通 大 學
資 訊 科 學 與 工 程 研 究 所
碩 士 論 文
敲鍵行為統計學習模型應用於網路身份認
證
Keystroke Statistical Learning Model for Web
Authentication
研 究 生:江檉皇
指導教授:謝續平 博士
敲鍵行為統計學習模型應用於網路身份認證
Keystroke Statistical Learning Model for Web
Authentication
研 究 生: 江檉皇 Student: Cheng-Huang Jiang
指導教授: 謝續平 博士 Advisor: Dr. Shiuh-Pyng Shieh
國 立 交 通 大 學
資 訊 科 學 與 工 程 研 究 所
碩 士 論 文
A Thesis
Submitted to
Department of Computer Science and Information Engineering
College of Electrical Engineering and Computer Science
National Chiao Tung University
In Partial Fulfillment of the Requirements
For the Degree of
Master
In
Computer Science and Information Engineering
June 2006
Hsinchu, Taiwan, Republic of China
敲鍵行為統計學習模型應用於網路身份認證
研究生:江檉皇 指導教授:謝續平
國立交通大學 資訊科學與工程研究所
摘 要
傳統網路身份認證機制單純依靠檢查帳號和密碼的正確性,已經不足以應付 急速發展的網路應用和快速成長的電子商務,如果發生使用者的帳號和密碼被他 人竊取使用的情況,傳統網路身份認證機制將無法正確辨識出登入者的真實身 份。敲鍵行為特徵分析屬於生物身份辨識科技的一種,具備低成本和透明性,相 當適合用來搭配或取代傳統網路身份認證機制。本篇論文提出結合統計學習理論 中的隱藏式馬可夫模型和高斯機率模型,來建立敲鍵行為特徵的統計機率模型, 利用此統計機率模型來分析使用者登入帳號和密碼的敲鍵時間資訊,藉此提高登 入者真實身份認證的準確性。實驗結果顯示,帳號和密碼的長度如果限制大於或 等於九的話,本篇論文所提出的方法可以將錯誤率降低到 2.54 %。Keystroke Statistical Learning Model for Web
Authentication
Student: Cheng-Huang Jiang Advisor: Shiuh-Pyng Shieh
Department of Computer Science and Information Engineering
National Chiao Tung University
Abstract
As the rapid evolution of E-commerce, traditional password authentication mechanism is insufficient to provide strong security and reliability for identity
verification of web-based applications. Under the circumstance that the intruder could make use of the username and password stolen from the innocent individual,
conventional password authentication mechanisms are incapable to distinguish the discrepancy between the intruder and the innocent individual. Keystroke typing
characteristics is one of the most novel and creative biometric techniques. The low-cost and transparency of keystroke typing characteristics make it appropriate to
complement, but not to replace traditional password authentication mechanism used by web-based applications.
In this thesis, we proposed a statistical model for keystroke typing characteristics based on Hidden Markov Model and Gaussian Modeling from Statistical Learning
Theory. The accuracy of the identity authentication can be substantially enhanced by analyzing keystroke timing information of the username and password using our
proposed model. The results of the experiment showed that, with the condition on both the minimum length of the username and password restricted to be greater than
誌 謝
完成這篇論文,除了讓我學到研究的方法,也讓我得到很多的第一次,不管 是好是壞,都讓我的人生得到了相當多的經驗。謝謝我的家人,在我陷入低潮的 時候給我一個可以依靠的避風港,一直給我鼓勵和支持。謝謝丫丫在這段時間一 直陪著我,讓我有動力完成論文。謝謝老師給我再一次的機會完成這篇論文。謝 謝我的好朋友們的鼓勵和幫忙。謝謝網路上的匿名者們在實驗時提供的樣本。 謝謝大家,我要畢業了,喔耶!Table of Contents
1. INTRODUCTION...1 1.1. Background...1 1.2. Contribution ...3 1.3. Synopsis ...3 2. RELATED WORK...5 2.1. Features...5 2.2. Performance Measures...52.3. Fixed-text Keystroke Analysis...7
2.4. Free-text Keystroke Analysis...11
2.5. Summary ...13
3. MODELING AND METHODOLOGY...16
3.1. Features...16
3.2. Gaussian Modeling ...17
3.3. Maximum Likelihood Estimation of the Parameters ...18
3.4. Hidden Markov Model...18
3.5. Forward Algorithm...22
3.6. General Modules for Keystroke Analysis...23
3.7. Scheme and Measures...28
4. EXPERIMENTS AND RESULTS...31
4.1. Experiment Setting...31
4.2. Data Collection ...31
4.3. Evaluation ...32
5. CONCLUSIONS...41
List of Figures
FIGURE 2.1:EER IS THE CROSS POINT AT WHICH THE FRR AND FAR ARE EQUAL. ...6
FIGURE 3.1:THE HIDDEN MARKOV MODEL FOR KEYSTROKE ANALYSIS. ...19
FIGURE 3.2:GRAPHICAL MODE FOR DIGRAPH WITH KEYSTROKE SEQUENCE “BANANA”...20
FIGURE 3.3:FLOW CHART FOR PROFILE BUILDING MODULE...25
FIGURE 3.4:FLOW CHART FOR AUTHENTICATION MODULE...26
FIGURE 3.5:FLOW CHART FOR IDENTIFICATION MODULE...28
FIGURE 3.5:FLOW CHART OF TRAINING PHASE FOR FIXED-TEXT KEYSTROKE ANALYSIS...29
FIGURE 3.6:FLOW CHART OF RECOGNITION PHASE FOR FIXED-TEXT KEYSTROKE ANALYSIS...30
FIGURE 4.1:TARGET STRING LENGTH DISTRIBUTION OF REFERENCE SAMPLES...32
FIGURE 4.2:O-STRATEGY -MINIMUM TARGET STRING LENGTH =9, REFERENCE SAMPLE SIZE =5...33
FIGURE 4.3:O-STRATEGY -MINIMUM TARGET STRING LENGTH =9, REFERENCE SAMPLE SIZE =10,EER= 5.71% ...33
FIGURE 4.4:O-STRATEGY -MINIMUM TARGET STRING LENGTH =9, REFERENCE SAMPLE SIZE =15,EER= 5.24% ...34
FIGURE 4.5:O-STRATEGY -MINIMUM TARGET STRING LENGTH =9, REFERENCE SAMPLE SIZE =20,EER= 4.76% ...35
FIGURE 4.6:A-STRATEGY -MINIMUM TARGET STRING LENGTH =9, REFERENCE SAMPLE SIZE =5,EER= 6.19% ...35
FIGURE 4.7:A-STRATEGY -MINIMUM TARGET STRING LENGTH =9, REFERENCE SAMPLE SIZE =10,EER =3.81%...36
FIGURE 4.8:A-STRATEGY -MINIMUM TARGET STRING LENGTH =9, REFERENCE SAMPLE SIZE =15,EER =2.91%...36
FIGURE 4.9:A-STRATEGY -MINIMUM TARGET STRING LENGTH =9, REFERENCE SAMPLE SIZE =20,EER =2.54%...37
FIGURE 4.10:O-STRATEGY –EER VS.MINIMUM TARGET STRING LENGTH...38
FIGURE 4.11:A-STRATEGY –EER VS.MINIMUM TARGET STRING LENGTH...38
FIGURE 4.12:O-STRATEGY:FRR WITH DIFFERENT NUMBER OF REFERENCE SAMPLES...39
FIGURE 4.13:O-STRATEGY:FAR WITH DIFFERENT NUMBER OF REFERENCE SAMPLES...39
FIGURE 4.14:A-STRATEGY:FRR WITH DIFFERENT NUMBER OF REFERENCE SAMPLES...40
1. Introduction
1.1. Background
As the web interface becoming more powerful and convenient, the trend has
been shown that more and more applications are developed for web-based services instead of for local use only. Web-based services change the way people
using computer, and makes it more easily for people to globally and ubiquitously acquire information and resources. Unfortunately, it also makes more chances for
malicious attack and intrusion to be happened. As a consequence, guarantee the accuracy of the user identity for web-based services has became a significant
issue.
Conventionally web-based services employ username/password pairs to
authenticate the identities of the users. After the users pass the authentication phase, the systems assume the identities of the users are consistent and rarely use
other mechanism to constantly assure the identities of the users. This comes up with two acute security issues. First one is at the authentication phase. An
attacker can steal the username/password pair by any means from the user, say Alice, log on to the web-based services by claiming to be Alice, and gain access
to the web-based service as Alice. Second one is after the authentication phase has been legally passed by Alice. An attacker can access the web-based services
and act as Alice when she is temporarily leaving the computer without log out the systems or close the browser. Hence we need another security mechanism to
complement or serve as a robust safeguard to prevent legal users from being impersonated and unauthorized.
keyboard typing rhythms, is one of the most novel and creative biometric techniques. There are two types of biometrics: physiological biometrics and
behavioral metrics. Physiological biometrics requires user to provide a given physical characteristic in different positions and/or conditions, but always the
same characteristic, such as fingerprint, facial recognition, hand geometry, iris scan, retinal scan, vascular patterns and DNA. Most of them require expensive
hardware to support the dedicated function. As a result, they are impractical and inefficient to combine with the authentication mechanism of the web-based
services. Behavioral biometrics requires user to behave in a consistent manner, including speaker recognition, keystroke dynamics, hand-writing and mouse
movement. Keystroke dynamics has following advantages over others:
♦ It is non-intrusive, since user will be typing at the keyboard anyway. ♦ It is transparent, since keystroke patterns can be captured silently
without interrupting user’s normal activity.
♦ It is low-cost, since the hardware requirement is only the keyboard which is already presented, and the analysis can be conducted and
implemented by software.
Keyboard dynamics has the disadvantage of instability inherited from behavioral
biometrics while the people may behave differently and be influenced by the environment, physiology status or different keyboards. Other than that, keystroke
dynamics is considered to be an economical and practical measure to be in conjunction with, or in place of traditional authentication method of web-based
services.
Keystroke dynamics is based on the assumption that different people have
unique habitual rhythm patterns in the way they type. Previous work ([19, 11]) has been shown that keystroke dynamics is good evidence of identity. Within the
keystroke dynamics literatures, the research can be divided into two categories: fixed-text keystroke analysis and free-text keystroke analysis, according to the
structures of the typing patterns to be analyzed. In the fixed-text keystroke analysis, the patterns are short, fixed and structured, such as login-password pairs
at the authentication phase or the pass-phrase predetermined by the authentication system. The methods [2, 3, 4, 6, 9, 19] proposed for fixed-text
keystroke analyses are usually encouraged to integrated with or replace of traditional web-based authentication method. As to the free-text keystroke
analysis, the patterns are diverse and long. They can be collections of keystrokes from an email sending by an employee or anything a user typed in any period of
time. Free-text keystroke analyses [1, 11, 15, 16] are suitable for continuously identity verification after the authentication phase has passed.
1.2. Contribution
In this thesis, we present a formal statistical model for keystroke dynamics
analysis using Hidden Markov Model and Gaussian Modeling. Underlying the proposed model and the schemes for fixed-text keystroke analysis can be applied
to web-based services as authentication mechanism for enhancing security strength according to different security requirements. The proposed model can be
extended to devise scheme for free-text keystroke analysis. The experiment of our scheme for authentication resulted on 2.54 % of Equal Error Rate, which is
the best so far in the literature.
1.3. Synopsis
This thesis is organized as follows. The related work of keystroke dynamics is presented in Chapter 2. In Chapter 3, formal model along with schemes for
results are given in Chapter 4. Finally, a conclusion and future work is given in Chapter 5.
2. Related Work
In this chapter, we first review the features used to analyze by keystroke dynamics in Section 2.1, and the performance measurements for keystroke
dynamics evaluation are presented in Section 2.2. Furthermore, we review the literature with regard to fixed-text keystroke analysis in Section 2.3. We present
a review for free-text keystroke analysis in Section 2.4.
2.1. Features
There are several measurements can be used by keystroke dynamics analysis when the user press the keys on the keyboard. The possible measurements can be
listed as follows:
♦ Keystroke duration: The time a key stays pressed.
♦ Keystroke latency: The time interval between two consecutive keystrokes (also referred to as digraph). It can be extended to N
consecutive keystrokes (also referred to as n-graph).
♦ Keystroke frequency: the number of times the keystroke appeared. First two of the list above is the most popular features used in the literature. The mean and standard deviation of the keystroke duration or latencies are the basis
measurement to combine with other techniques for timing characteristics analysis.
2.2. Performance Measures
Typically biometric performance has three metrics for describing performance in
terms of decision rates with regard to accuracy [21]:
♦ False Reject Rate (FRR): The expected portion of valid user attempts identified as imposters. A false rejection is also referred to as a “Type
I” Error in mathematical literature, or false alarm rate (FAR). The higher the FRR is, the lower the feasibility and convenience the
systems will perform.
♦ False Accept Rate (FAR): The expected portion of imposter attempts identified as valid users. A false acceptance is also referred to as a “Type II” error in mathematical literature, or imposter pass rate (IPR).
The higher the FAR is, the more opportunities the systems give the imposters to breach in.
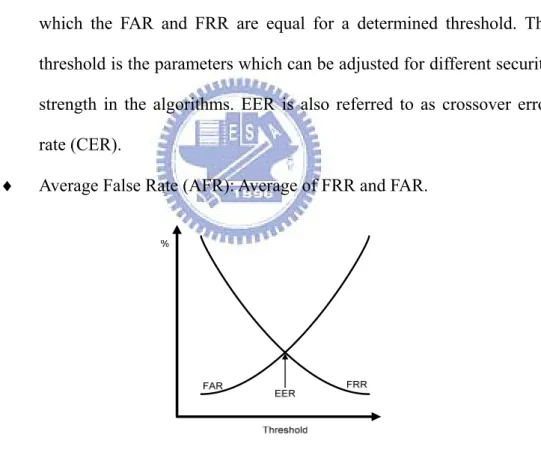
♦ Equal Error Rate (EER): In Figure 2.1, the value of the cross point at which the FAR and FRR are equal for a determined threshold. The
threshold is the parameters which can be adjusted for different security strength in the algorithms. EER is also referred to as crossover error
rate (CER).
♦ Average False Rate (AFR): Average of FRR and FAR.
Figure 2.1: EER is the cross point at which the FRR and FAR are equal.
In most of the literature, the terms false reject rate and false accept rate are used interchangeably with false alarm rate and imposter pass rate. For the sake of
clarity, in this thesis we will use FRR to denote the false reject rate, FAR to denote the false accept rate, and ERR to denote the equal error rate respectively.
2.3. Fixed-text Keystroke Analysis
In the keystroke dynamics literature with regard to fixed-text keystroke analysis,
the typing patterns to be analyzed are short, fixed, predetermined, and structured. The research can be separated into two portions based on the concerns the
approaches presented. One portion puts their focuses on designing approaches which can be in conjunction with, or in place of traditional authentication
mechanism by analyzing the keystroke timing information of username/password pairs typed by individuals. The other portion tries to figure out how to identify
the user’s identity from keystroke timing information of predetermined texts typed by individuals for certain times. In the Section 2.3.1, we introduce the
algorithms for keystroke timing information analysis of login-password. In the Section 2.3.2, the review of the keystroke analysis methods for predetermined
text is presented.
2.3.1. Traditional login-password Authentication Mechanism
Joyce and Gupta [19] proposed a simple and promising approach to analyze four target strings (login, password, first name, last name) during a login process.
Their system requires new users to type the reference signatures in term of four target strings for eight times. The mean reference signature is then given by:
{
Musername Mpassword Mfirstname Mlastname}
M = , , ,
At the authentication phase, a test signature is presented and compares with reference signature
T
M to determine the magnitude of the difference between M and T . Let M =
(
m1,m2,K,mn)
and T =(
t1,t2,K,tn)
where n is thetotal number of latencies in the signature, the verifier computes the magnitude of the difference between M andT as the norm: l1
∑
= = − = − i n i i i t m T M 1 1Then a suitable threshold for an acceptable size of the magnitude is chosen for each user based on a measure of the variability of user's signatures. The mean
and standard deviation of the norms M −Si , where is one of the training signatures, are used to decide a threshold for an acceptable norm value of the latency difference vector between a given
i
S
M and T . If this norm is less than
the threshold for the user, the attempt is accepted. Otherwise it is flagged as an imposter attempt. Thirty-three users were participated in the evaluation. 13.3%
(4 out of 30) FRR and 0.17% (1 out of 600) FAR were obtained. EER is not available because they did not conduct the experiment for every possible
threshold values.
Magalhaes et al [6, 3] proposed a lightweight algorithm to analyze only one
target string with password or pass-phrase. Each user has to type password or pass-phrase for twelve times to form the reference profile. They enhanced [6]
based on [3] by integrated the concept of keyboard gridding in [5]. By using the concept of keyboard gridding, their algorithm is specifically designed and
optimized for right-handed users. As a consequence, the algorithm they proposed can not ensure the same results on left-handed users. 5.58 % EER was obtained
in [6], and less than 5% EER was achieved in [3].
Ru and Eloff [4] used fuzzy logic to characterize the typing behavior of the
users based on the keystroke latencies, the distance of the keys on the keyboard, and typing difficulty of the key combinations. Twenty-five samples are required
for enrollment. Username and password are used as target strings to be analyzed. 7.4% FRR and 2.8% FAR were obtained in the experiment [2]. EER is not
threshold values.
Haidar et al [9] presented a suite of techniques using neural networks, fuzzy
logic, statistical methods, and several hybrid combinations of these approaches to learn the typing behavior of a user. In the experiment, 2% FRR and 6% FAR
were obtained [2].
Bleha et al [23] proposed two approaches for authentication using minimum
distance classifier and Bayesian classifier. The normalized minimum distance classifier was
(
) (
)
i i t i im
X
m
X
m
X
D
⋅
−
−
=
, and the normalize Bayesian classifier was
(
)
(
)
i i i t i i m X m X C m X d ⋅ − − = −1, where the participant is claiming to be user , is the latencies vector,
is the latency means of the reference samples and is the latencies covariance
of the reference samples. Both classifiers have defined thresholds for deciding
the acceptance of the user. They din not mention the results would come up with while different threshold values were used. In the experiment, 8.1% FRR and
2.8% FAR were obtained. EER is not available because they did not conduct the experiment for every possible threshold values.
i X mi
i
C
2.3.2. Predetermined Text
Gaines et al [18] conducted an experiment in which seven professional
secretaries were asked to type three passages, about 300-400 words long (the first one is ordinary English text, the second one is the collection of random
words, and the third one is the collection of random phrases), for two different times separately within four months. Keystroke latency of the digraph that
appeared more than ten times were computed for each individual. A classical two-sample t-test of statistical independence on the hypothesis that the
percentage of the means and variances of the digraphs appeared in both sessions were the same that passed the test were between 80 and 95. Outliers were
removed and the rest of data were transformed by logarithm. An assumption was made that the raw data was log-normally distributed, and the transformed data
was observed to be approximately normally distributed. 4% FRR (2 out of 55) and 0% FAR were obtained. However, the number of volunteers was too small
and the amount of data required to create the reference profiles was insufficient. Only twenty-six lower-case letters and space key were taken into consideration,
resulted that only 27 * 27 = 720 different digraphs. Additionally, since the limitation by the length and content of the three passages, only 87 combinations
of digraph were analyzed in the experiments. Consequently, the results of FAR and FRR obtained in the experiment resulted on a lower confidence.
Leggett and Williams [8] proposed an improved approach based on [20]. They reported the results of two experiments similar to the experiment conducted
in [18]. In the first experiment, seventeen programmers, with different typing ability, each one provided two samples. First sample was 1400 characters long
served as the reference profile, and second one was 300 characters long served as the test profile. In the second experiment, thirty-six participants provided two
passages in 537 characters long in two months separately with a delay of at least one month. Their approach compares all digraph latencies between all
combinations of digraphs in the samples. The test digraph was classified as valid one if the test digraph latency was within 0.5 standard deviation of the reference
digraph latency mean. 5.5% FRR and 5% FAR were obtained.
Bergadano et al [17] proposed an approach which measure digraph latencies
based on the degree of disorder. Given two typing samples of the same text, the digraphs shared between both typing samples are retrieved, and the durations of
n-graphs are computed. The mean of duration is calculated if n-graph is reported
more than one time. Then the shared n-graphs in both typing samples are sorted
by the duration and stored in two arrays respectively. The degree of disorder is computed as the sum of the distances between the positions of each n-graph in
both sorted array. The predetermined sample texts in the experiment are a passage of one famous Italian novel plus a short text in English. Each sample
was produced using only twenty-six lower-case letters, plus the space, the full stop, the comma, the apostrophe and the carriage return keys. 154 volunteers
were involved in the experiments. 4% FRR and less than 0.01% FAR were achieved.
2.4. Free-text Keystroke Analysis
Monrose and Rubin [11] proposed the method using Euclidean Distance and
probabilistic calculations on structured and unstructured texts. They made the assumption that the digraph latencies exhibit Gaussian distribution similar to the
assumption in this thesis. As to the dynamic identity verification, the author pointed out that their approaches were not qualified to authenticate the user
during the lifetime of a login session. Their approaches would fall hopelessly behind as the new measurements arriving almost each second, since the
continuous nature of the problem and the expensive computation of their approaches. The experiments required forty-two users to type a few sentences
accurate classification rate was achieved on structured texts, and only 23% of accurate classification rate was obtained on unstructured texts.
Dowland et al [15, 16] reported a preliminary result on determining which approaches provide the basis for further research on continuous authentication
with keystroke timing characteristics. Statistical analysis and data-mining analysis were used to investigate. 50% of accurate classification rate was
obtained in [15], and 60% of accurate classification rate was improved in [16]. Gunetti and Picardi [1] improved the approach proposed in [17] and introduced
two measures, R measure and A measure, to compute the degree of disorder between two samples of free texts. R measure was the one described in [17]. The
authors concluded that the length of two typing samples must be long enough to gather enough shared n-graphs between two typing samples, resulted on the
typing patterns to be analyzed were free text. If the number of shared n-graph was not sufficient, the degree of disorder computed for the free texts is less
representative. A measure is to suppose that the durations of the same n-graph from two sample texts which came from the same individual are similar. The
author combined two proposed measure with different n-graph to conduct the experiments. In the experiments, forty volunteers, each one provided 15 samples
for building reference profiles. Another one hundred and sixty-five people, each one provided one samples as imposters. All of them were native Italians and the
samples were written in Italian. No more than one sample provided each day via browser, and the samples were collected on the basis of the availability and
willingness of volunteers over a period of six month. Each size of the samples is about 700 to 900 characters long. The limitation of their approach is that the
length of the samples must be long enough. Furthermore, their approach is computationally expensive, and it is infeasible to be applied on verification of
identity via keystroke analysis in real time.
2.5. Summary
After the review of the keystroke dynamics analysis in the literature so far, we can see that the most common method the different approaches used as basis is
that most of them leveraged the mean and standard deviation of the digraph latencies or durations. The approaches determined the valid attempts by checking
whether the latencies or durations of the digraphs typed by the volunteers fall within the standard variation of the digraph latencies or duration mean as
follows: p p p p wD D D wD Dμ − σ ≤ ≤ μ + σ
, where D is one of the digraph latencies or durations in the test profile,
and are the corresponding digraph in the individual’s reference profile, and
is the weighting factor.
p
Dμ p
Dσ
w
There are several issues concerned by keystroke analysis for it to be feasible and practical as follows.
♦ The length of target strings to be analyzed. The longer the target string is, the more the digraphs can be used to compare between reference
profiles and test profiles. By the nature limitation of traditional authentication method with username/password, it is difficult to force
the users to remember their account information in terms of username and password with ten characters long respectively or even more. This
limitation lead to the situation that the methods proposed in the literature can only have spare timing information to analyze.
of calculating the mean and standard deviation of the digraph latencies and duration is to model the personal typing characteristics in statistics.
The more the number of sampled provided, the higher the accuracy of the mean and variance is close to the actual behavior of individual’s
typing characteristics. However, the number of samples also influences the feasibility of the methods in practical. In static keystroke analysis,
all methods required the volunteers to type the same structured or predetermined texts for several times. The number of repetition times
is inverse propositional to the desire of the volunteers and the users to adopt the proposed methods.
Previous works, regarding continuously monitor and analyze the typing patterns for real time identification of individuals have not yielded satisfied
results. Even if the accuracy is acceptable, it takes too long to recognize the identities of individuals. Consequently, it is infeasible in the environment with
high security level, such as government and military computers, since the confidential information could have been stolen for long enough without raising
the alarm. As the result, the time it takes for identification is a critical issue. In the literature with regard to this portion, the computation costs of the proposed
algorithms are high. As a result, it is a problem to verify the user's identity in real time. Unlike the limitation in static keystroke analysis, the sample texts can be of
any length, usually longer enough to have sufficient number of digraph combinations and repetition times for calculating more accurate mean and
standard deviation to fit the individual’s typing behavior. But it has corresponding limitation that the reference samples and the test samples could be
two totally different texts. The situation could happen while the digraphs in the test samples are not existent in the reference samples. The literatures regarding
free-text keystroke analysis have not discussed this issue, either they made the assumption that both the length of reference samples and test samples must be
longer enough to exist shared digraph, or made the constraint that only twenty-six lower-case letter plus several punctuation marks were taken into
consideration to construct the text to analyze.
As to the experiment setting, it is very difficult to obtain a sample
representative of the population, since we do not know how to characterize the population [6]. The experiment setting in each of the proposed method is
different, such as the number of the volunteers involved, the length of the target strings, the number of samples to construct the reference profiles, and where the
experiments were conducted. With all these variations resulted on that there is no fair standpoint to compare the results achieved by each method.
3. Modeling and Methodology
In this chapter, we first make a formal definition of features we will use for keystroke analysis in Section 3.1. The Gaussian Modeling for n-graph timing
information is presented in Section 3.2, and we introduce how to calculate parameters for Gaussian Modeling with Maximum Likelihood Estimation in
Section 3.3. In Section 3.4, the Hidden Markov Model is used to model the timing information given a keystroke sequence, and the Forward algorithm used
to calculate the probability given a keystroke sequence is presented in Section 3.5. In Section 3.6, we devise three general modules for keystroke analysis.
Furthermore, we introduce the schemes for keystroke analysis in Section 3.7.
3.1. Features
In the related work, we have reviewed the features used to analyze keystroke dynamics. In this section, we will give more formal definition on the features
that will be taken into consideration in our model. A single keystroke will trigger two events, the key press event and the key release event, along with the time
while both events occurred. Denote the set of keys of interest as Q, and let Q denote the cardinality of the set .We define the time point while the key is
pressed as . We refer to N consecutive keystrokes as n-graph. The
special case of single keystroke is referred to as unigraph. Two consecutive
keystrokes are referred to as digraph in the literatures, and trigraph means three consecutive keystrokes, etc. Given a sequence of consecutive keystrokes
, where m is the number of keystroke sequence, we have
n-graph with the size of Q pressed TKS
{
s s sm S = 1, 2,K,}
1 + − n1 1 , 3 2 1, , , , } { ∈ ≤≤ − + = d d d dk k N k m n GD K as follows:
TKS
TKS
nk sk pressed s pressed k d = + 1− − .The durations of n-graph are used as timing features for further analysis in our model.
3.2. Gaussian Modeling
Previous work [10, 11, 13, 18] have shown that the durations distribution of a
given set of digraphs forms an approximate Gaussian distribution. Therefore we
make a natural assumption that the n-graph , with duration , ,
forms a Gaussian distribution, such that
n Q q∈ y Pr
[ ]
y |q 2 2 2 ) (2
1
]
|
Pr[
q q y qe
q
y
σ μσ
π
− −=
,where μ is the mean value of the duration for n-graph , and q y q σ is the q
standard deviation. Since behavioral characteristics of the individuals could be influenced by many reasons, the statistical analysis method used by previous
work can be viewed as the same probability was given to the valid attempts of digraph latencies and durations within the standard deviations of the mean
durations. By using Gaussian Modeling, we can give higher probability to the
n-graph durations of test samples that is more close to the n-graph mean
durations of reference samples, and lower probability to the n-graph duration that is far from the mean of the n-graph for the reason that the individuals could be
temporarily out of regular typing behavior, and we can take the irregular typing behavior without discarding the possibility that the set of n-graph durations
3.3. Maximum Likelihood Estimation of the Parameters
With the limitation that we are unable to collect all the typing keystrokes of the
individual and calculate the exact parameters of the means and variances for each
distinct combination of n-graph durations. We have to deduce
{
(
μˆq,σˆq)
}
q∈Qn of n-graph durations, give a keystroke sequence , by the method of maximumlikelihood estimation of the parameters. Fortunately, the maximum likelihood estimation of the parameters for Gaussian distribution can compute the sample
mean and sample variance as follows.
S
[
]
1 ˆ ) ( ˆ ) ( ˆ 2 1 2 1 − − = =∑
∑
= = k q d k q d k i q i q k i i q μ σ μ, where is the number of n-graph appeared in . k q S
3.4. Hidden Markov Model
Hidden Markov Models (HMMs) [12, 14, 22] are proper for modeling sequential
data, such as the sequence of keystroke timing information that we take into consideration in this thesis. HMMs have been widely applied in areas such as
speech recognition, optical character recognition, machine translation, bioinformatics, and genomics. A Markov process is a stochastic process with the
property that the probability of transitioning from previous state to current state depends only on the previous state and was independent of all other previous
states. In general, a Markov model is a way of describing a process that goes through a series of states [14]. In a general Markov Model, the state is directly
observed by the observer. In a Hidden Markov Model, the state is not directly visible, and some outputs from the state are observed. A Hidden Markov Model
t
y
can be viewed as a chain of mixtures models with unknown parameters.
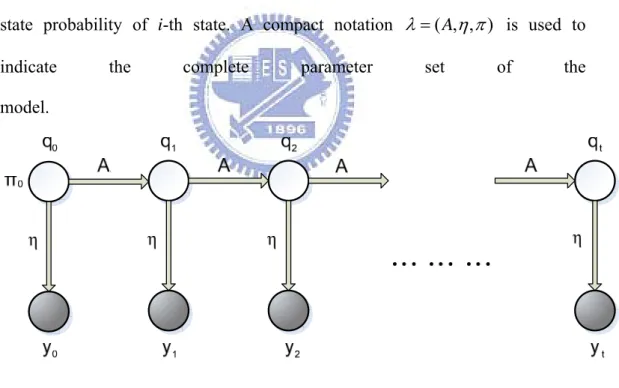
The HMM we use to model the timing information of keystroke sequence is
shown in Figure 3.1. It is a statistical graphical model, where each circle is a
random variable. Unshaded circles represent are unknown (hidden) state
variables we wish to infer, and shaded circles are observed state variables,
where is a specific point in time.
t
q
t A is a state transition matrix holding the
probabilities of transitioning from to , where (or ) means the
i-th (or j-th) state. So we have
i t q j t q 1 + i q j q
(
)
ij i t j A q q P t+1 =1| =1 = . η is an state emissionmatrix holding the output probability
(
| i =1)
t t q
y
P of i-th state. πi is the initial state probability of i-th state. A compact notation λ =(A,η,π) is used to indicate the complete parameter set of the
model.
Figure 3.1: The Hidden Markov Model for keystroke analysis.
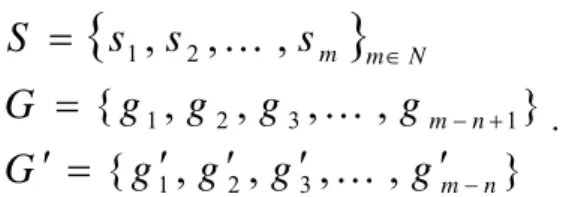
In our setting, given a keystroke sequence , n-graph , [n+1]-graph
, such that
S G
{
}
}
,
,
,
,
{
}
,
,
,
,
{
,
,
,
3 2 1 1 3 2 1 2 1 n m n m N m mg
g
g
g
G
g
g
g
g
G
s
s
s
S
− + − ∈′
′
′
′
=
′
=
=
K
K
K
.The state transition matrix A is the probability of the frequency that the [n+1]-graph appeared in the S as follows.
n m g Ag g t t t − ′ = +1 ,
For instance in Figure 3.2, given a keystroke sequence “banana” and digraph is of interest, the digraph “na” is following the digraph “an”. We have 5 (6-2+1)
digraphs in “banana”, 4 (6-3+1) trigraph in “banana”, and the trigraph “ana”
appears two times. As a result, we have the transition probability of 2 =4 0.5 from “an” to “na”.
Figure 3.2: Graphical mode for digraph with keystroke sequence “banana”
The state emission matrix η here is defined as the Gaussian distribution probability of the n-graph G={g1,g2,g3,K,gm−n+1} with duration
( ) ( ) ( )
, , , ,(
)
}{ 1 1 2 2 3 3 −+1 − +1
= d g d g d g dm n gm n
( )
(
)
( )
( )[
]
⎪
⎪
⎩
⎪⎪
⎨
⎧
′
≠
′
=
=
′
=
′
− ′ −g
g
g
g
e
g
g
d
g
d
g g g d g g,
0
,
2
1
]
|
Pr[
2 2 2σ μσ
π
η
For example, given a sample duration 80ms of digraph “na” with the mean 100ms and the standard deviation 30ms, we can calculate the emission
probability of sample digraph duration as follows.
(
)
[
]
( )0
.
010648267
30
2
1
"
|"
100
Pr
80
2 2 30 2 100 80 " "=
⋅
=
=
⋅ − −e
na
ms
ms
naπ
η
The initial probability vector π is the probability of the frequency that the
n-graph appeared in the S.
There are three basic problems to solve with the HMM λ=(A,η,π). These problems are the following.
♦ Given a model parameters λ=(A,η,π) and observation output sequence O=O1O2O3KOt, compute the probability P(O|λ) of the
observation output sequence.
♦ Given a model parameters λ=(A,η,π) and observation output sequence O=O1O2O3KOt, find the most probable state sequence
t
Q Q Q Q
Q= 1 2 3K which could have generated the observation output
sequence.
♦ Given a observation output sequence O=O1O2O3KOt, generate a
HMM λ =(A,η,π) to maximize the P(O|λ).
We make the assumption that each individual has his/her own HMM with )
, , ( η π
λ = A for individual’s keystroke timing characteristics. The problem to
to choose one from the number of HMMs which has the highest probability to generate the keystroke sequence . Consequently, first we have to calculate the probability of keystroke sequence for each HMM. This is similar to the first
basic problem to solve with HMM as described above, and we will show how to
solve the problem with Forward algorithm in the next section.
S S
3.5. Forward Algorithm
The problem of finding the probability of keystroke sequence can be viewed as how well a given HMM
S
) , , ( η π
λ= A would score on . We use the
Forward algorithm [
S
22] to calculate the probability of a m long keystroke sequence S with n-graph G, and n-graph durations GD,
{
}
}
,
,
,
,
{
}
,
,
,
,
{
,
,
,
1 3 2 1 1 3 2 1 2 1 + − + − ∈=
=
=
n m n m N m md
d
d
d
GD
g
g
g
g
G
s
s
s
S
K
K
K
The state probabilities α's of each state can be computed by first calculating
α for all states at t=1.
( )
1( )
1( )
11
g
π
g
η
g1d
α
=
⋅
Then for each time step t=2 K, ,k , the state probability α is calculated
recursively for each state.
( )
1 ,( )
11 +
(
)
1 1 ++ t
=
t t⋅
g g+⋅
g+ t tg
α
g
A
t tη
td
α
Finally, the probability of keystroke sequence given a HMM S λ=(A,η,π)
is as follows.
[
S
,
G
,
GD
|
λ
]
=
α
k( )
g
k=
α
k−1(
g
k−1)
⋅
A
gk−1,gk⋅
η
gk(
d
k)
Pr
The Forward algorithm described above has certain difference from the original one in [22]. The emission probabilities take less computation to obtain
since we use the Gaussian distribution to model observed states. Additionally the observed states are only connected to the corresponding unknown states because
we know the exact combination of n-graph the individual typed. So the summation of all partial probability of the state at time is ignored and only
one probability is calculated.
t
In original version of the Forward algorithm, the computation involved in
the calculation of αt
( )
j , 1≤t≤T , 1≤ j≤N , where T is the number ofobservations in the sequence and is the number of states in the model,
requires
N
( )
N TO 2 calculations. In our modified version of the Forward
algorithm, we can see that it only requires O
( )
NT calculations.3.6. General Modules for Keystroke Analysis
In general, there are two problems can be solved using our model.
♦ Given a keystroke sequence S , and a HMM λ describing individual’s keystroke timing information, we wish to determine whether S come from λ or not. (Authentication)
♦ Given a keystroke sequence and a set of HMMs S λ's describing
different individuals’ keystroke timing information, we wish to know which HMM most probably generated S. (Identification)
The first problem is that, given a test sample of keystroke sequence and a reference profile, we have to decide whether the sample belongs to the reference
profile or not. The second problem is very similar to the solutions provided by physiological biometrics. In this section, we devise three modules: Profile
Building Module, Authentication Module and Identification Module underlying the model and algorithm described in the previous sections.
In the Profile Building Module, first we have to build the reference profile for each user. It requires the user to provide the reference samples. The more
quantity of reference samples provided, the more exact parameters can be extracted. After collecting sufficient number of reference samples, we use the
maximum likelihood estimation for Gaussian Modeling to calculate the parameters of each n-graph duration. We also have to compute the transition
probability matrix and initial probability vector with respect to Hidden Markov Model. Then the parameters calculated for Hidden Markov Model are treated as
the base element of the reference profile for each user. The flow chart of Profile Building Module is shown in Figure 3.3.
User provide sufficient number of reference samples
Transform the reference samples as combination of n-graph and duration
time for each n-graph
Apply maximum likelihood estimation for Gaussian Modeling to calculate the duration mean and duration standard
deviation of each distinct n-graph
Compute the transition probability matrix and initial probability vector of each n-graph state for Hidden Markov
Model
A : Transition probability matrix of HMM η : Emission probability matrix of HMM π : Initial probability vector of HMM
Store the profile of the particular User with the form of HMM λ={A, η, π} into User
Figure 3.3: Flow chart for Profile Building Module
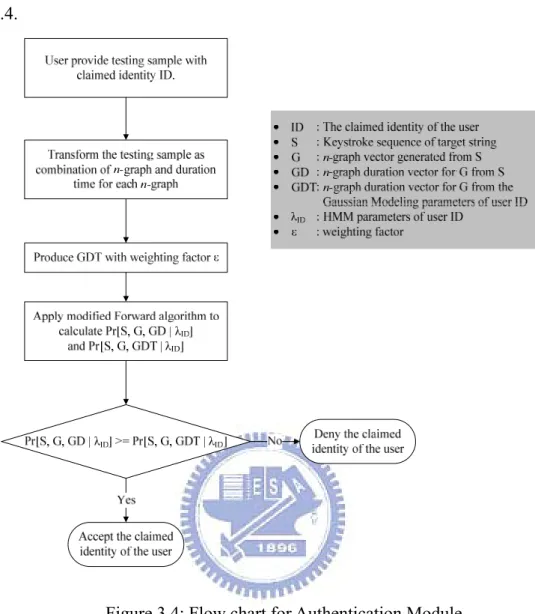
In the Authentication Module, given a keystroke sequence of target
string from a user with claimed identity
S
ID, we wish to examine the possibility
that S generated by ID. First we transform the keystroke sequence to n-graph combinations and calculate the timing information of n-graph
duration as usual. At this moment, we have
S G GD S =
{
s1,s2,K,sm}
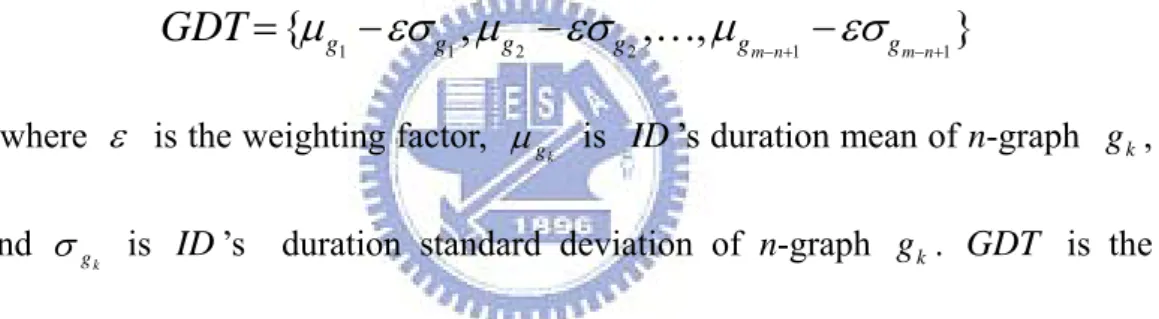
m∈N , and } , , , , { 1 2 3 −+1 = g g g gm n G K GD={d1,d2,d3,K,dm−n+1}. Now we produce avector GDT, such that
}
,
,
,
{
1 1 2 2 1 1−
−
−+−
−+=
n m n m g g g g g gGDT
μ
εσ μ
εσ
K
μ
εσ
, where ε is the weighting factor, k
g
μ is ID ’s duration mean of n-graph , and
k
g
k
g
σ is ID ’s duration standard deviation of n-graph . is the
n-graph duration vector to evaluate the threshold value of the probability
produced by modified Forward algorithm. With the inputs , , and
k
g GDT
GD GDT λID,
we can apply modified version of Forward algorithm to obtain two probability value Pr[S,G,GD|λID] and Pr[S,G,GDT|λID]. Pr[S,G,GDT|λID] can be
viewed as the possibility if all the n-graphs durations in G are deviating ε times of duration σ from duration μ. Pr[S,G,GDT|λID] is the threshold value of probability used to decide that the acceptance of the keystroke sequence
is confirmed if following expression is true.
S ] | , , Pr[ ] | , , Pr[S G GD λID ≥ S G GDT λID
The weighting factor ε can be specified with respect to different level of security strength. The flow chart of Authentication Module is shown in Figure
3.4.
Figure 3.4: Flow chart for Authentication Module
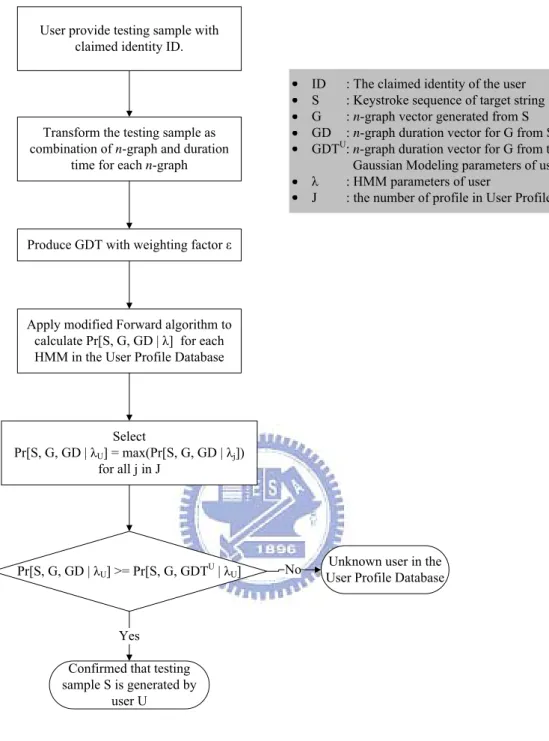
In the Identification Module, given a keystroke sequence
from the individual and a set of HMMs
{
s s sm m N S = 1, 2,K,}
∈}
{
ls λ λ λ λ
λ' = 1, 2, 3K, , where is the number of HMM. The problem is to choose the best one from
l s
'
λ which most probably generated or there is no such one existed. In the beginning, the keystroke sequence is transformed to
n-graph combinations and the timing information of
n-graph duration S S } , , , , { 1 2 3 − +1 = g g g gm n G K } , , , , { 1 2 3 −+1 = d d d dm n GD K is calculated. l j N j j GD G S, , | ] ∈ 1,≤ ≤
Forward algorithm. We select user U with the maximum probability over others’, such as
(
j j N j l)
U S G GD GD G S, , | ]=max Pr[ , , | ]∈ ,1≤ ≤ Pr[ λ λAfter that, we produce a vector GDT for user U , such that
}
,
,
,
{
1 1 2 2 1 1 U U U U U U U n m g n m g g g g gGDT
+ − + −−
−
−
=
μ
εσ
μ
εσ
K
μ
εσ
, where ε is the weighting factor, is U ’s duration mean of n-graph , and is U ’s duration standard deviation of n-graph . Again we use the
modified Forward algorithm to calculate the . If the
expression , the keystroke sequence
generated by user U is confirmed. Otherwise, we consider the keystroke sequence is not generated by any user in the User Profile Database. The flow
chart is shown in Figure 3.5.
U k g μ gk U k g σ gk ] | , , Pr[ U U GDT G S λ ] , , Pr[ ] | , , U U U S G GDT GD G λ ≥ |λ Pr[S S S
User provide testing sample with claimed identity ID.
Transform the testing sample as combination of n-graph and duration
time for each n-graph
Produce GDT with weighting factor ε
Apply modified Forward algorithm to calculate Pr[S, G, GD | λ] for each HMM in the User Profile Database
Confirmed that testing sample S is generated by
user U
ID : The claimed identity of the user S : Keystroke sequence of target string G : n-graph vector generated from S GD : n-graph duration vector for G from S GDTU: n-graph duration vector for G from the
Gaussian Modeling parameters of user U λ : HMM parameters of user
J : the number of profile in User Profile Database
Pr[S, G, GD | λU] >= Pr[S, G, GDTU| λU]
Unknown user in the User Profile Database No
Yes Select
Pr[S, G, GD | λU] = max(Pr[S, G, GD | λj])
for all j in J
Figure 3.5: Flow chart for Identification Module
3.7. Scheme and Measures
Within the literature of fixed-text keystroke analysis, most of the proposed approaches put the emphasis on the application of authentication. There are
♦ The target string to be analyzed could be username, password, first name, last name, or pass-phrase, which are normally short and usually
three to sixteen characters in length.
♦ The samples used to build the reference profiles and the samples used to compare are identical and fixed strings, the difference is the timing information extracted from them.
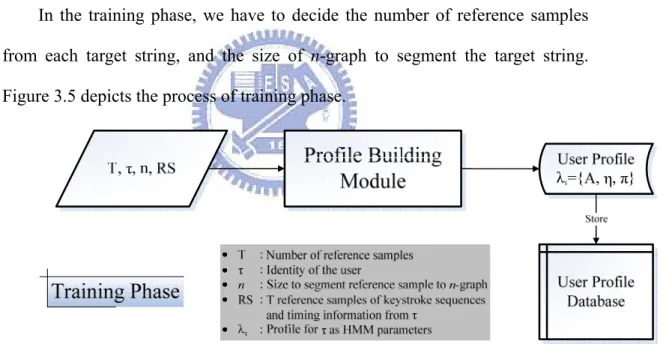
We devise the scheme for fixed-text keystroke analysis according to the concerns listed above. There are two phases in the scheme for static keystroke analysis,
the training phase and the recognition phase. The training phase is to build the user profiles as the database for recognition phase to compare with.
In the training phase, we have to decide the number of reference samples from each target string, and the size of n-graph to segment the target string.
Figure 3.5 depicts the process of training phase.
Figure 3.5: Flow chart of training phase for fixed-text keystroke analysis
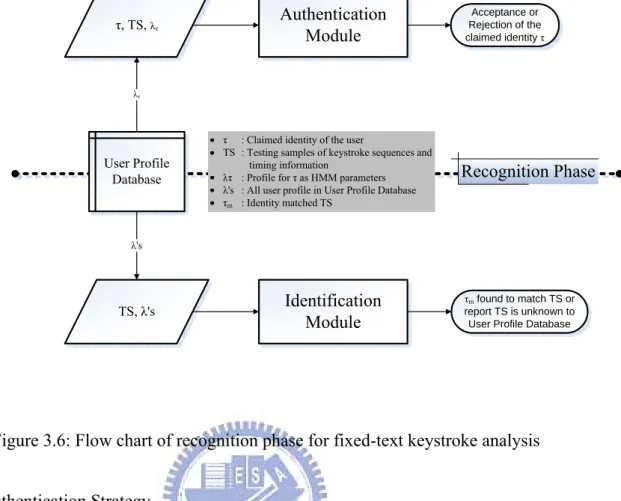
In the recognition phase, we divide it into two parts according the function
for dedicated requirement: Authentication or Identification. Figure 3.6 depicts the process of recognition phase.
Authentication Module τ, TS, λτ Acceptance or Rejection of the claimed identity τ User Profile Database
τ : Claimed identity of the user
TS : Testing samples of keystroke sequences and timing information
λτ : Profile for τ as HMM parameters λ's : All user profile in User Profile Database τm : Identity matched TS Recognition Phase λτ TS, λ's Identification Module λ's τm found to match TS or report TS is unknown to User Profile Database
Figure 3.6: Flow chart of recognition phase for fixed-text keystroke analysis
3.8. Authentication Strategy
The target strings to be analyzed in traditional login-password authentication mechanism are username and password. We can use two strategies as follows:
♦ O-Strategy
The claimed identity is accepted if both username and password passed
the verification phase. This strategy requires users make no mistakes on both target strings.
♦ A-Strategy
The claimed identity is rejected if both username and password denied
at the recognition phase. This strategy allows users to make almost most one mistake on one of the target strings.
4. Experiments and Results
4.1. Experiment Setting
The experiment was conducted via web browser. A client-side JavaScript is used
to gather the timing information of keystroke. Parts of the volunteers are colleagues and alumni of NCTU. Other parts of volunteers were anonymous
from Internet. User provided their login name and password via html form, just like the way commonly employed by the web-based application. The timing
accuracy we used is 1 millisecond. In this experiment, we use digraph as the segment size of keystroke sequence.
4.2. Data Collection
For the collection of reference samples, 58 volunteers provided two familiar
strings as login name and password for 20 times. As to the collection of testing samples, the above 58 volunteer tried to be authenticated in their own account as
legitimate users for 15 times, 870 testing samples were used to evaluate FRR. Another 257 anonymous volunteers tried to be authenticated in legitimate users’
accounts. Each account was attacked between 44 and 82 times. Total 3528 imposter testing samples were collected.
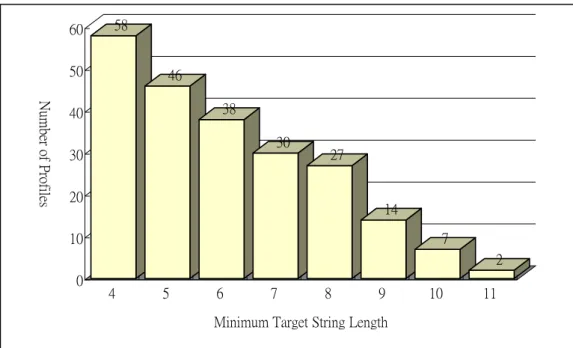
The lengths of login name and password are between 4 and 14. Figure 4.1 show the distribution of target string length.
58 46 38 30 27 14 7 2 0 10 20 30 40 50 60 Numb er o f Pr of il es 4 5 6 7 8 9 10 11
Minimum Target String Length
Figure 4.1: Target string length distribution of reference samples
4.3. Evaluation
We evaluate the value of standard deviation weighting factor ε between 0.2
and 3.5 with interval of 0.1 for both strategy. Figure 4.2 to Figure 4.5 shows the FAR and FRR of O-Strategy with minimum target length of 9, reference sample
0.00% 10.00% 20.00% 30.00% 40.00% 50.00% 60.00% 70.00% 80.00% 90.00% 100.00% 0.2 0.5 0.8 1.1 1.4 1.7 2 2.3 2.6 2.9 3.2 3.5
Threshold of Standard Deviation
FR
R vs.
FAR FAR
FRR
Figure 4.2: O-Strategy - Minimum target string length = 9, reference sample size = 5 0.00% 10.00% 20.00% 30.00% 40.00% 50.00% 60.00% 70.00% 80.00% 90.00% 100.00% 0.2 0.5 0.8 1.1 1.4 1.7 2 2.3 2.6 2.9 3.2 3.5
Threshold of Standard Deviation
FR
R vs.
FAR FAR
FRR
= 10, EER = 5.71% 0.00% 10.00% 20.00% 30.00% 40.00% 50.00% 60.00% 70.00% 80.00% 90.00% 100.00% 0.2 0.5 0.8 1.1 1.4 1.7 2 2.3 2.6 2.9 3.2 3.5
Threshold of Standard Deviation
FR
R vs.
FAR FAR
FRR
Figure 4.4: O-Strategy - Minimum target string length = 9, reference sample size = 15, EER = 5.24% 0.00% 10.00% 20.00% 30.00% 40.00% 50.00% 60.00% 70.00% 80.00% 90.00% 100.00% 0.2 0.5 0.8 1.1 1.4 1.7 2 2.3 2.6 2.9 3.2 3.5
Threshold of Standard Deviation
FR
R vs.
FAR FAR
Figure 4.5: O-Strategy - Minimum target string length = 9, reference sample size = 20, EER = 4.76%
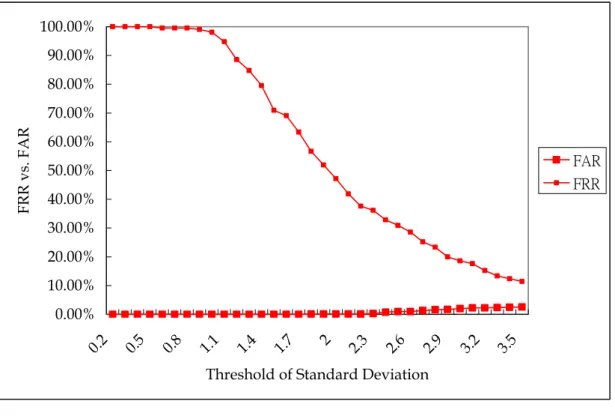
Figure 4.6 to Figure 4.9 shows the FAR and FRR of A-Strategy with minimum target length of 9, reference sample size of 5, 10, 15, 20, and 35 possible
standard deviation weighting factor.
0.00% 10.00% 20.00% 30.00% 40.00% 50.00% 60.00% 70.00% 80.00% 90.00% 100.00% 0.2 0.5 0.8 1.1 1.4 1.7 2 2.3 2.6 2.9 3.2 3.5
Threshold of Standard Deviation
FR
R vs.
FAR FAR
FRR
Figure 4.6: A-Strategy - Minimum target string length = 9, reference sample size = 5, EER = 6.19%
0.00% 10.00% 20.00% 30.00% 40.00% 50.00% 60.00% 70.00% 80.00% 90.00% 100.00% 0.2 0.5 0.8 1.1 1.4 1.7 2 2.3 2.6 2.9 3.2 3.5
Threshold of Standard Deviation
FR
R vs.
FAR FAR
FRR
Figure 4.7: A-Strategy - Minimum target string length = 9, reference sample size = 10, EER =3.81% 0.00% 10.00% 20.00% 30.00% 40.00% 50.00% 60.00% 70.00% 80.00% 90.00% 100.00% 0.2 0.5 0.8 1.1 1.4 1.7 2 2.3 2.6 2.9 3.2 3.5
Threshold of Standard Deviation
FR
R vs.
FAR FAR
FRR
= 15, EER =2.91% 0.00% 10.00% 20.00% 30.00% 40.00% 50.00% 60.00% 70.00% 80.00% 90.00% 100.00% 0.2 0.5 0.8 1.1 1.4 1.7 2 2.3 2.6 2.9 3.2 3.5
Threshold of Standard Deviation
FR
R vs.
FAR FAR
FRR
Figure 4.9: A-Strategy - Minimum target string length = 9, reference sample size = 20, EER =2.54%
We can see from Figure 4.2 to Figure 4.9 that A-Strategy obtained better ERR than O-Strategy. In Figure 4.10 and Figure 4.11, we show that the relation of
0.00% 1.00% 2.00% 3.00% 4.00% 5.00% 6.00% 7.00% 8.00% 4 5 6 7 8 9 10 11
Minimum Target String Length
Eq ual Er ror Ra te r_size = 10 r_size = 15 r_size = 20
Figure 4.10: O-Strategy – EER vs. Minimum target string length
0.00% 2.00% 4.00% 6.00% 8.00% 10.00% 12.00% 4 5 6 7 8 9 10 11
Minimum Target String Length
Equa l Error Rate r_size = 5 r_size = 10 r_size = 15 r_size = 20
Figure 4.11: A-Strategy – EER vs. Minimum target string length
O-Strategy 0.00% 10.00% 20.00% 30.00% 40.00% 50.00% 60.00% 70.00% 80.00% 90.00% 100.00% 5 6 7 8 9 10 11 12 13 14 15 16 17 18 19 20 Number of Reference Samples
Fa lse Rej ect io n R ate ε= 1.0 ε= 2.0 ε= 3.0
Figure 4.12: O-Strategy: FRR with different number of reference samples
O-Strategy 0.00% 10.00% 20.00% 30.00% 40.00% 50.00% 60.00% 70.00% 80.00% 90.00% 100.00% 5 6 7 8 9 10 11 12 13 14 15 16 17 18 19 20 Number of Reference Samples
Fa lse Accept ance Ra te ε= 1.0 ε= 2.0 ε= 3.0
A-Strategy 0.00% 10.00% 20.00% 30.00% 40.00% 50.00% 60.00% 70.00% 80.00% 90.00% 100.00% 5 6 7 8 9 10 11 12 13 14 15 16 17 18 19 20 Number of Reference Samples
False Rejection
Rate
ε= 1.0 ε= 2.0 ε= 3.0
Figure 4.14: A-Strategy: FRR with different number of reference samples
A-Strategy 0.00% 10.00% 20.00% 30.00% 40.00% 50.00% 60.00% 70.00% 80.00% 90.00% 100.00% 5 6 7 8 9 10 11 12 13 14 15 16 17 18 19 20 Number of Reference Samples
False Ac ce pt an ce Ra te ε= 1.0 ε= 2.0 ε= 3.0
Figure 4.15: A-Strategy: FAR with different number of reference samples
We can see from Figure 4.12 to Figure 4.15 that FRR of both strategies drop as the number of reference samples increase, and FAR of both strategies lift slightly
5. Conclusions
Our approach achieved the EER of 2.54%, which is near 2 % - values generally considered to be acceptable for this type of system. The ERR of our scheme can
be improved as we conduct more experiment to collect more reference sample with length longer than 10.
As to future work, we can combine the proposed scheme with the analysis of the surfing route to the login page. The proposed model can be extended to
devise scheme for free-text keystroke analysis, such as continuously real-time identity verification.
6. References
[1] D. Gunetti and C. Picardi, “Keystroke Analysis of Free Text”, ACM Transactions on Information and System Security (TISSEC), vol. 8, no. 3, pp. 312-347, Aug 2005.
[2] L. C. F. Araujo, L. H. R. Sucupira Jr., M. G. Lizarraga, L. L. Ling, and J. B. T. Uabu-Tti, “User Authentication Through Typing Biometrics Features”, IEEE Transactions on Signal Processing, vol. 53, no. 2, pp. 851-855, Feb. 2005.
[3] S. T. Magalhaes, K. Revett, and H. M. D. Santos, “Password Secured Sites – Stepping Forward with Keystroke Dynamics”, Proceedings of the International Conference on Next Generation Web Services Practices (NWeSP’05), pp. 293-298, Aug. 2005.
[4] W. G. de Ru and J. H. P. Eloff, “Enhanced Password Authentication through fuzzy logic,” IEEE Expert, vol. 17, no. 6, pp. 38–45, Nov. 1997.
[5] K. Revett and A. Khan, “Enhancing Login Security Using Keystroke hardening and Keyboard Gridding”, Proceedings of the IADIS MCCSIS, 2005.
[6] S. T. Magalhaes, H. M. D. Santos, “An Improved Statistical Keystroke Dynamics Algorithm”, Proceedings of the IADIS MCCSIS, 2005.
[7] A. Peacock, X. Ke, and M. Wilkerson, “Typing Patterns: A Key to User Identification”, IEEE Security & Privacy, vol. 2, no. 5, pp. 40-47, Sep 2004. [8] J. Leggett and G. Williams, “Verifying Identity via Keystroke
Characteristics”, International Journal of Man-Machine Studies, vol. 28, no. 1, pp. 67-76, 1988.
[9] S. Haidar, A. Abbas, and A. K. Zaidi, “A multi-technique approach for user identification through keystroke dynamics,” in Proc. IEEE International Conference on Systems, Man, and Cybernetics, vol. 2, pp. 1336–1341, 2000.
[10] D. Song, P. Venable, and A. Perrig, “User Recognition by Keystroke Latency Pattern Analysis”, Apr. 1997.
[11] F. Monrose and A. Rubin, “Authentication via Keystroke Dynamics”, Proceedings of the 4th ACM conference on Computer and Communication Security, pp. 48-56, Apr. 1997.
[12] M. I. Jordan, “An Introduction to Probabilistic Graphical Models”. In preparation.
[13] D. X. Song, D. Wagner, and X. Tian, “Timing Analysis of Keystrokes and Timing Attacks on SSH”, In 10th USENIX Security Symposium,
pp.337-352, Aug. 2001.
[14] S. Russell and P. Norvig, “Artificial Intelligence, A Modern Approach”, Prentice Hall, 1995.
[15] P. Dowland, H. Singh, and S. M. Furnell, “A Preliminary Investigation of User Authentication using Continuous Keystroke Analysis”, Proceedings of 8th IFIP Annual Working Conference on Information Security Management and Small System Security, Sep. 2001.
[16] P. Dowland, H. Singh, and S. M. Furnell, “Keystroke Analysis as a Method of Advanced User Authentication and Response”, Proceedings of the IFIP TC11 17th International Conference on Information Security: Vision and Perspectives, pp. 215-226, May. 2002.
[17] F. Bergadano, D. Gunetti, and C. Picardi, “User Authentication through Keystroke Dynamics”, ACM Transactions on Information and System Security (TISSEC), vol. 5, no. 4, pp. 367-397, Nov 2002.
[18] R. S. Gaines, W. Lisowski, S.J. Press, and N. Shapiro, “Authentication by Keystroke Timing: Some Preliminary Results”, Rand Report R-256-NSF. Rand Corporation, 1980.
[19] R. Joyce and G. Gupta, “Identity Authentication Based on Keystroke Latencies”, Communication s of the ACM, vol. 33, no. 2, pp. 168–176, 1990.
[20] D. Umphress and G. Williams, “Identity Verification through Keyboard Characteristics”, International Journal of Man-Machine Studies, vol. 23, no. 3, pp. 263-273, 1985.
[21] A. J. Mansfield and J. L. Wayman, “Best Practices in Testing and Reporting Performance of Biometric Devices”, Biometrics Working Group, Aug. 2002.
[22] L. R. Rabiner, “A Tutorial on Hidden Markov Models and Selected Applications in Speech Recognition”, Proceedings of the IEEE, vol. 77, No. 2, Feb. 1989.
[23] S. Bleha, C. Slivinsky, and B. Hussien, “Computer-Access Security Systems Using Keystroke Dynamics”, IEEE Transactions on Pattern Analysis and Machine Intelligence, vol. 12, no. 12, Dec. 1990.