www.elsevier.com/locate/jcis
Investigating the adsorption of 2-mercaptothiazoline on activated carbon
from aqueous systems
Chiung-Fen Chang,
a,∗Ching-Yuan Chang,
aand Wolfgang Höll
baGraduate Institute of Environmental Engineering, National Taiwan University, Taipei 106, Taiwan
bForschungszentrum Karlsruhe, Institute for Technical Chemistry, Section WGT, P.O. Box 3640, 76021 Karlsruhe, Germany
Received 15 June 2003; accepted 12 September 2003
Abstract
2-Mercaptothiazoline (2-MT) is widely used as an organic corrosive as well as a diffusion inhibitor due to its high ability to form metal– chelate Schiff base complexes. This study investigated the elimination of 2-MT from aqueous systems with adsorption process to reach the goal of sustainable use of water resources. The Freundlich and Langmuir adsorption isotherms were adopted to examine the adsorption behavior of two types of 2-MT (i.e., 2-MT molecule and 2-MT complex) on activated carbon (AC) Chemviron Filtrasorb 400 (F 400) in three different solutions. The results of adsorption isotherm data showed that the adsorption ability of 2-MT molecule is much higher than that of 2-MT complex, whose ability may be reduced due to the electrostatic repulsion. The good applicability of Langmuir adsorption isotherm to experimental data indicated that the adsorption of 2-MT complexes on F 400 might be limited to a monolayer. Higher ionic strength and lower pH value of the solutions promoted the uptake of 2-MT onto F 400 from the solutions. In addition, not only 2-MT molecule and complex but also Cu(II) can be adsorbed on the surface of F 400, which was demonstrated by energy dispersive analysis of X-ray (EDAX). Effects of the two major interactions, chemical and physical interactions, on the adsorption of 2-MT on F 400 were compared as well in this study.
2003 Elsevier Inc. All rights reserved.
Keywords: 2-Mercaptothiazoline; Adsorption isotherms; Metal complex; Physical interaction; Chemical interaction
1. Introduction
2-Mercaptothiazoline (2-MT) is commonly used as an organic corrosive as well as a diffusion inhibitor due to the electron donor properties of N and S atoms, which re-sult in adsorption/complexation behavior on the surface of the metal [1,2]. In order to reach the goal of a sustainable process, recycling and reusing the wastewater/process wa-ter demands immediate attention, which is a task and chal-lenge for scientific engineers. Liquid-phase adsorption, as a separation process, is widely applied in drinking water and industrial wastewater treatments. Granular activated carbon (GAC) plays an increasing role in water/wastewater treat-ment because it effectively removes a wide variety of organic compounds and can be easily fitted to the treatment plants, while powder-activated carbon (PAC) is still mostly used in the drinking water treatment. For successful design and
oper-* Corresponding author.
E-mail address: [email protected] (C.-F. Chang).
ation, the rate and ultimate capacity of activated carbon (AC) need to be quantified according to the conditions associated with the real treatment system [3]. Adsorption isotherm is fundamental and essential as a first step in designing the process no matter what the system is (e.g., batch or fixed-bed adsorber system). Furthermore, if the ultimate capacity is computed from the adsorption isotherm, it may be used to es-timate the lowest carbon dosage for the wastewater treatment to reach economic benefit. The previous study [4] showed that it is feasible to use AC to remove polyethylene glycol on the AC from the electroplating solution, thereby achiev-ing the benefit of recyclachiev-ing. Hence, the adsorption process ought to be a practical technique for eliminating the 2-MT from the aqueous systems and then to reach the goal of sus-tainable use of the water resource.
Numerous publications in the literature on adsorption of organics on AC have been available in the past (for exam-ple, Refs. [3–7]). However, the real mechanisms and phe-nomena on the surface of AC during adsorption, such as microporosity, hindered diffusion, interactions between the
0021-9797/$ – see front matter 2003 Elsevier Inc. All rights reserved. doi:10.1016/j.jcis.2003.09.012
new adsorbates and ACs, effects of properties of the solu-tion, and competition of the possible adsorbates still need to be understood. The goal of this study is to investigate the ad-sorption behavior of 2-MT in different aqueous systems. The adsorption capacities of 2-MT affected by the ion strength, the pH value, and the characteristics of 2-MT component (e.g., forming metal complex or not), were also compared and discussed. In addition, the effect of microporosity of the AC on adsorption was examined to elucidate the impor-tance of chemical and physical interactions.
2. Materials and methods
2.1. Adsorbent
Activated carbon, Chemviron Filtrasorb 400 (F 400), with a particle size range between 12 and 40 mesh was used as the adsorbent. The mean particle size of F 400, dp= 1.04 mm,
was calculated from the sieve analysis of the representative samples obtained from a rotating sample-splitting device by means of the weight percentages of particles in the differ-ent sieve sizes. The physical characteristics of F 400, such as the BET specific surface area, the specific external sur-face area, the average true particle density, particle porosity, etc., are shown in Table 1. The pretreatment of the adsorbent comprised several steps. First, the adsorbent was washed by distilled water to remove the crushed carbon fines. Second, it was dried at 383 K in a vacuum oven overnight and then stored in a desiccator. Finally, it was wetted in the specific wetting solutions under vacuum, prior to both bottle-point and short fixed-bed reactor (SFB-reactor) experiments.
2.2. Aqueous systems
Several kinds of aqueous solvents were used to inves-tigate the adsorption behavior of 2-MT by AC, as listed in Table 2. Two pairs of aqueous solutions (e.g., SMT, e
and SMT, 0.25, and SMT, 0.25 and SMT, 6) were used to
in-vestigate the effects of copper sulfate and pH, respectively. In addition, the value of the correction factor, fβ = 2.18,
for SFB-reactor experiments were average values obtained from the adsorption of standard compounds of p-nitrophenol (PNP) and anthraquinone-2-sulfonate (ACS). The calcula-tion is based on the available liquid phase diffusion coeffi-cients (DL) [6]. Detail computation of fβ can be referred to
the study of Chang [8].
2.3. Target adsorbate
2-Mercaptothiazoline was reagent grade provided by Merck and used as the main target adsorbate in this study.
Table 1
Physical characteristics of Chemviron Filtrasorb 400 (F 400)
Property Value
Mesh size 12–40
Average particle diameter, dp(mm) 1.044 Specific external surface areaa, as(m2/kg) 5.76 Average true particle densityb, ρs(kg/m3) 2180 Apparent particle densityb, ρp(kg/m3) 1000 Filter layer densityc, ρF (kg/m3) 530
Particle porosityd, εp(–) 0.54
Filter voidaged,e, εF (–) 0.47
Langmuir specific surface areaf(m2/g) 1363
Total pore volumeg(cm3/g) 0.616
Micropore volumeh(cm3/g) 0.443
Meso- and macropore volumei(cm3/g) 0.173
Average pore diameterj(Å) 18
Average pore hydraulic radiush(Å) 3.6 a Assumed as spherical particle and calculated using a
s= 6/(ρpdp). b Data from the pycnometry experiments.
c In a water-filled bed. d Calculated using ε
p= 1 − (ρp/ρs). e Calculated using ε
F= 1 − (ρF/ρp).
f Data from the surface area determined by N2adsorption at 77 K in the volumetric equipment, ASAP 2010.
g Data from the analysis by the single point method with pore size less than 800 Å.
h Data from the analysis by the micropore method (MP method) with pore size between 2.4 to 17.6 Å.
i Data from the difference between total pore volume and micropore volume.
j The pore size distribution is from 17 to 3000 Å determined by the BJH integration method.
Table 2
Identification and compositions of the aqueous systems
Solution ID Composition Note
Se Electroplating solution, containing concentrated sulfuric acid, H2SO4(conc), of 60 g dm−3, CuSO4·5H2O of 200 g dm−3, and concentrated hydrochloric acid, HCl(conc), of 30 mg dm−3. The pH value of Seis around 0.25.
Simulating the copper electroplat-ing solution.
SMT, e Electroplating solution, containing concentrated sulfuric acid, H2SO4(conc), of 60 g dm−3, CuSO4·5H2O of 200 g dm−3, and concentrated hydrochloric acid, HCl(conc), of 30 mg dm−3. The pH value of SMT, eis around 0.25. The only organic compound in the solution SMT, e is 2-mercaptothiazoline (2-MT) at various concentrations.
Simulating the copper electroplat-ing solution with various concentra-tions of 2-MT.
SMT, 0.25 Distilled water containing HCl(conc), of 30 mg dm−3, with the same pH value as electroplating solution, adjusted by H2SO4(conc). The only organic compound in the solution SMT, 0.25is 2-MT at various concentrations.
The initial concentration of 2-MT for SFB-reactor experi-ments was around 10 g m−3, while that for the isothermal adsorption experiments was between 0 and 50 g m−3.
2.4. Analytical measurements
Prior to the analysis, all the samples were filtrated through a 0.45-µm membrane. Three methods and three an-alyzers, i.e., total organic carbon (TOC) analysis (O.I.C. M-700/Carbon Analyzer Dohrmann DC-80), UV spec-trophotometry (Perkin–Elmer UV/VIS Lambda 3), and high performance liquid chromatography (HPLC, HP1090) were used to determine the concentrations of organic adsorbates in this study. The analytical conditions for detection of or-ganic adsorbate are as follows. The wavelengths used in UV spectrophotometry for 2-MT was 270 nm. An ODS Hyperic column and a DAD diode array detector were used in HPLC. The HPLC method for the analysis of 2-MT is so-called ion-pair chromatography, which is suitable for trace-level deter-mination [9]. The eluent for HPLC analysis was composed of 73.7 vol% of 5.42 mmol tetrabutylammonium hydrogen-sulfate in H2O and 26.3 vol% of acetonitrile.
2.5. Adsorption behavior
Due to the restricted validity of the Freundlich isotherm, the final concentrations of adsorbates were specially selected to obtain the suitable adsorption isotherms. Various weight ratios of 2-MT to AC were prepared to get different bottle-point data. The bottles were shaken at 298 K until the con-centrations of filtrate did not change within a range of±3%. Since it is preferable to use the weight concentration units for investigating the removal efficiency in wastewater treat-ments, the units of g m−3and g kg−1for the liquid and solid phases were used for all the compounds in this study.
2.6. Energy dispersive analysis of X-ray (EDAX)
Before the EDAX analysis, the samples were continu-ously and repeatedly eluted by distilled water (with conduc-tivity of about 0.8–0.9 µ✵/cm) until the conductivity of the solution was the same as that of the distilled water, which can ensure that electrolytes and adsorbates, and nonspecific compounds were no longer present in the aqueous phase, nor adsorbed on the solid surface, respectively. Thus, all the samples were dried in the oven at 373 K over night. The experiments were carried out by a Hitachi S-2400 scanning electronic microscope with an EDAX KEVEX Level 4. The scanning energy varied between 0 and 10.23 keV and the elapsed time was 100 s.
2.7. Liquid-phase diffusion coefficient
The short fixed bed reactor experiments were used to determine the liquid-phase diffusion coefficient, DL. The
length and diameter of the SFB-reactor were 20 and 2 cm,
respectively. The amount of adsorbent (F 400) used in this test was about 3 g per experiment. The temperature for the solution containing 2-MT was kept constant at 298 K, which was carefully controlled because the effect of temperature is significant for the kinetics of adsorption [6]. To avoid air bubbles in the carbon bed, the column was packed under spe-cific wetting solution using distilled water at the pH value of 0.25. The filter velocities were well controlled at 5, 8, 10, 15, and 20 m/h, respectively. The values of DL in
differ-ent aqueous systems were calculated by using the Gnielinski correlations [10].
3. Results and discussion
3.1. Formation of complex salt
The pKa value of 2-MT, 11± 0.1, was determined by
Mahal and Mukherjee [1]. The low pKa value may
indi-cate that 2-MT, with the structure shown in Fig. 1, is almost completely present in molecular form without dissociation in the three solutions applied (i.e., SMT, e, SMT, 0.25, and
SMT, 6). Fig. 1 shows that 2-MT is an electron-pair donor
as the Lewis base, and may belong to the polydentate ligand because one 2-MT melecule has the electron donor prop-erties of not only N-atoms but also S-atoms [11]. Various initial concentrations (CMT, e,0) of 2-MT in the solution of
SMT, e were employed to examine the formation of metal
complexes. Both time variations of 2-MT concentrations (CMT, e) in the SMT, e solution in terms of 2-MT and TOC
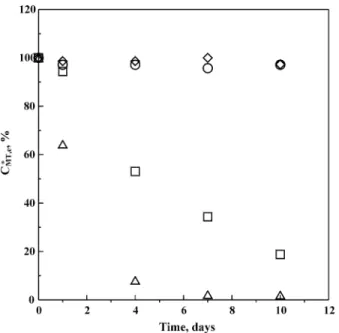
measured by HPLC and TOC analyzers, respectively, were studied. As shown in Fig. 2 for CMT, edetermined by HPLC,
the residual concentrations of 2-MT (CMT, e∗ = (CMT, e,0−
CMT, e)/CMT, e,0) strongly decreased with time for CMT, e,0
values higher than 2 g m−3, say 10 and 100 g m−3. How-ever, the time variations of CMT, e∗ in terms of TOC did not show any significant differences no matter how high the value of CMT, e,0was in this study. This may be because the
Cu(II) in the solution SMT, eforms metal chelate Schiff base
complexes with 2-MT (i.e., Lewis base, providing unshared electron pairs), which cannot be determined by HPLC analy-sis. In addition, an interesting phenomenon was discovered in the case of CMT, e,0= 250 g m−3, where the color of the
solution SMT, e(close system) was changed after two week
and some powdered precipitate was formed in the solution. Because Cu(II) is much difficult to be further oxidized to Cu(III) while fairly unstable in the environment, Cu(II) may be reduced to Cu(I) and then form neutral, water-insoluble complexes: [CuCl]s, or [Cu(2-MT)nCl]s when the Cl−acts
as the bridge [11]. One of the possible values of n is 2 (i.e.,
Fig. 2. Dependence of residual concentrations (CMT, e∗ ) of 2-mercaptothia-zoline (2-MT) molecules on time in the electroplating solution (Se) deter-mined by HPLC analyzer. Experimental data with initial concentrations of 2-MT (CMT, e,0) for 1 (!), 2 (E), 10 (1), and 100 g m−3(P), respec-tively. CMT, e∗ = (CMT, e,0− CMT, e)/CMT, e,0; CMT, e= concentration of 2-MT at time t .
Table 3
Ionic composition of F 400 impregnated in various solutions measured by energy disperse analysis of X-ray (EDAX)
Sample Ionic composition (wt%)
Al Si Fe S Cl Cu
Originala 17.05 35.87 8.47 36.67 1.93 –
Ab 7.08 18.10 6.04 41.44 15.29 11.33
Bc 9.31 16.23 3.82 39.13 14.74 16.76
aF 400 activated carbon analyzed by EDAX without any pretreatment. b F 400 impregnated in the solution S
ewith the ratio of 0.5 g/dm3for 7 days.
cF 400 impregnated in the solution SMT, ewith the ratio of 0.5 g/dm3 for 7 days, in which the concentrations of 2-MT is 50 g m−3.
[Cu(2-MT)2Cl]). According to a previous study [12], Cu(I)
may be coordinated by 2 S atoms, which are in the position of SH of two 2-MT molecules as illustrated in Fig. 1, and a Cl atom in the geometry of trigonal plane. Furthermore, be-tween Cl and two 2-MT molecules, two hydrogen bonds are held in the intermolecule. The clear and exact mechanism related to electron transfer reactions would need further ex-amination using a precise and delicate design.
3.2. Adsorption of copper ions
The ionic composition and EDAX spectra of F 400 sam-ples are listed in Table 3. The result for original activated carbon F 400 shows that the major bulk components are Al, Si, Fe, S, and Cl, with Si being the most abounding element. The F 400 impregnated in Se solution revealed that Cu(II)
was indeed adsorbed by F 400 in the solution of pH 0.25.
This may be because Cu(II) forms a coordination complex with the functional group on the F 400 surface so that the Cu(II) was not washed out with the distilled water. The pre-vious study [5] showed that when the pH value of the solu-tion was lower than 3, the amount of Cu(II) adsorbed from aqueous solution was very high and behaved like the type I phenomenon of the BET classification, which can be inter-preted as the adsorption of Cu(II) on F 400 being limited to a monolayer. Similar results were obtained when the F 400 was impregnated in SMT, e solution. For the latter two cases
with Seand SMT, e, the weight percentages of both S and Cl
on the sample surface increased, leading to the interpretation that the sulfate and Cl may also be adsorbed on F 400 due to the electrical neutralization in Seand SMT, esolutions.
How-ever, in solution SMT, e, additional phenomena may occur,
i.e., the adsorption of 2-MT and Cu(II) complex salt.
3.3. Adsorption behavior
For investigation of the adsorption behavior of 2-MT on F 400 in this study, the initial concentrations of 2-MT were smaller than 60 g m−3in order to ensure that no precipitation occurred in the aqueous system before the adsorption equi-librium was reached. The empirical Freundlich and Lang-muir isotherms, which correspond to the heterogeneous and homogeneous adsorbent surfaces, respectively, were used to correlate the experimental data as follows:
(1) qe= kFCe1/nF, (2) qe= QLKLCe 1+ KLCe .
In Eqs. (1) and (2), qe and Ce are the adsorbate
concen-trations in the solid and liquid phases at equilibrium, re-spectively. The kF and nF are the Freundlich isotherm
con-stants, which represent the adsorption capacity and strength of adsorption, respectively. QL and KL are the Langmuir
isotherm constants, in which the first one represents the monolayer adsorption capacity. The constants in the mod-els can be obtained by linearizing the above equations as follows: (3) ln qe= ln kF+ nFln Ce, (4) 1 qe= 1 QLKL 1 Ce + 1 QL .
The results are shown in Table 4 and Fig. 3.
As mentioned above, there are two types of adsorbates (i.e., 2-MT molecule and 2-MT complex) in the SMT, e
so-lution, while 2-MT molecules only exist in the solutions SMT, 0.25 and SMT, 6. Comparing the results in the range of
equilibrium concentrations (Ce) between 0 and 2 g m−3
in-dicates that the adsorption capacity (expressed by kF) of
2-MT on F 400 in SMT, e was greater than those in SMT, 0.25
and SMT, 6, but the reverse held for the strength of
adsorp-tion of nF of 2-MT on F 400. The higher kF values may
very effectively reduced when copper sulfate is present in SMT, e, while the lower nF may be attributed to the reason
that the unpaired ions of 2-MT are also compressed result-ing in low strength of adsorption. However, the experimental data show that there is not much difference of kF between
solutions of SMT, e and SMT, 0.25 compared to the solution
SMT, 6, in which the kF is much lower than those in SMT, e
and SMT, 0.25. It is obvious that kF for the adsorption of 2-MT
molecules on F 400 is much greater than for 2-MT com-plex no matter what kind of solution systems contains the 2-MT molecules. Comparing the Freundlich isotherm con-stants of 2-MT molecules (with Ceof 0–2 g m−3) and
com-plexes (with Ce of 0–40 g m−3) in SMT, e, the close nF but
very different kF values show that the adsorption strength
of 2-MT (molecules and complexes) on F 400 are similar. This may be due to the fact that the adsorption of 2-MT
Table 4
Isotherm parameters and correlation coefficients (r2) of 2-MT in various aqueous systems
Equilibrium concentration range: 0–2 g m−3
System kF (g(1F−1/n)kg−1m3/nF ) nF(–) rF2
SMT, e 230 1.5 0.9759
SMT, 0.25 202 3.3 0.9686
SMT, 6 84 2.1 0.9054
Equilibrium concentration range: 0–40 g m−3 System kF (g(1F−1/n)kg−1m 3/n F ) nF(–) rF2 SMT, e 18 1.58 0.9451 QL(g kg−1) KL(m3g−1) rL2 270 0.043 0.9791
molecules and complexes on F 400 surface is resulting from the hydrophobic attraction while the electrostatic repulsion reduces the adsorption capacity of 2-MT complex on the sur-face. Furthermore, the Cu(II) species adsorbed on the F 400 surface also have the same negative effect on 2-MT com-plexes. Therefore, the adsorption of 2-MT complexes on F 400 is not favorable in SMT, esolution.
Adsorption of organic matters onto activated carbon nor-mally occurs because of two major interactions: physical and chemical interactions, from which the former mainly refers to the size exclusion and microporosity effect and the latter chiefly concerns about the chemical nature of the adsorbent and adsorbate, and the composition of the solvent [7]. From the results of the SFB-reactor experiments, the liquid-phase diffusion coefficients (DL) of 2-MT molecule in three
solu-tions were 5.3× 10⁻¹⁰ m2/s in SMT, 6, 8.0× 10⁻¹⁰ m2/s
in SMT, 0.25, and 9.7× 10⁻¹⁰ m2/s in SMT, e, respectively,
in which the first was calculated using Wilke–Chang cor-relations [13]. Furthermore, if the Stokes–Einstein equation (DL = (kT )/6πµBR) is adopted to calculate the
hydro-dynamic diameter (R) of 2-MT in different solutions, the values of R in sequence are 2.8, 5.2, and 8.2 Å for the so-lutions SMT, e, SMT, 0.25, SMT, 6, respectively. It was expected
that the high adsorption potential of 2-MT of low molecular weight on F 400 can be obtained due to the high microp-orosity of the F 400. Comparing the ratios of the average diameter of the pore size (18 Å) to the hydrodynamic diam-eters (2.8, 5.2, and 8.2 Å) of the 2-MT in various solutions, it can be noted that at low concentrations 2-MT can access all the micropores of the F 400 in all three solutions. Thus, the adsorption of 2-MT at low concentrations does not result
Fig. 3. Adsorption isotherms of 2-MT molecule and complex in various solutions. Experimental data of 2-MT species in solutions of SMT, e(!), SMT, 0.25(1), and SMT, 6(E) with the equilibrium concentrations of 2-MT molecules in the range 0–2 g m−3. (P) Experimental data of 2-MT copper complex in SMT, e solution with equilibrium concentrations of 2-MT complex species in the range of 0–40 g m−3. (—), (- - -) data simulated by Freundlich and Langmuir isotherms (values of r2are indicated in Table 3).
in a steric hindrance inside the micropores, and, therefore, the size exclusion and microporosity effect may not affect the adsorption of 2-MT molecules inside the micropores of the F 400. However, the uptake of 2-MT molecules on F 400 from the solution SMT, 6 was indeed reduced very strongly.
A further comparison of the uptake of 2-MT molecules in SMT, eand SMT, 0.25with SMT, 6indicates that lower pH value
and higher ionic strength promote the uptake of 2-MT mole-cules on F 400. However, the addition of more copper sulfate (i.e., increase of the ionic strength) could not significantly enhance the adsorption of 2-MT molecules on F 400 when the pH of solution had the low value of 0.25.
When the 2-MT molecule formed metal–chelate Schiff base complexes (2-MT complex) in the SMT, e, the
adsorp-tion phenomena could be considered as an organic ion ad-sorbed on the surfaces of F 400. The F 400 surface acquired a positive surface charge by the adsorption of the ions onto the surface, due to the cause that the pH value of the solution is lower than pHPZC. Organic ions are electrostatically
re-pelled from the diffusion layer so that their concentration in the diffusion layer is lower than that in the bulk solution. An increase of the ionic strength of the bulk solution by the elec-trolyte not only increases the adsorption of organic ions (i.e., the surface excess) but also compresses the diffusion part of double layer [14]. The forces responsible for the adsorption of the organic ions may mainly be due to the noncoulom-bic force, such as dispersion forces, hydrogen bonding, and so on in SMT, e [14]. The ion exchange and surface
com-plexation formed by the 2-MT complex and the functional groups play minor roles in the adsorption of 2-MT complex on the mainly hydrophobic surface of the F 400. In addi-tion, the uptake of 2-MT complexes on F 400 is smaller in SMT, e, due to (1) the electrostatic repulsion between the
ad-sorbed 2-MT complexes, (2) the occupation of the surface by Cu(II), and (3) the occurrence of a positively charged surface when the pH of the solution was lower than pHPZC.
There-fore, the adsorption of 2-MT complex might be limited to the monolayer on the positively charged surface of F 400. It is noted that the Freundlich isotherm can often describe the experimental data satisfactorily in a small concentration range. However, when the Langmuir isotherm well describes the experimental results by comparing the values of the cor-relation coefficients, this implies that the adsorption of the adsorbate on the adsorbent is likely limited to the monolayer. As a result, it is concluded that the adsorption of 2-MT com-plex onto the positively charged surface of F 400 might be limited to a monolayer.
4. Conclusions
The formation of metal–chelate Schiff base complexes (i.e., 2-mercaptothiazoline copper complex, 2-MT complex) in the electroplating solution (Se) has been demonstrated
by analyzing the samples with HPLC and TOC analyzers when the initial concentration of 2-MT in Se was greater
than 2 g m−3. Therefore, two types of adsorbates (i.e., 2-MT molecule and 2-MT complex) have to be assumed in the solution SMT, e, while only 2-MT molecules exist in the
solu-tions SMT, 0.25and SMT, 6. In addition, electron transfer
reac-tions may occur in the system to reduce Cu(II) to Cu(I) and then form neutral, water-insoluble complexes. The EDAX spectra of activated carbon F 400 show that the major bulk components are Al, Si, Fe, S, and Cl, with Si being the most abounding element. In addition, Cu(II) can be adsorbed onto F 400 in the solution Seat pH 0.25 due to the formation of a
coordinate complex with the functional group on the F 400 surface.
Adsorption of 2-MT on F 400 demonstrates that the adsorption capacity for 2-MT molecules in sequence is SMT, e= SMT, 0.25> SMT, 6in the range of equilibrium
con-centrations between 0 and 2 g m−3. The 2-MT complexes exhibit the smallest uptake by F 400. The excellent applica-bility of the Langmuir isotherm to experimental data indicate that the adsorption of 2-MT complexes on F 400 might be limited to a monolayer. The adsorption strength of 2-MT molecules and complexes on F 400 result from their sim-ilar hydrophobic attraction. The adsorption capacity of the former was much greater than that of the latter due to the electrostatic repulsion of 2-MT complexes on the surface which inhibit the adsorption of 2-MT complexes on F 400 in a SMT, esolution.
The hydrodynamic diameters (R) of 2-MT in various so-lutions calculated by Stokes–Einstein equation are 2.8, 5.2, and 8.2 Å for the solutions SMT, e, SMT, 0.25, SMT, 6,
respec-tively. A high adsorption capacity of 2-MT of low molecular weight onto F 400 can be obtained due to high microporosity and nonsteric hindrance, so that physical interaction does not play an important role in adsorption of 2-MT molecules on F 400 in this study. Lower pH value and higher ionic strength promote the uptake of 2-MT molecules on F 400, while the uptake of 2-MT complexes on F 400 was restrained by electrostatic repulsion. Thus, the chemical interactions are significant and predominant over the physical interactions with respect to the adsorption capacity of 2-MT molecules on F 400.
Acknowledgment
The authors thank the Powder Technology Laboratory of the Chemical Engineering Department of the National Tai-wan University for assistance in powder characterization.
Appendix A. Nomenclature
AC Activated carbon
ACS Anthraquinone-2-sulfonate
as Specific external surface area (m2/kg)
BET The specific surface area obtained following the Brunauer, Emmett, and Teller theory
Ce Adsorbate concentration in the liquid phase at equi-librium with qe(g m−3) CMT Concentration of 2-MT CMT, e CMTin SMT, esolution at time t CMT, e,0 CMT, eat time= 0 CMT, e∗ (CMT, e,0− CMT, e)/CMT, e,0
DL Liquid diffusivity, liquid diffusion coefficient
(m2/s)
dp Mean particle size (mm)
EDAX Energy dispersive analysis of X-rays F 400 Chemviron Filtrasorb 400
fβ Correction factor for particle shape (ratio of
exper-imental to correlation values of βLas= (βLas)exp/
(βLas)cor)
GAC Granular activated carbon
k Boltzmann constant, 1.381× 10⁻²³J K−1
kF Freundlich isotherm constant as specified in Eq. (1)
KL Langmuir isotherm constant as specified in Eq. (2)
MP Micropore
2-MT 2-mercaptothiazoline
nF Freundlich isotherm constant as specified in Eq. (1)
PAC Powder activated carbon PNP p-Nitrophenol
pHPZC pH value at the point of zero charge
qe Adsorbate concentration in solid phase at
equilib-rium with Ce(mg/g or mol/kg)
QL The monolayer adsorption capacity as specified in
Eq. (2)
R Solute radius, hydrodynamic radius, equivalent ra-dius (Å)
r2 Correlation coefficient Se Electroplating solution
SMT, e, Aqueous solutions with different compositions as
SMT, 0.25, specified in Table 2
SMT, 6
SFB Short fixed-bed
T Absolute temperature (K) TOC Total organic carbon
t Adsorption time or elapsed time (h) ZPC Zero point charge
βL Film mass transfer coefficient gained from SFB
re-actor (m/s)
βLas Specific value of βL(m3/s/kg)
(βLas)exp, βLas obtained by experiments and correlation
(βLas)cor
εp Adsorbent porosity
εF Filter bed voidage
µ Dynamic viscosity (cp)
µB µ of solvent (cp)
µw µ of water (cp)
υ Kinetic viscosity (µ/ρ, m2/s) ρ Density (kg/m3)
ρF Filter bed layer density (kg/m3)
ρp Apparent particle density (kg/m3)
ρs Average true particle density (kg/m3)
References
[1] H.S. Mahal, T. Mukherjee, Radiat. Phys. Chem. 54 (1999) 29. [2] C.L. Fang, General Concepts of Additives in the Electroplating
Solu-tion, Finishing Science PublicaSolu-tion, Taipei, 1996.
[3] H. Sontheimer, J.C. Crittenden, R.S. Summers, Activated Carbon for Water Treatment, DVGW-Forschungsstelle, Karlsruhe, 1998. [4] C.F. Chang, C.Y. Chang, W.T. Tsai, J. Colloid Interface Sci. 232 (2000)
207.
[5] R.C. Bansal, J.B. Donnet, F. Stoeckli, Active Carbon, Dekker, New York, 1988.
[6] R. Isabel, Temperature Dependence of the Kinetics of Activated Car-bon Adsorption, internship work performed at Heinrich-Sontheimer-Laboratory, DVGW-Technologiezentrum Wasser, Karlsruhe, 1998. [7] T. Karanfil, J.E. Kilduff, Environ. Sci. Technol. 33 (1999) 3217. [8] C.F. Chang, A Study on the application of activated carbon for the
re-moval of organic additives from simulated printed wiring electroplat-ing solution, Ph.D. dissertation, Graduate Institute of Environmental Engineering, National Taiwan University, Taipei, 2002.
[9] F.T. Lange, M. Wenz, H.-J. Brauch, J. High Resolution Chromatogr. 18 (1995) 243.
[10] V. Gnielinski, Verfahrenstechnik 12 (6) (1978) 363.
[11] A.C. Cotton, G. Wilkinson, C.A. Murillo, M. Bochmann, Advanced Inorganic Chemistry, 6th ed., Wiley, New York, 1999.
[12] M. Maekawa, S. Kitagawa, Y. Nozaka, M. Munakata, T. Kurodasowa, Anal. Sci. 9 (6) (1993) 887–888.
[13] C.R. Wilke, P. Chang, Am. Inst. Chem. Eng. J. 1 (2) (1955) 264. [14] F.F. Cantwell, Ion Exch. Sol. Extract. 9 (1985) 339.