Bacterial alterations in salivary
microbiota and their association in
oral cancer
Wei-Hsiang Lee
1,2,3, Hui-Mei Chen
3, Shun-Fa Yang
1,4, Chao Liang
3, Chih-Yu Peng
5,6, Feng-Mao
Lin
3, Lo-Lin Tsai
5,6, Buor-Chang Wu
5,6, Chung-Han Hsin
7,8, Chun-Yi Chuang
7,8, Ting Yang
3,
Tzu-Ling Yang
3, Shinn-Ying Ho
2,3, Wen-Liang Chen
2, Kwo-Chang Ueng
1, Hsien-Da Huang
2,3,
Chien-Ning Huang
4,9& Yuh-Jyh Jong
2,10,11Oral squamous cell carcinoma (OSCC) is the most common malignant neoplasm of the oral cavity and the fourth leading malignancy and cause of cancer-related death in the male population of Taiwan. Most cases are detected at advanced stages, resulting in poor prognosis. Therefore, improved detection of early oral health disorders is indispensable. The involvement of oral bacteria in inflammation and their association with OSCC progression provide a feasible target for diagnosis. Due to the nature of oral neoplasms, the diagnosis of epithelial precursor lesions is relatively easy compared with that of other types of cancer. However, the transition from an epithelial precursor lesion to cancer is slow and requires further and continuous follow-up. In this study, we investigated microbiota differences between normal individuals, epithelial precursor lesion patients, and cancer patients with different lifestyle habits, such as betel chewing and smoking, using next-generation sequencing. Overall, the oral microbiome compositions of five genera, Bacillus, Enterococcus, Parvimonas, Peptostreptococcus, and Slackia, revealed significant differences between epithelial precursor lesion and cancer patients and correlated with their classification into two clusters. These composition changes might have the potential to constitute a biomarker to help in monitoring the oral carcinogenesis transition from epithelial precursor lesion to cancer.
Oral cancer ranks sixth among the most common cancers worldwide, with specifically high prevalence rates in Europe, Melanesia, and Southcentral Asia1. In 2011, the 5-year survival rate for oral cancer patients was only
60% in the United States2, and it became the sixth most common cancer in Taiwan and the fourth most common
cancer among Taiwanese males3. Despite recent advances in the multidisciplinary treatment of oral cancer, the
prognosis of patients with locally advanced disease and the relapse rate of disease-free patients remain unsatisfac-tory4. Therefore, an improved understanding of the cellular and molecular events that initiate oral tumours and
promote metastasis is being pursued5.
Oral habits, such as betel quid chewing, alcohol consumption, and cigarette smoking, have been documented as risk factors for oral cancer6,7. Reports have confirmed transitions from epithelial precursor lesion (leukoplakia,
oral submucosal fibrosis, and others) to cancer over time8–10. Accordingly, habitual cigarette smokers, alcohol
1Department of Medical Research, Chung Shan Medical University Hospital, Taichung, 402, Taiwan. 2Department of
Biological Science and Technology, National Chiao Tung University, Hsinchu, 300, Taiwan. 3Institute of Bioinformatics
and Systems Biology, National Chiao Tung University, Hsinchu, 300, Taiwan. 4Institute of Medicine, Chung Shan
Medical University, Taichung, 402, Taiwan. 5School of Dentistry, Chung Shan Medical University, Taichung, 402,
Taiwan. 6Department of Dentistry, Chung Shan Medical University Hospital, Taichung, 402, Taiwan. 7School of
Medicine, Chung Shan Medical University, Taichung, 402, Taiwan. 8Department of Otolaryngology, Chung Shan
Medical University Hospital, Taichung, 402, Taiwan. 9Department of Internal Medicine, Division of Endocrinology
and Metabolism, Chung Shan Medical University Hospital, Taichung, 402, Taiwan. 10Graduate Institute of Clinical
Medicine, College of Medicine, Kaohsiung Medical University, Kaohsiung, 807, Taiwan. 11Departments of Paediatrics
and Laboratory Medicine, Kaohsiung Medical University Hospital, Kaohsiung Medical University, Kaohsiung, 807, Taiwan. Wei-Hsiang Lee, Hui-Mei Chen and Shun-Fa Yang contributed equally to this work. Correspondence and requests for materials should be addressed to H.-D.H. (email: bryan@mail.nctu.edu.tw) or C.-N.H. (email: cshy049@ gmail.com) or Y.-J.J. (email: yjjongnctu@gmail.com)
Received: 2 February 2017 Accepted: 10 November 2017 Published: xx xx xxxx
consumers, and betel quid chewers should receive regular oral screening so that potential oral cancer and epithe-lial precursor lesions can be detected as early as possible. Helicobacter pylori is the first conventionally recognised bacterial carcinogen11; another correlation between pathogenic bacteria and oral disease is Porphyromonas
gingi-valis infection and periodontitis12. Moreover, oral microbiota alterations have been detected in alcohol13, betel14,
and cigarette15,16 consumers. Hence, the link between oral cancer-inducing factors and bacterial ecology should
not be neglected.
Most oral cancers are oral squamous cell carcinomas (OSCCs)17. The association of bacteria with
OSCC progression can be explained by inflammation-induced DNA damage in epithelial cells caused by microorganism-secreted endotoxins18,19. Scientists searched for a correlation between microbes and oral
can-cer even before the availability of high-throughput technologies. Some specific species have been identified to correlate strongly with OSCC, such as Porphyromonas gingivalis, Fusobacterium nucleatum, and Prevotella intermedia20–24. Researchers have also found that specific bacterial taxa, such as Veillonella, Fusobacterium,
Prevotella, Porphyromonas, Actinomyces, Clostridium, Haemophilus, Enterobacteriaceae, and Streptococcus spp., are linked to oral cancer and epithelial precursor lesions25. Another work identified increased abundance
lev-els of Capnocytophaga gingivalis, Prevotella melaninogenica, and Streptococcus mitis in the saliva of individuals with OSCC23,26. Hooper et al. (2007) reported 52 different bacterial phylotypes from tumour tissues using
fluo-rescent in situ hybridisation and 16S rRNA sequencing, including Proteobacteria, Fusobacterium, Streptococcus, Prevotella, and Veillonella27. Thus, the salivary microbiota could be a diagnostic indicator of patients with OSCC
compared with OSCC-free controls24,28.
Although some species are correlated with oral cancer, the complexity of the cancer-driving conditions associated with the microbiome remains unexplained by a single pathogen. High-throughput assays such as next-generation sequencing (NGS) offer comprehensive culture-free techniques for surveying human micro-biome composition and biomolecular activity at the transcriptional level29–32. Studies have used NGS to obtain
complete (cultured and uncultured) bacterial profiles in OSCC subjects and have identified enrichments of the species Peptostreptococcus stomatis and Streptococcus gordonii at tumour sites33 and significantly lower abundance
levels of Firmicutes (especially Streptococcus) and Actinobacteria (especially Rothia) in cancer samples34.
Saliva is in direct contact with oral cancer and epithelial precursor lesions; hence, abnormal DNA, RNA, and protein molecules released by malignant cells can be easily obtained from saliva. The use of saliva as a diag-nostic target may avoid unnecessary biopsies and hospital and outpatient clinical visits; it offers an inexpensive, non-invasive, and easily accessible early detection and prognosis tool, and it allows for monitoring post-therapy in oral cancer patients32,35–37. We propose to combine NGS and bioinformatics with a less invasive method of
collecting reliable specimens and to use changes in oral microbiome composition as an alert regarding oral health disorders that might lead to oral cancer.
Results
Characteristics of the study population.
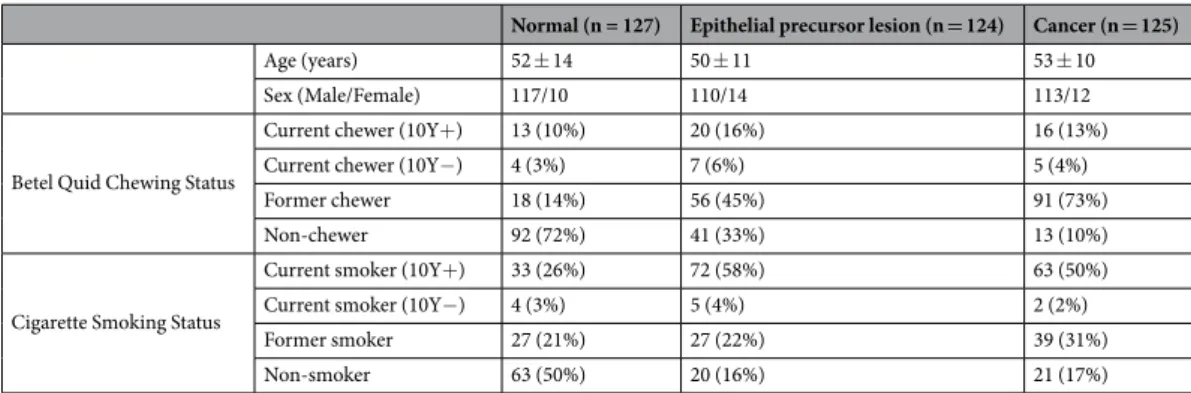
A total of 376 individuals were enrolled in the study. Based on diagnostic results, they were classified into three groups: Normal (127), Epithelial precursor lesions (includ-ing dysplasia, hyperplasia, and hyperkeratosis38,39; (124), and Cancer (125). Individuals from the Normal groupshowed neither epithelial precursor lesions nor oral cancer, those in the Epithelial precursor lesion group showed epithelial precursor lesions, and those in the Cancer group had OSCC. For the sake of convenience, in this study, the terms “normal individuals” and “healthy individuals” are employed interchangeably. In addition, non-smok-ers and non-chewnon-smok-ers were defined as individuals who had no history of cigarette smoking and betel quid chewing, respectively, prior to having their saliva samples taken. The patient history in terms of TNM classification for cancer patients is presented in Supplementary Tables S1 and S2. The diagnostic results, together with the betel quid chewing and cigarette smoking statuses, are presented in Table 1. The number of both non-smokers and non-chewers was 85, of whom 72.9% (62/85) were normal, 16.5% (14/85) were patients with epithelial precursor lesions, and 10.6% (9/85) had OSCC (Table S3). The number of current chewers who were non-smokers was only five; most subjects were former or current chewers/smokers (Tables S4 and S5). For example, the number of former or current chewers was 230, of whom 15.2% (35/230) were normal, 36.1% (83/230) were patients with epithelial precursor lesions, and 48.7% (112/230) had OSCC. Of the 83 former/current chewers in the Epithelial precursor lesion group, 67.5% (n = 56) were current chewers, whereas of the 112 former/current chewers in the
Normal (n = 127) Epithelial precursor lesion (n = 124) Cancer (n = 125)
Age (years) 52 ± 14 50 ± 11 53 ± 10
Sex (Male/Female) 117/10 110/14 113/12
Betel Quid Chewing Status
Current chewer (10Y+) 13 (10%) 20 (16%) 16 (13%)
Current chewer (10Y−) 4 (3%) 7 (6%) 5 (4%)
Former chewer 18 (14%) 56 (45%) 91 (73%)
Non-chewer 92 (72%) 41 (33%) 13 (10%)
Cigarette Smoking Status
Current smoker (10Y+) 33 (26%) 72 (58%) 63 (50%)
Current smoker (10Y−) 4 (3%) 5 (4%) 2 (2%)
Former smoker 27 (21%) 27 (22%) 39 (31%)
Non-smoker 63 (50%) 20 (16%) 21 (17%)
Cancer group, up to 82% were former chewers (n = 91) (Table S3). Hence, the proportions of current or for-mer smokers/chewers in the Epithelial precursor lesion and Cancer groups were high. We also found that both non-smokers and non-chewers in the Cancer and Epithelial precursor lesion groups tended to be older (Fig. S1). For the sake of convenience, the following symbols are used to indicate the patient groups: B−, non-chewer; B*, former chewer; B+, current chewer; C−, non-smoker; C*, former smoker; and C+, current smoker. Based on the number of persons and their betel quid chewing and cigarette smoking statuses, each group was classified into six subgroups: B−C−, B−C*, B−C+, B* C*, B* C+, and B+C+.
Five predominant phyla in saliva samples.
Based on the available samples, 15,392,451 sequencing reads were aligned, identifying an average of 40,937 sequencing reads per sample. We sorted the sequences into 548 operational taxonomic units (OTUs, ≥ 97% ID). Although microbial variability at the phylum level can-not explain individual differences, we could roughly distinguish different microbiotas within the subgroups (Fig. S2). In our samples, the dominant bacterial species belonged to one of five phyla: Firmicutes, Bacteroidetes, Proteobacteria, Actinobacteria, and Fusobacteria. These phyla were present in all individuals, with minor var-iations among groups. Firmicutes was the predominant phylum in each subgroup, and Bacteroidetes was the second most abundant phylum in most subgroups. Coincidentally, Bacteroidetes displayed the same relative abundance levels within the B−C− subgroup in all three patient groups. In addition, the relative abundance levels of Firmicutes, Bacteroidetes, and Proteobacteria were similar in the B−C* subgroup of Epithelial precursor lesion patients.α-Diversity at the genus level.
To summarise the diversity of the genera constituting the individuals’ microbiotas, we measured the species richness (the total number of species in the community) and the Shannon diversity index. Generally, the Shannon diversity index increases as species richness increases. In our samples, the correlation coefficient between species richness and the Shannon diversity index within subgroups varied widely (Fig. 1). For example, in the B+C+ subgroup, the coefficient was as high as 0.7 for the Normal group, whereas it declined to 0.37 and 0.48 for patients with epithelial precursor lesions and OSCC, respectively. The B−C+ subgroup showed a similar pattern. In the B* C* subgroup, the coefficients were 0.42 for healthy controls and 0.7 for the other subgroups. Interestingly, in the B−C* subgroup, the correlation between species richness and the Shannon diversity index for healthy controls was very weak. In contrast, the correlation coefficient for Epithelial precursor lesion patients was as high as 0.8. Given that there was only one non-chewer and former smoker in the Cancer group, we could not determine the correlation between species richness and the Shannon diversity index. There were no statistically significant differences between any subgroups in the Normal and Epithelial pre-cursor lesion groups except for species richness between the B−C− and B−C* subgroups in the Normal group (Table S6).Considering that the Shannon diversity index within groups was approximately 2.5, the bacterial com-munities within individuals’ saliva samples were dominated by approximately 13 genera. We selected the top 15 genera from the average sum of relative abundance in the three groups and preliminarily observed their relationships (Fig. S3). The three groups shared the same top 14 genera, arranged in slightly different orders: Prevotella, Veillonella, Streptococcus, Neisseria, Rothia, Fusobacterium, Haemophilus, Actinomyces, Leptotrichia, Porphyromonas, Bacillus, Selenomonas, Carnobacterium, and Eubacterium. Among these genera, Prevotella was the most predominant in all groups. The fifteenth genus corresponded to Megasphaera, Escherichia, and Atopobium in the Normal, Epithelial precursor lesion, and Cancer groups, respectively.
Based on cigarette smoking and betel quid chewing statuses, the distribution of the top 15 genera differed slightly within the groups (Fig. S3). For instance, in the Normal group, the relative abundance of Prevotella was lower in the B* C* subgroup than in the other subgroups, whereas in the B* C+ subgroup, the opposite was true. According to principal component analysis based on the top 10 genera, there was no separate clustering between the groups (Fig. S4). Nevertheless, within non-chewers, the correlation between Prevotella and the other genera was almost negative in the Normal group (Fig. S5), whereas Prevotella was positively correlated with Leptotrichia in the Epithelial precursor lesion group (Fig. S6). Furthermore, strong positive correlations were evident between Prevotella and Veillonella and between Prevotella and Leptotrichia within both current smokers and chewers (Fig. S7). Further conditions are presented in Supplementary Figure S8. Microbiota compositions at the genus level within individuals’ saliva samples are presented in Supplementary Figures S9–S11.
Biodiversity comparisons between groups and relationships between specific genera.
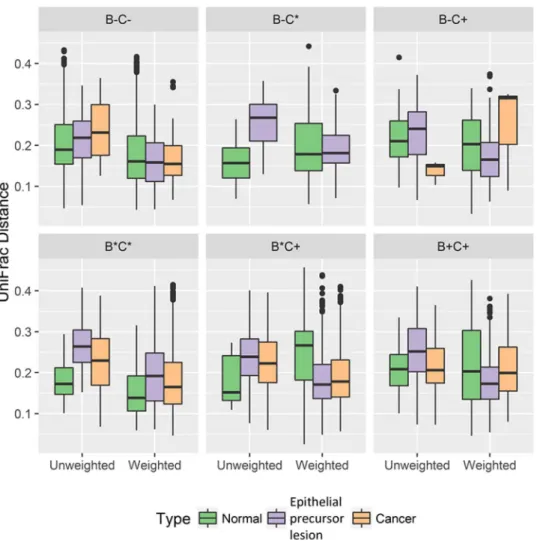
To assess the diversity among groups, we evaluated the UniFrac distance metric, which measures the evolutionary distance between microbiotas. Due to the sample size, P values were measured using the Wilcoxon rank-sum test. Most conditions revealed statistically significant differences between any two subgroups (Fig. 2, Table S7), par-ticularly for former chewers and current smokers. Using the multidimensional scaling method for UniFrac phy-logenetic distances, we also found that the samples did not cluster separately into groups or subgroups. Instead, unweighted UniFrac distance analysis revealed that the distribution was more concentrated in the Normal group than in patients with OSCC or epithelial precursor lesions (Fig. 3). According to multi-response permutation procedures (MRPPs), the differences between groups were small, even if statistically significant (P < 0.001). We also found statistically significant (P < 0.001) differences between subgroups classified according to betel quid chewing status but not with respect to cigarette smoking status.The number of genera identified in the study was 200. We first selected 83 genera considering that a genus should be present in at least 21% of all individuals. Then, a network was built using SparCC correlation coeffi-cients. All nodes of the networks with coefficients in the top 60 absolute values of SparCC correlation coefficients for each population are shown (Figs 4 and 5). Their ranges were 0.339–0.622, 0.464–0.753, and 0.428–0.701 in the
Normal, Epithelial precursor lesion, and Cancer groups, respectively. Finally, 35, 31, and 35 genera were identified in the networks of the Normal, Epithelial precursor lesion, and Cancer groups, respectively. To aid interpreta-tion, nodes are coloured according to their phylum. Interestingly, Megasphaera correlated negatively with both Porphyromonas and Streptococcus among healthy controls; however, in the remaining groups, the correlation coefficients’ top 60 absolute values were all positive. Furthermore, nine bacteria, Alistipes, Bacteroides, Blautia, Clostridium, Dorea, Escherichia, Faecalibacterium, Megamonas, and Phascolarctobacterium, displayed positive correlations with each other in the Epithelial precursor lesion and Cancer groups.
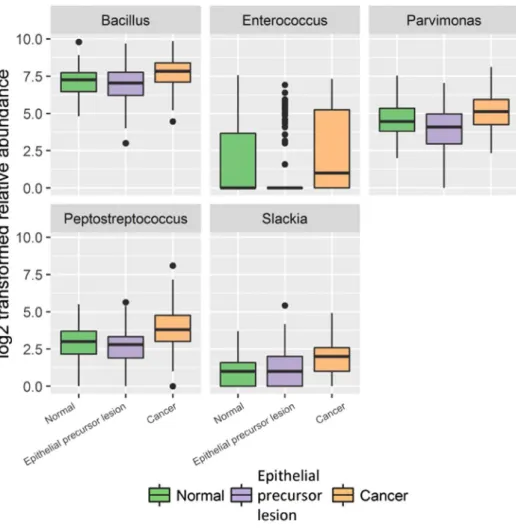
Next, we compared P values for 83 genera of bacteria between the patient groups based on cigarette smoking and betel quid chewing status. Given that the ages of non-smokers and non-chewers ranged widely among the healthy controls and that their minimum age among OSCC patients was 55 years, we limited the age of healthy controls to 55 years or older (Additional File 1). Accordingly, in the B−C− subgroup, seven genera, Filifactor, Fretibacterium, Lachnoanaerobaculum, Megasphaera, Mycoplasma, Peptostreptococcus, and Tannerella, were pres-ent in nearly all samples, with statistically significant differences between the Normal and Cancer groups. Ten genera revealed significant differences between the Normal and Cancer groups (Figs S12 and S13). Regarding the Epithelial precursor lesion and Normal groups, patients with epithelial precursor lesions could be classified into two parts by 31 genera (Fig. S14, Additional File 2). We also found that five genera, Bacillus, Enterococcus, Parvimonas, Peptostreptococcus, and Slackia, exhibited significant differences between the Epithelial precursor lesion and Cancer groups, roughly classifying these patients into two clusters (Figs 6 and 7, S15, and Additional File 3).
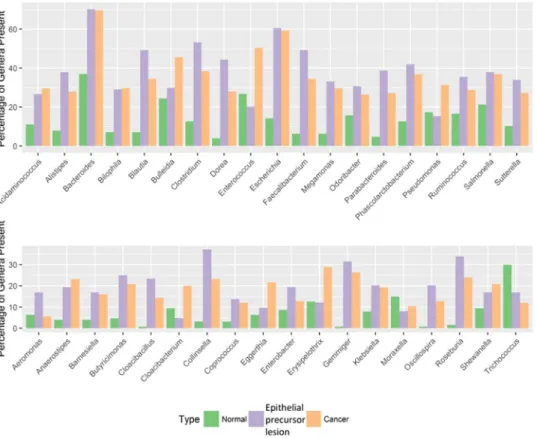
We further examined 37 genera of bacteria that met the following conditions: 1) the genus was present in 11–59% of samples from one patient group, and 2) the genus was more than twice as abundant in that group than in any other group (Fig. 8). We found that Bacteroides and Escherichia were present at over 60% in the Epithelial precursor lesion and Cancer groups but at only 37% and 14.2%, respectively, in the Normal group. In addition, Figure 1. Correlations between species richness and Shannon diversity index within subgroups. In the B+C+ subgroup, the coefficient is as high as 0.7 for the Normal group, whereas it declines to 0.37 and 0.48 for patients with epithelial precursor lesions and OSCC, respectively. The B−C+ subgroup shows a similar pattern. In the B* C* subgroup, the coefficients are 0.42 for the Normal group and 0.7 for the other subgroups. In the B−C* subgroup, the correlation between species richness and the Shannon diversity index for the Normal group is very weak.
Figure 2. Boxplots of UniFrac (unweighted and weighted) distances between salivary microbial communities using the entire phylogenetic tree. Most conditions revealed statistically significant differences between any two subgroups, particularly for the B* C+ subgroup, in which p values for unweighted or weighted UniFrac distances were all less than 0.03.
Figure 3. Multidimensional scaling ordination plot of salivary bacterial communities based on the unweighted UniFrac distance metric. Individuals are represented by points. Although the samples did not cluster separately based on groups or subgroups, the distribution in oral cancer patients was more concentrated than that in healthy controls or patients with epithelial precursor lesions.
the percentages of Bulleidia were similar in the Normal and Epithelial precursor lesion groups, whereas it was approximately 46% in the Cancer group. Furthermore, the four genera Blautia, Dorea, Faecalibacterium, and Phascolarctobacterium were present in 49.2%, 44.4%, 49.2%, and 41.9%, respectively, of the Epithelial precursor lesion subjects; however, they were present in less than 13% of the Normal subjects. Indeed, these four genera displayed strong positive correlations with respect to network analysis (Fig. 8). Notably, Cloacibacillus, Gemmiger, Oscillospira, and Roseburia were 20 times more abundant in Epithelial precursor lesion and Cancer patients than in Normal subjects, in whom the sum of the relative abundance for each one was less than three. In addition, other poorly abundant genera might also be associated with epithelial precursor lesions or OSCC.
Discussion
The purpose of the present investigation was to compare the unstimulated salivary microbial profiles of patients with epithelial precursor lesions, patients with oral cancer, and normal controls. The results from this investi-gation demonstrated that correlation networks of salivary microbiota were remarkably varied within the three groups and that five genera – Bacillus, Enterococcus, Parvimonas, Peptostreptococcus, and Slackia – indicated sig-nificant differences between the Epithelial precursor lesion and Cancer groups.
In our study, most oral cancer patients were former or current chewers, as were patients with epithelial pre-cursor lesions. This finding is consistent with early reports that betel quid chewing is a major causal agent of oral cancer3,40. That is, a small proportion of individuals were non-chewers and non-smokers within the Epithelial
precursor lesion and Cancer groups. The number of both non-chewers and non-smokers was 14 in the Epithelial precursor lesion group, of whom 8 were female and 6 were male. However, in the Cancer group, 7 of 9 patients who were non-smokers and non-chewers were female, and these females were all non-drinkers. This result is in accord with recent research reporting that non-chewers and non-smokers among oral cancer patients tends towards a higher proportion of females, but the cause of this phenomenon is still unclear41.
Our high-throughput NGS platform successfully identified more than 500 species, including cultured and uncultured strains, using saliva, which is a source with low sensitivity. This large dataset represents a signifi-cant improvement compared with the approximately 50 strains detected using traditional experimental methods. Due to the nature of oral neoplasms, the diagnosis of an epithelial precursor lesion is relatively easy compared with that of other types of cancer. However, the transition from epithelial precursor lesion to cancer is slow and requires further and continuous follow-up. Microbial community changes (Bacillus, Enterococcus, Parvimonas, Peptostreptococcus, and Slackia) in the saliva might represent a convenient marker for the prediction, detection, and prognosis of oral cancer, especially the epithelial precursor lesion-cancer transition. Furthermore, in the Figure 4. Network analysis of salivary microbiota using SparCC correlation coefficients (Normal group). The figure shows networks between abundant sequences at the genus level built from SparCC correlation coefficients. The nodes represent genera of bacteria; the edges represent the correlation coefficients between genera. The edges are coloured green for negative correlations and red for positive correlations. Nodes of networks are shown when their correlation coefficients are in the top 60 absolute values of the correlation coefficients. In this figure, the number of nodes is 35, and the range of the absoulte values of the correlation coefficients is from 0.339 to 0.622. Nodes are coloured according to their phylum.
genus-level sequence abundance network analysis from SparCC correlation coefficients, we identified at least 9 bacteria – Alistipes, Bacteroides, Blautia, Clostridium, Dorea, Escherichia, Faecalibacterium, Megamonas, and Phascolarctobacterium – that displayed positive correlations with each other in the Epithelial precursor lesion and Cancer groups. Additionally, a very different positive/negative correlation network was detected in the Normal group, suggesting the presence of a community alteration with disease. These correlations may suggest that the microbial community in saliva changes in a group manner and that we should study these alterations in groups, which could result in the identification of various combinations of bacteria correlated with oral cancer and lial precursor lesions. In conclusion, we systematically investigated microbiota changes between normal, epithe-lial precursor lesion, and oral cancer patients and report that five genera revealed significant differences between the Epithelial precursor lesion and Cancer groups. The present study demonstrates that changes in microbiota composition might have the potential to be used as a biomarker for predicting the pathologic development tran-sition of oral epithelial precursor lesion to cancer. Oral health conditions were not included in this study since large numbers of oral cancer and epithelial precursor lesion patients in Taiwan are betel quid consumers. The habit of regular betel chewing usually causes health problems in the oral cavity, such as periodontitis. Therefore, even the normal controls recruited in this study had a certain percentage of betel quid consumers, which actually reflects the reality of the composition of patients visiting oral and dental medical centres in Taiwan’s hospitals. We designed this study in an attempt to develop a tool to help physicians of practical medicine who encounter patients with different life habits. We will try to collect more healthy controls and patients without the habits of betel chewing or smoking for more precisely defined healthy controls to eliminate the influences of betel chewing and smoking. Future studies should include larger numbers of samples collected prospectively from multiple hospitals and should investigate the association between microbiota changes and the clinicopathological charac-teristics of oral cancer.
Methods
Ethics approval and consent to participate.
The study was reviewed and approved by the Ethics Committee of Chung Shan University Hospital (CSMUH No: CS13214). All of the methods were performed in accordance with relevant guidelines and regulations, including any relevant details. Informed consent was obtained from the patients and was approved by the Institutional Review Board.Figure 5. Network analysis of salivary microbiota using SparCC correlation coefficients [Epithelial precursor lesion (A) and Cancer groups (B)]. (A) The number of nodes is 31, and the absolute values of the correlation coefficient range from 0.464 to 0.753. Indeed, these correlations are all positive. (B) The number of nodes is 35, and their correlation coefficients range from 0.428 to 0.701. In general, these two networks seem to be similar, but the genus Parvimonas is only present in the cancer network.
Patients and sample collection.
The aim of the study was to identify possible correlations between life-style habits and microbiome composition in individuals with OSCC. All participants were patients from Chung Shan Medical University Hospital, Taichung, Taiwan between 2014 and 2015. Overall, the dataset comprised 376 Figure 6. Boxplots of relative abundance levels for five genera among the Normal, Epithelial precursor lesion, and Cancer Populations. The five genera Bacillus, Enterococcus, Parvimonas, Peptostreptococcus, and Slackia revealed significant differences between the Epithelial precursor lesion and Cancer populations. Except for Enterococcus, the others are present in almost all samples.Figure 7. Principal component analysis for five genera: Bacillus, Enterococcus, Parvimonas, Peptostreptococcus and Slackia. The five genera Bacillus, Enterococcus, Parvimonas, Peptostreptococcus, and Slackia revealed significant differences between the Epithelial precursor lesion and Cancer populations. These genera seem to roughly classify patients into two clusters. Points represent individuals.
human saliva samples, including 125 cases of OSCC; 124 cases of epithelial precursor lesion with histopatholog-ical evidence of dysplasia, hyperplasia, or hyperkeratosis; and 127 normal controls with no malignant disease in the oral cavity. Patients with only primary untreated OSCC, including chemotherapy or radiotherapy, were recruited. Patients and normal controls with any history of diabetes mellitus or immune system-related disease were excluded. All individuals were free of antibiotic therapy for three months prior to the study. Saliva samples (5 mL) from each participant were collected unstimulated, at least 1 h after eating, drinking, or smoking; or after mouth rinsing and waiting for 10 min before saliva collection if the patient ate within one hour42. Saliva samples
were collected in test tubes and stored at −80 °C. The patients completed a questionnaire to disclose information regarding sex, age, alcohol consumption, betel chewing, cigarette smoking, and family history of cancer.
DNA extraction.
DNA was extracted directly from saliva using the QIAamp DNA Blood Mini kit (Qiagen, USA). Each sample was transferred to a 1.5-mL microcentrifuge tube and centrifuged at 18,000 × g for 2 min to pellet the bacteria. The pellets were re-suspended and then treated with lysozyme in enzyme solution (20 mM Tris-HCl, pH 8.0; 2 mM EDTA; 2% SDS) at 37 °C and proteinase K in buffer AL at 56 °C and 95 °C. Extraction was performed following the manufacturer’s protocol using a QIAamp spin column. The DNA was eluted with 50 μL of Buffer AE. All samples were centrifuged at 18,000 × g for 1 min, the DNA concentration was measured with a NanoPhotometer®
(Implen, Germany), and the samples were stored at −20 °C until further analysis.Library construction and sequencing of the 16S ribosomal DNA (rDNA) V4 region.
The PCR primer pair F515 (5′-GTGCCAGCMGCCGCGGTAA-3′) and R806 (5′-GGACTACHVGGGTWTCTAAT-3′) was designed to amplify the V4 region of bacterial 16S rDNA as previously described43. PCR amplification wasperformed in a 50-μL reaction volume containing 25 μL of 2× Taq Master Mix (Thermo Scientific, USA), 0.2 μM of each primer, and 20 ng of DNA template. The reaction process was performed at 95 °C for 5 min, followed by 30 cycles at 95 °C for 30 sec, 54 °C for 1 min, and 72 °C for 1 min, plus a final extension at 72 °C for 5 min. Subsequently, the amplified products were checked by 2% agarose gel electrophoresis and ethidium bromide staining. Amplicons were purified using an AMPure XP PCR Purification Kit (Agencourt, Beckman Coulter, USA) and were quantified using the Qubit dsDNA HS Assay Kit (Life Technologies, USA) with a Qubit 2.0 fluo-rometer following the respective manufacturers’ instructions.
For V4 library preparation, Illumina adapters were attached to the amplicons using the Illumina TruSeq DNA Sample Preparation v2 Kit (Illumina, USA). Purified libraries were processed for cluster generation and sequenc-ing ussequenc-ing the MiSeq system.
Figure 8. The percentage of selected genera present in each group. Thirty-seven genera that met the following conditions were selected: (1) the genus was present in 11–59% of samples in a group and (2) the genus was more than twice as abundant in that group as in any other group.
Filtering 16S rRNA sequencing data for quality.
Sequencing reads from different samples were identified and separated using specific barcodes at the 5′ end of the sequence (two mismatches allowed). The FASTX-Toolkit (http://hannonlab.cshl.edu/fastx_toolkit) was employed to process raw read data files. We per-formed three steps to ensure sequence quality processing. (i) The command “fastq_quality_filter −Q33 −q 20 −p 70”. “−q 20” denoted that the minimum quality score was 20. “−p 70” defined the minimum percentage of bases required for “−q” quality to be over or equal to 70%. (ii) The command “fastq_quality_trimmer −t 20 −l 100 −Q33”. “−t 20” denoted that bases with lower quality (<20) would be trimmed (checking from the end of the sequence). “−l 100” indicated that the minimum acceptable sequence length was 100 after trimming. (iii) Sequences were retained if both forward and reverse sequencing reads passed the first and second steps.Taxonomy assignment based on bacterial 16S rRNA sequences.
To assign taxonomy, a collection of 16 S rRNA sequences was retrieved from the SILVA ribosomal RNA sequence database (release 115)44,45. Thesesequences were extracted with V4 forward and reverse primers. Then, UCLUST was used to create representative sequence clusters with similarities equalling or above 97%46. Bowtie247 was used to align sequencing reads against
V4 sequence clusters. A 97% similarity standard was applied to V4 sequence clusters.
Statistical analysis.
The OTU table of raw counts was normalised to an OTU table of relative abundance val-ues. Taxa of the same type were agglomerated at the phylum, class, order, family, and genus levels via the SILVA data-base. Biodiversity was compared between classified groups using the nonparametric Wilcoxon test. Kendall’s Tau and Spearman’s rank correlation coefficients were used to test the association between richness (species number) and the Shannon diversity index. To investigate the relationships between bacteria, we first calculated the average sum of relative abundance for each genus in the whole sample and then used principal component analysis for the top 15 genera. Phylogeny-based UniFrac analysis was also performed48. Clustering and multidimensional scaling (alsoknown as principal coordinate analysis) methods were used for visualisation based on data reduction of patterns in an n-dimensional dataset. MRPPs were used to test differences between groups. Based on the characteristics of the compositional data, a network of specific genera was built using SparCC correlation coefficients49. R software was
used for statistical analysis (The R Project for Statistical Computing, Vienna, Austria).
Availability of data and materials.
Sequence data associated with this project have been deposited at the NCBI under study accession SRP107079.References
1. Jemal, A. et al. Cancer statistics, 2009. CA Cancer J Clin 59, 225–249 (2009).
2. Howlader, N. et al. KA(eds). In National Cancer Institute. Bethesda, MD http://seer.cancer.gov/csr/1975_2011/ Vol. based on November 2013 SEER data submission, posted to the SEER web site, April 2014 (2014).
3. Wu, Y. H. et al. A Comprehensive Analysis on the Association between Tobacco-Free Betel Quid and Risk of Head and Neck Cancer in Taiwanese Men. PloS one 11, e0164937 (2016).
4. Haddad, R. I. & Shin, D. M. Recent advances in head and neck cancer. The New England journal of medicine 359, 1143–1154 (2008). 5. Gold, K. A., Lee, H. Y. & Kim, E. S. Targeted therapies in squamous cell carcinoma of the head and neck. Cancer 115, 922–935 (2009). 6. Mashberg, A., Boffetta, P., Winkelman, R. & Garfinkel, L. Tobacco smoking, alcohol drinking, and cancer of the oral cavity and
oropharynx among U.S. veterans. Cancer 72, 1369–1375 (1993).
7. Lin, W.-J., Jiang, R.-S., Wu, S.-H., Chen, F.-J. & Liu, S.-A. Smoking, Alcohol, and Betel Quid and Oral Cancer: A Prospective Cohort Study. Journal of Oncology 2011, 5 (2011).
8. Liu, W. et al. Malignant transformation of oral leukoplakia: a retrospective cohort study of 218 Chinese patients. BMC Cancer 10, 1–6 (2010).
9. Shiu, M. N. & Chen, T. H. Intervention efficacy and malignant transformation to oral cancer among patients with leukoplakia (Review). Oncology reports 10, 1683–1692 (2003).
10. Lalli, A. et al. An altered keratinocyte phenotype in oral submucous fibrosis: correlation of keratin K17 expression with disease severity. Journal of Oral Pathology & Medicine 37, 211–220 (2008).
11. Kusters, J. G., van Vliet, A. H. M. & Kuipers, E. J. Pathogenesis of Helicobacter pylori Infection. Clinical Microbiology Reviews 19, 449–490 (2006).
12. Griffen, A. L., Becker, M. R., Lyons, S. R., Moeschberger, M. L. & Leys, E. J. Prevalence of Porphyromonas gingivalis and Periodontal Health Status. Journal of Clinical Microbiology 36, 3239–3242 (1998).
13. Jabbour, Z. et al. Assessing the oral microbiota of healthy and alcohol-treated rats using whole-genome DNA probes from human bacteria. Archives of Oral Biology 58, 317–323 (2013).
14. Dahlén, G., Nauclér, C., Nordwall, S. & Suksu-art, N. Oral microflora in betel-chewing adults of the Karen tribe in Thailand.
Anaerobe 16, 331–336 (2010).
15. Lie, M. A. et al. Oral microbiota in smokers and non-smokers in natural and experimentally-induced gingivitis. Journal of Clinical
Periodontology 25, 677–686 (1998).
16. Wu, J. et al. Cigarette smoking and the oral microbiome in a large study of American adults. ISME J (2016). 17. Bagan, J., Sarrion, G. & Jimenez, Y. Oral cancer: Clinical features. Oral Oncology 46, 414–417 (2010).
18. Mani, V., Weber, T. E., Baumgard, L. H. & Gabler, N. K. Growth And Development Symposium: Endotoxin, inflammation, and intestinal function inlivestock12. Journal of Animal Science 90, 1452–1465 (2012).
19. Said, H. S. et al. Dysbiosis of Salivary Microbiota in Inflammatory Bowel Disease and Its Association With Oral Immunological Biomarkers. DNA Research 21, 15–25 (2014).
20. Atanasova, K. R. & Yilmaz, O. Looking in the Porphyromonas gingivalis cabinet of curiosities: the microbium, the host and cancer association. Mol Oral Microbiol 29, 55–66 (2014).
21. Yilmaz, O. The chronicles of Porphyromonas gingivalis: the microbium, the human oral epithelium and their interplay. Microbiology
154, 2897–2903 (2008).
22. Katz, J., Onate, M. D., Pauley, K. M., Bhattacharyya, I. & Cha, S. Presence of Porphyromonas gingivalis in gingival squamous cell carcinoma. Int J Oral Sci 3, 209–215 (2011).
23. Nagy, K. N., Sonkodi, I., Szoke, I., Nagy, E. & Newman, H. N. The microflora associated with human oral carcinomas. Oral Oncol 34, 304–308 (1998).
24. Mager, D. L. et al. The salivary microbiota as a diagnostic indicator of oral cancer: a descriptive, non-randomized study of cancer-free and oral squamous cell carcinoma subjects. J Transl Med 3, 27 (2005).
25. Hu, X., Zhang, Q., Hua, H. & Chen, F. Changes in the salivary microbiota of oral leukoplakia and oral cancer. Oral Oncology 56, e6–e8 (2016).
26. Mager, D. et al. The salivary microbiota as a diagnostic indicator of oral cancer: A descriptive, non-randomized study of cancer-free and oral squamous cell carcinoma subjects. Journal of Translational Medicine 3, 27 (2005).
27. Hooper, S. J. et al. A molecular analysis of the bacteria present within oral squamous cell carcinoma. Journal of Medical Microbiology
56, 1651–1659 (2007).
28. Guerrero-Preston, R. et al. 16S rRNA amplicon sequencing identifies microbiota associated with oral cancer, human papilloma virus infection and surgical treatment. Oncotarget 7, 51320–51334 (2016).
29. Morgan, X. C. & Huttenhower, C. Chapter 12: Human Microbiome Analysis. PLoS Comput Biol 8, e1002808 (2012).
30. Cox, M. J., Cookson, W. O. C. M. & Moffatt, M. F. Sequencing the human microbiome in health and disease. Human Molecular
Genetics 22, R88–R94 (2013).
31. Krishnan, K., Chen, T. & Paster, B. J. A practical guide to the oral microbiome and its relation to health and disease. Oral Diseases 23, 276–286 (2017).
32. Zhang, Y. et al. The emerging landscape of salivary diagnostics. Periodontology 2000 70, 38–52 (2016).
33. Pushalkar, S. et al. Microbial diversity in saliva of oral squamous cell carcinoma. FEMS immunology and medical microbiology 61, 269–277 (2011).
34. Schmidt, B. L. et al. Changes in Abundance of Oral Microbiota Associated with Oral Cancer. PloS one 9, e98741 (2014).
35. Krishna Prasad, R. B., Sharma, A. & Babu, H. M. An insight into salivary markers in oral cancer. Dental Research Journal 10, 287–295 (2013).
36. Wang, X., Kaczor-Urbanowicz, K. E. & Wong, D. T. W. Salivary biomarkers in cancer detection. Medical Oncology 34, 7 (2016). 37. He, J., Li, Y., Cao, Y., Xue, J. & Zhou, X. The oral microbiome diversity and its relation to human diseases. Folia Microbiologica 60,
69–80 (2015).
38. Ho, P.-S. et al. Malignant transformation of oral potentially malignant disorders in males: a retrospective cohort study. BMC Cancer
9, 260 (2009).
39. VILLA, A. & GOHEL, A. Oral potentially malignant disorders in a large dental population. Journal of Applied Oral Science 22, 473–476 (2014).
40. Gupta, P. C. & Warnakulasuriya, S. Global epidemiology of areca nut usage. Addict Biol 7, 77–83 (2002).
41. Kruse, A. L., Bredell, M. & Gratz, K. W. Oral squamous cell carcinoma in non-smoking and non-drinking patients. Head Neck Oncol
2, 24 (2010).
42. Li, Y. et al. Salivary transcriptome diagnostics for oral cancer detection. Clinical cancer research: an official journal of the American
Association for Cancer Research 10, 8442–8450 (2004).
43. Weng, S.-L. et al. Bacterial Communities in Semen from Men of Infertile Couples: Metagenomic Sequencing Reveals Relationships of Seminal Microbiota to Semen Quality. PloS one 9, e110152 (2014).
44. Pruesse, E. et al. SILVA: a comprehensive online resource for quality checked and aligned ribosomal RNA sequence data compatible with ARB. Nucleic Acids Research 35, 7188–7196 (2007).
45. Quast, C. et al. The SILVA ribosomal RNA gene database project: improved data processing and web-based tools. Nucleic Acids
Research 41, D590–D596 (2013).
46. Edgar, R. C. Search and clustering orders of magnitude faster than BLAST. Bioinformatics 26, 2460–2461 (2010). 47. Langmead, B. & Salzberg, S. L. Fast gapped-read alignment with Bowtie 2. Nat Meth 9, 357–359 (2012).
48. Lozupone, C., Lladser, M. E., Knights, D., Stombaugh, J. & Knight, R. UniFrac: an effective distance metric for microbial community comparison. ISME J 5, 169–172 (2011).
49. Friedman, J. & Alm, E. J. Inferring correlation networks from genomic survey data. PLoS Comput Biol 8, e1002687 (2012).
Acknowledgements
This study was supported by research grants from the Health and welfare surcharge of tobacco products, Ministry of Health and Welfare, Taiwan [MOHW 103-TD-B-111-08, MOHW 104-TDU-B-212-124-005, MOHW 105-TDU-B-212-134002, MOHW 106-TDU-B-212-144005]. And grants from Ministry of Science and Technology, Taiwan [MOST 103-2628-B-009-001-MY3, MOST 105-2627-M-009-007, MOST 105-2319-B-400-002, MOST 104-2911-I-009-509, MOST 106-2633-B-009-001].
Author Contributions
The following authors contributed to the study design and supervision: Y.J.J., C.N.H., H.D.H., K.C.U., S.F.Y., and W.L.C. Data collection and experimental procedures were conducted by W.H.L., T.Y., and T.L.Y. Data analysis and interpretation were performed by H.M.C., C.L., F.M.L., and S.Y.H. Sample collection was done by C.Y.P., L.L.T., B.C.W., C.H.H., and C.Y.C. The manuscript was prepared by W.H.L., H.M.C., and S.F.Y. Critical revision of the manuscript for important intellectual contents were completed by Y.J.J., C.N.H., H.D.H. and S.F.Y. All authors read and approved the final manuscript.
Additional Information
Supplementary information accompanies this paper at https://doi.org/10.1038/s41598-017-16418-x. Competing Interests: The authors declare that they have no competing interests.
Publisher's note: Springer Nature remains neutral with regard to jurisdictional claims in published maps and institutional affiliations.
Open Access This article is licensed under a Creative Commons Attribution 4.0 International License, which permits use, sharing, adaptation, distribution and reproduction in any medium or format, as long as you give appropriate credit to the original author(s) and the source, provide a link to the Cre-ative Commons license, and indicate if changes were made. The images or other third party material in this article are included in the article’s Creative Commons license, unless indicated otherwise in a credit line to the material. If material is not included in the article’s Creative Commons license and your intended use is not per-mitted by statutory regulation or exceeds the perper-mitted use, you will need to obtain permission directly from the copyright holder. To view a copy of this license, visit http://creativecommons.org/licenses/by/4.0/.
![Figure 5. Network analysis of salivary microbiota using SparCC correlation coefficients [Epithelial precursor lesion (A) and Cancer groups (B)]](https://thumb-ap.123doks.com/thumbv2/9libinfo/7510007.117531/7.892.233.721.68.560/network-analysis-salivary-microbiota-correlation-coefficients-epithelial-precursor.webp)