Religion and Politics: A Holy but Controversial Affiliation
International Academic Conference
Organized by
Taiwanese Political Science Association
Graduate Institute of Political Science, National Sun Yat-sen University
Sponsored byNational Science Council, Taiwan Foundation for Democracy, National Sun
Yat-sen University, Kaohsiung City Government, Ministry of Education
August 15~16, 2005 Kaohsiung
Islam and Democracy: A Global Perspective
Ming-hua Huang, Department of Political Science
National Taiwan University
** This is only a rough draft. **
Islam and Democracy: A Global Perspective
Min-hua Huang
It has been a great puzzle that we can derive a very different conclusion from sheer observation and survey data regarding the relationship of Islam and democracy.1 A common belief in the West presumes that Islam is incompatible with democracy in nature. The
obvious fact strengthening this idea is that very few of the Muslim countries are democratic but most Christian ones are instead. This contrast makes Islam as the culprit, especially the supportive attitude toward Islamic guidance on public affairs. Many scholars thus consider the prospect of democratization in the Islamic world is pessimistic unless the secularization process can speed up (Pipes, 1983). This conclusion coincides with the argument of the modernization theory proposed many years ago, even though countless critics never stop attacking on its western-centric perspective.
There are several important findings over the past few years challenging the above argument on Islam and democracy (Tessler, 2002; 2003). Two strands of evidence provide strong empirical basis to discount the credibility of sheer observation. First, while people in the Muslim societies are indeed more religious-oriented, their support of democracy is no less than the people in the Western world (Huang, 2004; 2005). Second, if the concept of
religiosity can be further divided into “personal religiosity” and “political religiosity”, then the factor correlated to non-democratic orientation is political religiosity, not personal
religiosity (Al-Suwaidi, 1995). In other words, Islam and democracy are not inversely related at the country level, and this relationship does stand at the individual level only if we narrow the definition of religiosity to its political aspect. If so, Islam is not the only religion that could have discouraging effects on people’s democratic orientation. Other religions may have the same negative relationship if political religiosity is our target of investigation.
This paper uses the data from World Value Survey to explore the relationship between Islam and Democracy in a global perspective. Preliminary results show that Islam is not the major factor contributed to the lack of democratic orientation, and that people with higher religiopolitical orientation, regardless what religion is, are indeed more negative toward democracy. The overall finding indicates that cultural factors deeply affect what people think about religion and politics. And the modernization theory still provides a powerful
explanation to account for that cultural difference.
1
This was the problem always in my mind when I wrote my doctoral dissertation in Michigan. Most of the Islamic countries are not democratic in the Polity IV dataset but they do have a higher average of democratic orientation in World Value Survey. See Huang (2004, p.378-379).
I. Does Islam Make People Less Democratic?
Islam, as well as other religions, is considered a traditional authority governing people’s life in all aspects. As early in 1950s, scholars in political science and sociology believed that modernization would bring secularization and hence religion will lose its
momentum in a modern society (Hadden, 1987). Fifty years has passed, and the debate on the modernization theory is still unresolved. However, more and more scholars now realize that religion never loses its leverage completely on either private or public domain as a society becomes modernized, even in the West. Religion seems to have its own path in the process of modernization, and the relationship between religion and modernization is far more delicate than what people used to think (Inglehart and Baker, 2000). One promising hypothesis is inspired from Inglehart’s modernization theory and it can be stated as follows: when a society start modernizing from the underdeveloped to affluent level, religion becomes less and less important and loses its governing function as a traditional authority; however, if this society continues developing into a postmodernized level, the importance of religion will recover but transform its role to provide subjective well-being, or satisfy people’s need for so-called “self-expressive” value (Inglehart, 1997). If the above statement is true, then the
secularization hypothesis is only half the story since de-secularization is likely to happen in a postmodern society where people believe religion can bring comfort and moral guidance. The relationship of religion and modernization can be better described as convex curvilinear instead of simple linear.
Does Islam make people less democratic? The logic behind this question is whether Islam as a traditional authority would hinder the democratization process which is regarded a characteristic of a modern society. Unfortunately, most of the wealthy Islamic countries are rentier states based on oil production and did not experience a substantial modernization process, and most of the other Islamic countries are still modernizing and haven’t reach the affluent level of development where democratization is highly expected. Therefore, it is no wonder that people link two traditional characteristics together, Islam and non-democracy. They view Islam as the major barrier of modernization, and without modernization, democratization is less likely to be achieved.
Before turning to the empirical data for evidence, we should assure the logical linkage between modernization and democratization. Past studies show that it is easy to demonstrate the positive correlation between the two characteristics but no clear principle can be
concluded as to when the transformation from autocracy to democracy starts and finishes (Prezworski et. al., 2000). Nonetheless, GDP per capita in the most developed Islamic country such as Turkey is only $7400 USD (estimated in 2004, CIA World Factbook), and this level is well below the critical point that a well-established democracy could persist, although Turkey has been evaluated in the Polity IV dataset as a democracy since 1983 after the latest coup in 1980. Bear in mind that claiming modernization and democratization goes together is a probabilistic statement, but conceptually as well as empirically the two
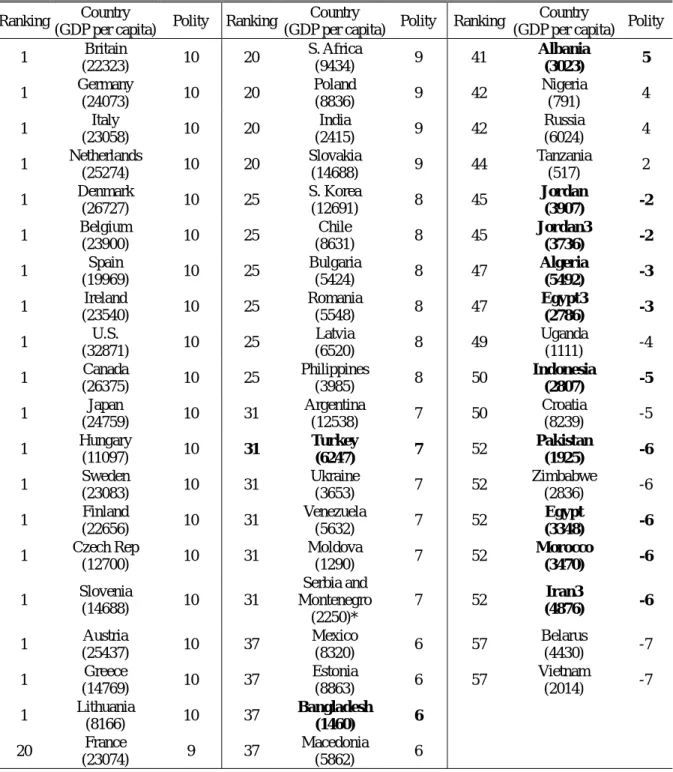
Table 1 Level of Democracy (Polity Score) and Modernization (GDP per capita)
Ranking Country
(GDP per capita) Polity Ranking
Country
(GDP per capita) Polity Ranking
Country
(GDP per capita) Polity 1 Britain (22323) 10 20 S. Africa (9434) 9 41 Albania (3023) 5 1 Germany (24073) 10 20 Poland (8836) 9 42 Nigeria (791) 4 1 Italy (23058) 10 20 India (2415) 9 42 Russia (6024) 4 1 Netherlands (25274) 10 20 Slovakia (14688) 9 44 Tanzania (517) 2 1 Denmark (26727) 10 25 S. Korea (12691) 8 45 Jordan (3907) -2 1 Belgium (23900) 10 25 Chile (8631) 8 45 Jordan3 (3736) -2 1 Spain (19969) 10 25 Bulgaria (5424) 8 47 Algeria (5492) -3 1 Ireland (23540) 10 25 Romania (5548) 8 47 Egypt3 (2786) -3 1 U.S. (32871) 10 25 Latvia (6520) 8 49 Uganda (1111) -4 1 Canada (26375) 10 25 Philippines (3985) 8 50 Indonesia (2807) -5 1 Japan (24759) 10 31 Argentina (12538) 7 50 Croatia (8239) -5 1 Hungary (11097) 10 31 Turkey (6247) 7 52 Pakistan (1925) -6 1 Sweden (23083) 10 31 Ukraine (3653) 7 52 Zimbabwe (2836) -6 1 Finland (22656) 10 31 Venezuela (5632) 7 52 Egypt (3348) -6 1 Czech Rep (12700) 10 31 Moldova (1290) 7 52 Morocco (3470) -6 1 Slovenia (14688) 10 31 Serbia and Montenegro (2250)* 7 52 Iran3 (4876) -6 1 Austria (25437) 10 37 Mexico (8320) 6 57 Belarus (4430) -7 1 Greece (14769) 10 37 Estonia (8863) 6 57 Vietnam (2014) -7 1 Lithuania (8166) 10 37 Bangladesh (1460) 6 20 France (23074) 9 37 Macedonia (5862) 6
The Pearson correlation between polity score and GDP per capita is 0.62 (p=0.000, df=58).
Data Source: GDP per capita is from World Development Indicators, expect * from CIA World Factbook. Polity Score is from POLITY IV dataset. The time point of the data is one year before the survey
in each country.
processes do not have to hang together.
Let us first examine the polity scores of 58 countries in WVS. As Table 1 shows, Islamic countries, except Turkey and Bangladesh, are all non-democratic by definition. This confirms the conclusion derived from sheer observation that most of the Islamic countries are not democratic. With regard to the level of modernization, it is apparent that Islamic
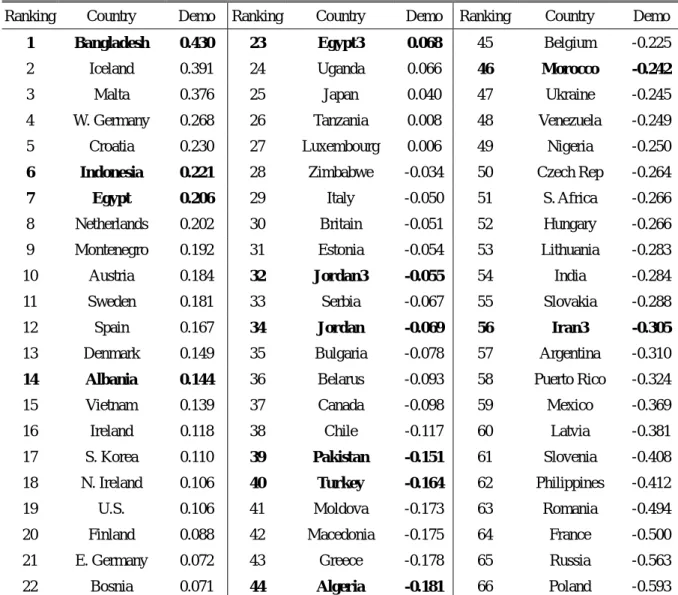
Table 2 Country Means of Measurements on Faith in Democracy (Demo)
Ranking Country Demo Ranking Country Demo Ranking Country Demo
1 Bangladesh 0.430 23 Egypt3 0.068 45 Belgium -0.225
2 Iceland 0.391 24 Uganda 0.066 46 Morocco -0.242
3 Malta 0.376 25 Japan 0.040 47 Ukraine -0.245 4 W. Germany 0.268 26 Tanzania 0.008 48 Venezuela -0.249 5 Croatia 0.230 27 Luxembourg 0.006 49 Nigeria -0.250
6 Indonesia 0.221 28 Zimbabwe -0.034 50 Czech Rep -0.264
7 Egypt 0.206 29 Italy -0.050 51 S. Africa -0.266
8 Netherlands 0.202 30 Britain -0.051 52 Hungary -0.266 9 Montenegro 0.192 31 Estonia -0.054 53 Lithuania -0.283 10 Austria 0.184 32 Jordan3 -0.055 54 India -0.284 11 Sweden 0.181 33 Serbia -0.067 55 Slovakia -0.288 12 Spain 0.167 34 Jordan -0.069 56 Iran3 -0.305
13 Denmark 0.149 35 Bulgaria -0.078 57 Argentina -0.310
14 Albania 0.144 36 Belarus -0.093 58 Puerto Rico -0.324
15 Vietnam 0.139 37 Canada -0.098 59 Mexico -0.369 16 Ireland 0.118 38 Chile -0.117 60 Latvia -0.381 17 S. Korea 0.110 39 Pakistan -0.151 61 Slovenia -0.408 18 N. Ireland 0.106 40 Turkey -0.164 62 Philippines -0.412 19 U.S. 0.106 41 Moldova -0.173 63 Romania -0.494 20 Finland 0.088 42 Macedonia -0.175 64 France -0.500 21 E. Germany 0.072 43 Greece -0.178 65 Russia -0.563 22 Bosnia 0.071 44 Algeria -0.181 66 Poland -0.593 A dichotomous IRT scale is applied to the measurement. Regarding the methodological issue, please see the appendix.
Data Source: World Value Survey
countries also have a lower GDP per capita under 7000USD. The coincidence of these two statistics is remarkable and the inference that Islam makes people less democratic is easily made if we do not pay a due attention on the level of analysis problem. The inference is an
individual-level argument but what the data shows is a country-level correlation. Another problem closely related to the level of analysis problem is whether we are
interested in people’s political attitude toward democracy or macro-level objective evaluation of regime status. As can be seen in Table 2, if we apply subjective measurement on faith in democracy at the individual level and then aggregate the score to derive the country means, we can find that Islamic countries are evenly distributed and Muslims are no less democratic than people of the other religions. In this sense, Islam doesn’t make people less democratic and the question we raised at the beginning is a false one.
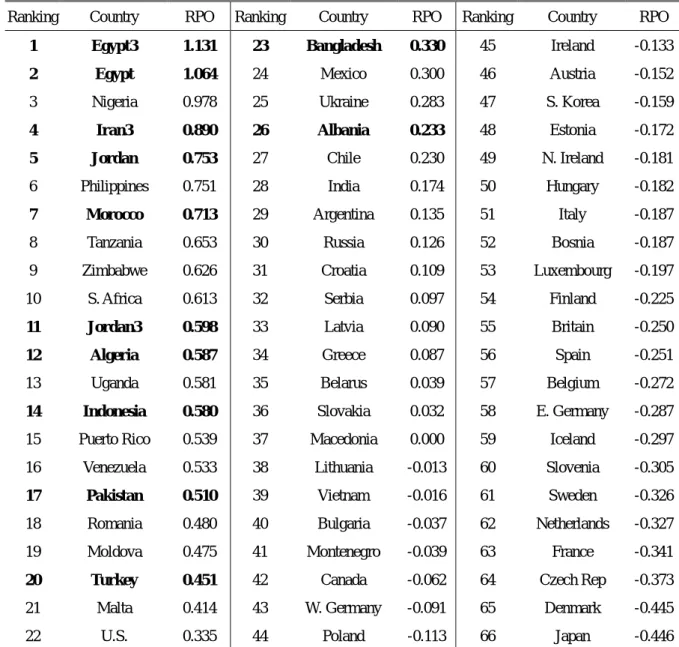
Table 3 Country Means of Religiopolitical Orientation (RPO)
Ranking Country RPO Ranking Country RPO Ranking Country RPO
1 Egypt3 1.131 23 Bangladesh 0.330 45 Ireland -0.133
2 Egypt 1.064 24 Mexico 0.300 46 Austria -0.152
3 Nigeria 0.978 25 Ukraine 0.283 47 S. Korea -0.159
4 Iran3 0.890 26 Albania 0.233 48 Estonia -0.172
5 Jordan 0.753 27 Chile 0.230 49 N. Ireland -0.181
6 Philippines 0.751 28 India 0.174 50 Hungary -0.182
7 Morocco 0.713 29 Argentina 0.135 51 Italy -0.187
8 Tanzania 0.653 30 Russia 0.126 52 Bosnia -0.187 9 Zimbabwe 0.626 31 Croatia 0.109 53 Luxembourg -0.197 10 S. Africa 0.613 32 Serbia 0.097 54 Finland -0.225
11 Jordan3 0.598 33 Latvia 0.090 55 Britain -0.250
12 Algeria 0.587 34 Greece 0.087 56 Spain -0.251
13 Uganda 0.581 35 Belarus 0.039 57 Belgium -0.272
14 Indonesia 0.580 36 Slovakia 0.032 58 E. Germany -0.287
15 Puerto Rico 0.539 37 Macedonia 0.000 59 Iceland -0.297 16 Venezuela 0.533 38 Lithuania -0.013 60 Slovenia -0.305
17 Pakistan 0.510 39 Vietnam -0.016 61 Sweden -0.326
18 Romania 0.480 40 Bulgaria -0.037 62 Netherlands -0.327 19 Moldova 0.475 41 Montenegro -0.039 63 France -0.341
20 Turkey 0.451 42 Canada -0.062 64 Czech Rep -0.373
21 Malta 0.414 43 W. Germany -0.091 65 Denmark -0.445 22 U.S. 0.335 44 Poland -0.113 66 Japan -0.446 A dichotomous IRT scale is applied to the measurement. Regarding the methodology, please see the appendix. Data Source: World Value Survey
apparently is the reason why we have different conclusions above. From the methodological perspective, our measurements may have nothing wrong but the discrepancy could still happen and this is the nature of the level of analysis problem here: a macro-level property cannot be reduced to the individual level. Conceptually whether a regime is democratic is a completely different question as to whether people have a stronger faith in democracy. A democracy may have well-established but people could lose confidence on the democratic system for multifarious reasons. On the other hand, people may never experience democracy but have a very strong faith in democracy. In fact, such a discrepancy is reasonable since people are usually more critical toward democracy if their expectations are not met, but they tend to romanticize democracy if they never experience.
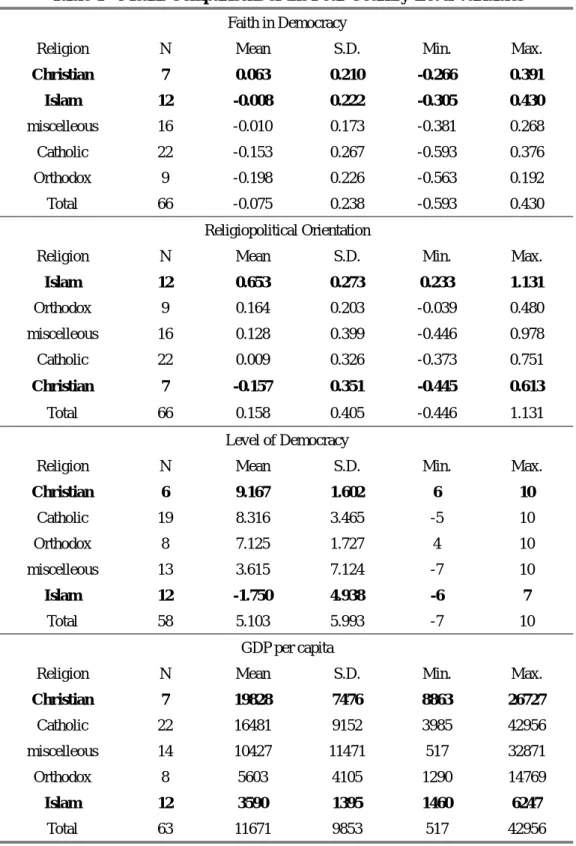
Table 4 Means Comparisons of the Four Country-Level Variables
Faith in Democracy
Religion N Mean S.D. Min. Max.
Christian 7 0.063 0.210 -0.266 0.391 Islam 12 -0.008 0.222 -0.305 0.430 miscelleous 16 -0.010 0.173 -0.381 0.268 Catholic 22 -0.153 0.267 -0.593 0.376 Orthodox 9 -0.198 0.226 -0.563 0.192 Total 66 -0.075 0.238 -0.593 0.430 Religiopolitical Orientation
Religion N Mean S.D. Min. Max.
Islam 12 0.653 0.273 0.233 1.131 Orthodox 9 0.164 0.203 -0.039 0.480 miscelleous 16 0.128 0.399 -0.446 0.978 Catholic 22 0.009 0.326 -0.373 0.751 Christian 7 -0.157 0.351 -0.445 0.613 Total 66 0.158 0.405 -0.446 1.131 Level of Democracy
Religion N Mean S.D. Min. Max.
Christian 6 9.167 1.602 6 10 Catholic 19 8.316 3.465 -5 10 Orthodox 8 7.125 1.727 4 10 miscelleous 13 3.615 7.124 -7 10 Islam 12 -1.750 4.938 -6 7 Total 58 5.103 5.993 -7 10 GDP per capita
Religion N Mean S.D. Min. Max.
Christian 7 19828 7476 8863 26727 Catholic 22 16481 9152 3985 42956 miscelleous 14 10427 11471 517 32871 Orthodox 8 5603 4105 1290 14769 Islam 12 3590 1395 1460 6247 Total 63 11671 9853 517 42956
Data Source: World Value Survey.
Does this mean that our investigation is meaningless because it is based on a false question? Not at all! If we think about the secularization hypothesis (Casanova, 1994), three
characteristics should go together: less development, less secularization, and less democracy. We have the factual basis from Table 1 about less development and less democracy of the
Table 5 A Comparison between Christian and Islamic Countries
Christian Islam
Most Developed Society Least Developed Society Most Democratic Government Least Democratic Government
Strongest Faith in Democracy Strong Faith in Democracy
Least Religiopolitical Orientation Strongest Religiopolitical Orientation
Islamic countries. Table 3 also provides us the evidence regarding less secularization in the Islamic countries.
In Table 3, we can find that people in the Islamic countries are more supportive of the idea that religion should have influence on political affairs. Among the 66 available cases in WVS, 12 Islamic countries rank within the first 26 places. The evidence is clear: people do have higher religiopolitical orientation in the Muslim world.
II. Two Different Lines of Thoughts
I want to point out two different lines of thoughts about what we have discussed in the last section. We need Table 4 and Table 5 for reference. Table 4 is a summary of ANOVA by differentiating religions as five groups: Islam, Catholicism, Christianity, Orthodox, and Miscellaneous. If a country has a single religious population over 70%, it will be assigned into the four major religious categories. Otherwise, it will be put into the miscellaneous category. Since few cases of other major religions such as Buddhism are available in the dataset, I decide only use the five categories for the comparison purpose.
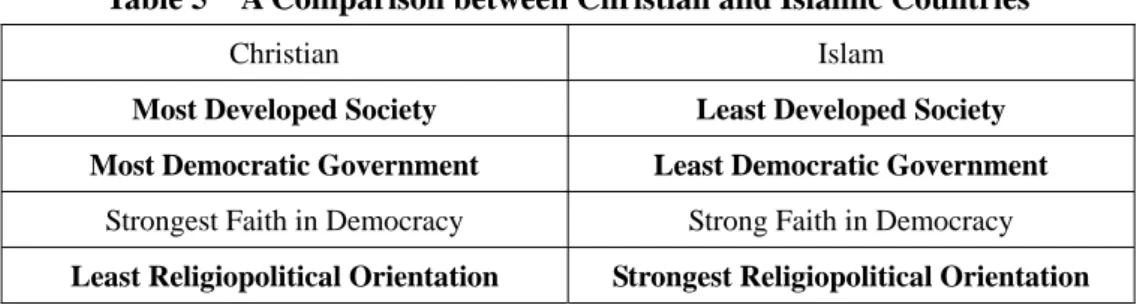
Table 5 lists a comparison between Christianity and Islam in the four
country-variables. From these two tables, we find that the contrast between Christian and Islamic countries is very significant. Generally, the Christian countries have the most developed societies with the most democratic governments and people are most secular in public affairs; on the contrary, the Islamic counterparts have exactly the opposite
characteristics. It clearly shows how sheer observation is so sensible, especially for the people in the United States and Britain, because these two countries are regarded as the major supporters for Israel and have treated Islam as possible threats for a long time. However, there is also a similarity between the Christian and Islamic countries and that is, people have very strong faith in democracy comparing to people in the Catholic or Orthodox countries.
The first line of thoughts to explain all these findings would argue that Islam is indeed the main hindrance for modernization as well as for secularization and democracy. In a less developed countries where Islam is expected to play more role in politics, there is little pressure or social demand for a more open and liberal society. People still believe Islam should be the blueprint to construct the social life as well as political system. The strong faith in democracy, contrary to its face value, reflects their lack of knowledge about what
democracy truly is. For those people, democracy means something different from the western-type of definition such as liberalism, secularism, or individualism, but it is likely perceived as an Islamic way of life following traditional Islamic law (shari’a) and has nothing to do with liberalism, secularism, or individualism. In this viewpoint, democracy is only an all-embracing term to symbolize what they believe desirable or positive in their value system, but the content is nothing close to what people think of democracy in the West. The second line of thoughts would adopt a more optimistic perspective to interpret our findings in Table 5. The main argument would be that Islam is not the hindrance for
democratization, and instead Islam provides another political choice to bring up political reform, better governance, and social justice. People support religion should have more say in politics and that is why the Islamic countries would have strongest religiopolitical orientation. Nevertheless, the motivation to uphold Islam in political arena is not to build a theocratic government but to cope with the bad government which neither develop economy nor promote democracy. This attitude can be further supported if we correctly interpret why people subjectively have such high expectations on democracy. Therefore, what lies behind the strong religiopolitical orientation and the strong faith in democracy is a voice for pursuing economic development and democratic reform. It is a fact that Islamic countries are
economically less developed and politically less democratized, but these problems are more relevant to bad governance and foreign intervention instead of Islam. People may have different visions about democracy in the Islamic world, and that doesn’t mean they don’t understand the essence of democracy. Strong religiopolitical orientation under the Muslim context may represent an awareness of political efficiency, internally as well as externally.
In the next section, I would like to propose a model to test which thought is more likely true. For simplicity, I label the first line of thoughts as “the fantasy hypothesis” and the second one “the awareness hypothesis”. The fantasy hypothesis means that the people’s strong faith in democracy is a result of lacking democratic experience and thus they romanticize democracy. The awareness hypothesis means that the faith in democracy represents political awareness and has substantial meaning for promoting democratization.
III. Fantasy or Awareness?
How can we test the fantasy hypothesis and the awareness hypothesis? If people have strong faith in democracy in Islamic countries because of romanticizing it, we can predict that the secularization/modernization theory still has strong explanatory power generally, regardless religion. The only difference between Islamic and non-Islamic countries is that the former should have a higher average of faith in democracy than the latter, or specifically they should at least have the same level of average comparing to the Christian countries. Once the two conditions are met, the fantasy hypothesis will be very persuasive because it
demonstrates that Islam has nothing to do with social protest and political reform. Whether people have higher modernity attitudes or whether they are more secular make better
Table 6 The Expected Relationships in the Two Levels
Level-1 Model Predictions (unit: people)
Religiopolitical Orientation Modernity Attitudes Political Satisfaction Background Variables The Fantasy Hypothesis
Negative Positive non-Negative No Prediction ( control variables)
The Awareness Hypothesis
Positive non-Positive Negative No Prediction (control variable)
Level-2 Model Predictions (unit: country)
Islam Performance Development Politics
The Fantasy Hypothesis Positive Contextual Effect No Crossover Effect No Crossover Effect Negative Contextual Effect No Prediction (control variable) The Awareness Hypothesis Strong Crossover Effect Strong Crossover Effect No Crossover Effect No Prediction (control variable) Dependent Variable: Level-1 Faith in Democracy
predictors than whether they are satisfied the government.
If the awareness hypothesis is corroborated, the explanatory pattern would be completely different as opposed to what the secularization/modernization depicts. Stronger faith in democracy in Islamic countries is related to higher religiopolitical orientation and dissatisfaction toward the government instead of modernity attitudes. Furthermore, if we are able to observe that the country-level factors of government performance are inversely correlated to the higher average of faith in democracy, then the awareness hypothesis can be generalized into the non-Islam world as well.
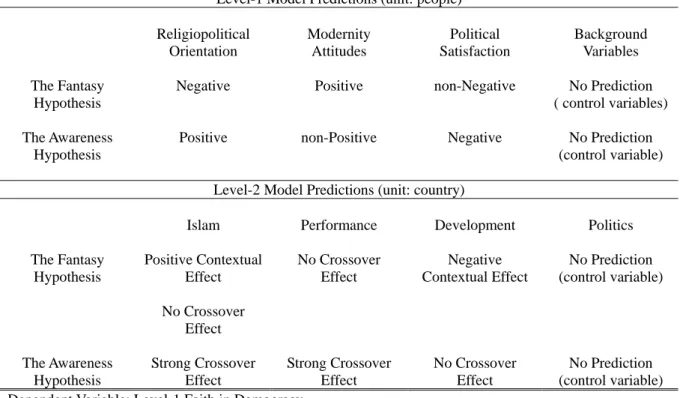
I summarize the above discussion with the list of my predictions about the two hypotheses in Table 6. In order to make cross-national comparison and multilevel inferences, I adopt hierarchical linear modeling to analyze the data. To shorten my presentation and make the discussion more accessible, interested readers can find the research design and other methodological details in the appendix.
As Table 6 shows, except background variables, there are only three explanatory variables in the individual-level model. The fantasy hypothesis is based on the modernization theory and would predict that people with traditional characteristics have less faith in
democracy. On the contrary, the awareness hypothesis contends that people have stronger faith in democracy because they want to express their political dissatisfaction and religion may provide solution to the problem they face, especially in Islamic countries. Each
hypothesis is further strengthened if evidence for the rival hypothesis does not show up such as the non-negative relationship of political satisfaction for the fantasy hypothesis and the
non-positive relationship of modernity attitudes for the awareness hypothesis.
At the country level, according to the fantasy hypothesis, it is the contextual effect that makes Islamic countries having a high average of faith in democracy because of fantasy. However, no crossover effect of Islam or performance on the individual-level relationships can be concluded. If the individual-level findings support the fantasy hypothesis, this would indicate no heterogeneity of individual-level relationships across different countries and that completes the fantasy hypothesis with no exception, including Islamic countries. The
existence of the heterogeneous relationships at the individual level along the religious line of Islam and non-Islam, on the other hand, could make the awareness hypothesis credible if the individual-level relationships are turned around by the crossover effects of the level-2 dummy or performance variables. Then the argument in favor of the awareness hypothesis is that Islamic countries have another explanatory pattern different from non-Islam countries either because they are cultural distinct (represented by the level-2 dummy variable “Islam”) or more generally because the government perform poorly in most of the Islamic countries. The same reasoning also applies to the level-2 development factors but in favors of the fantasy hypothesis since the different level-1 relationships in the Islamic countries are the result of underdevelopment instead of cultural factors or government performance. At last, I add background variables “Gender”, “Education”, and “Age” as the level-1 control variables and also the “Regime Type” variable “Degree of Democracy” as the leve-2 control variables.
The following eight models specified in Table 7 are necessary for testing the two hypotheses. I will report the result of each model and explain the implication. Notice that the baseline for our comparison is 40 years old male with complete secondary education
(university-preparatory type) and average level of religiopolitical orientation, modernity attitudes, and political satisfaction in each society.
IV. Empirical Results
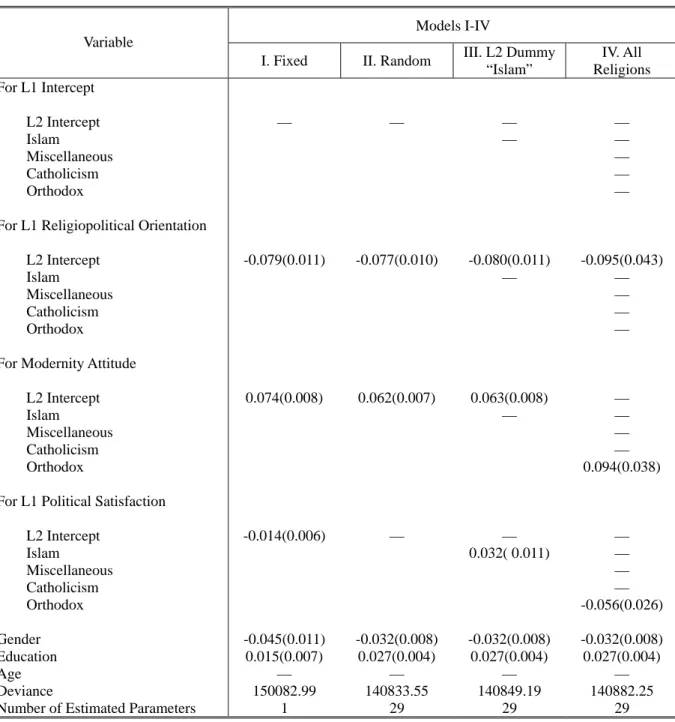
Let’s first compare the result of Model I and II. Model I is the fixed-effect model and it assumes no variation of our level-1 beta coefficients. Model II is the random coefficient model but it allows our level beta coefficients randomly vary. As can be seen in Table 7, the fantasy hypothesis is corroborated in both models since religiopolitical orientation and modernity attitudes are significantly correlated to faith in democracy with the expected signs. Also it is no surprise that the female and less educated people have less faith in democracy. Regarding political satisfaction, its negative correlation become insignificant in the random coefficient model and this even weakens the credibility of the awareness hypothesis since we have no reason to assume identical relationships across different societies.
Model III is designed to explain the variation of level-1 beta coefficients only adding a level-2 dummy variable “Islam”, with which we can distinguish whether there is any heterogeneous level-1 relationships along the religious line of Islam and non-Islam. The result suggests the same relationships with the Model II except for the positive crossover
Table 7 Results of Hierarchical Linear Modeling
Models I-IV Variable
I. Fixed II. Random III. L2 Dummy “Islam” IV. All Religions For L1 Intercept L2 Intercept Islam Miscellaneous Catholicism Orthodox — — — — — — — — —
For L1 Religiopolitical Orientation
L2 Intercept Islam Miscellaneous Catholicism Orthodox -0.079(0.011) -0.077(0.010) -0.080(0.011) — -0.095(0.043) — — — —
For Modernity Attitude
L2 Intercept Islam Miscellaneous Catholicism Orthodox 0.074(0.008) 0.062(0.007) 0.063(0.008) — — — — — 0.094(0.038)
For L1 Political Satisfaction
L2 Intercept Islam Miscellaneous Catholicism Orthodox -0.014(0.006) — — 0.032( 0.011) — — — — -0.056(0.026) Gender -0.045(0.011) -0.032(0.008) -0.032(0.008) -0.032(0.008) Education 0.015(0.007) 0.027(0.004) 0.027(0.004) 0.027(0.004) Age — — — — Deviance 150082.99 140833.55 140849.19 140882.25
Number of Estimated Parameters 1 29 29 29
Only specified variables are listed in the models. If the coefficient is not significant, the figure is replaced by a dash line. Entry is unstandardized coefficient. Figures in the parentheses are standard errors.
Program: HLM 5.05
effects of the level-2 Islam dummy on political satisfaction. This finding again assures the failure of the awareness hypothesis in that people do not have stronger faith in democracy because of political dissatisfaction but instead it is otherwise.
One possible critique on Model III is that the level-2 Islam dummy is too rough and cannot catch the fine difference. To see whether it is true, Model IV is specified with four level-2 religious dummies, and the remaining category unspecified is Christianity and it is baseline level-2 group for comparison. Somewhat surprisingly, I found that the significant relationships of religiopolitical orientation and modernity attitudes disappear, and only the
Orthodox countries have the same relationship as Model I shows. No clear conclusion can be derived in this model.
All of the former models do not consider adding any level-2 variable to control the
Table 7 Results of Hierarchical Linear Modeling (resumed)
Models V-VIII Variable V. Performance VI. Development VII. Regime Type VIII. Full Model For L1 Intercept L2 Intercept Growth L2 Political Satisfaction Degree of Democracy GDP Per Capita L2 Religiopolitical Orientation Islam — — — — -0.081( 0.037) — — 0.192( 0.091) — — — -0.077(0.035) — — — — -0.267(0.095) —
For L1 Religiopolitical Orientation
L2 Intercept Growth L2 Political Satisfaction Degree of Democracy GDP Per Capita L2 Religiopolitical Orientation Islam -0.080(0.011) — — — -0.075(0.011) — 0.072(0.030) — -0.078(0.011) — — -0.073(0.010) — — — 2E-06(1E-06) 0.074(0.034) —
For Modernity Attitude
L2 Intercept Growth L2 Political Satisfaction Degree of Democracy GDP Per Capita L2 Religiopolitical Orientation Islam 0.063(0.008) -0.003(0.001) — — 0.062(0.009) — — — 0.064(0.008) — — 0.063(0.009) -0.003(0.001) — — — — —
For L1 Political Satisfaction
L2 Intercept Growth L2 Political Satisfaction Degree of Democracy GDP Per Capita L2 Religiopolitical Orientation Islam — — 0.023(0.004) 0.030(0.010) — — — 0.024(0.012) — — — -0.014(0.006) — 0.024(0.005) — — — 0.038(0.010) Gender -0.032(0.008) -0.032(0.008) -0.032(0.008) -0.032(0.008) Education 0.027(0.004) 0.027(0.004) 0.027(0.004) 0.027(0.004) Age — — — — Deviance 140884.91 140954.93 140888.83 141035.19
Number of Estimated Parameters 29 29 29 29 Only specified variables are listed in the models. If the coefficient is not significant, the figure is replaced by a dash line. Entry is unstandardized coefficient. Figures in the parentheses are standard errors.
level-2 model nor to generalize the variation pattern of the level-1 relationships. Model V to VIII will focus on this point and have a full picture of explanation. As mentioned previously (see Table 6), we have three groups of level-2 variables to test. The first group is
governmental performance, includeing two country-level variables “GDP Per Capita Annual Growth” and “Country-Means of Political Satisfaction”. The second group is development, including “GDP Per Capita” and “Country-Means of Religiopolitical Orientation”. The last group is regime type, including only one variable “Degree of Democracy”. In the following four models, I test each group of the level-2 variables one by one and then put all of them together in the end. In each model, I also include the dummy variable “Islam” to compare the Islamic with non-Islamic countries.
Model V tests whether government performance would change the variation pattern we found in Model III. The answer is apparently not. While we can find that Growth has a crossover effect on Modernity Attitudes, the magnitude is so small (-0.003 for 1% growth) that nearly no substantial influence on the positive relationship between Modernity Attitudes and Faith in Democracy. With regard to the crossover effects of Level-2 Political Satisfaction and Islam on Level-1 Political Satisfaction, the positive sign is at odd with our expectation if the awareness hypothesis applies. More specifically, the Islamic countries have an above average of political satisfaction and that makes Level-1 Political satisfaction positively correlated to faith in democracy which doesn’t fit the awareness hypothesis. As a result, no supporting evidence is found for the awareness hypothesis in Model V.
Model VI tests whether the level of modernization can affect the variation pattern in Model II. The findings provide some evidence for both of the tested hypotheses. At first sight, it is obvious that the fixed effects all have the same results as in Model II. The supporting evidence for the fantasy hypothesis is the higher average of faith in democracy in Islamic countries. On the other hand, as the countervailing crossover effect of religiopolitical orientation shows, the negative correlation between religiopolitical orientation and faith in democracy is significantly weakening. While this corroborates the awareness hypothesis in that the Islamic countries have a higher country-mean of religiopolitical orientation (0.653 over 0.048 in the non-Islamic countries), the magnitude is not large enough to weaken the negative relationship into the non-significant level. Consequently, this evidence is not strong enough to challenge the fantasy hypothesis given the results in Model VI.
Model VII specifies regime type as the major level-2 explanatory variable to see whether the objective measurement of democracy can account for the difference of the level-2 faith in democracy (subjective measurement of democracy) across different countries. The result is the same as that in Model II and nothing is found.
Finally, I add all of the level-2 variables as Model VIII shows for the control purpose. It is interesting that the fixed effects in Model VIII are almost the same as those in Model I. It means that political satisfaction in non-Islam countries are negatively correlated to faith in democracy. This seems to support the awareness hypothesis; nevertheless, I find that this
negative relationship becomes positive in Islam countries as the crossover effect of level-2 Dummy “Islam” shows and this effect discredits the awareness hypothesis. Besides, the positive countervailing crossover effect of Level-2 Political Satisfaction as discussed earlier does not support the awareness hypothesis, either. Therefore what we know from the above findings is that the people do have stronger faith in democracy is they are not satisfied with government, but this relationship exists in non-Islamic countries instead of Islamic ones.
The remaining findings in Model VIII give little support toward the awareness hypothesis. In terms of contextual effects, people in a country where religiopolitical orientation is higher will have less faith in democracy on average such as in an Islamic society. Regarding the crossover effects, two of the three findings have been discussed in Model V and Model VI, and both of which do not support the awareness hypothesis substantially. The only new finding is the crossover effect of GDP Per Capita on Level-1 Religiopolitical Orientation, and it suggests the negative relationship will become milder as the level of economic development is advanced, but steeper if the development remains low. This result to certain degree supports the curvilinear hypothesis on religion and
modernization as we discussed earlier since religion becomes a less significant marker to tell whether people are traditional or modern in a more developed society. Religion can be a spiritual good and therefore people with strong religiopolitical thoughts can be as modern as those who are more secularized. Overall, the fantasy hypothesis is more persuasive than the awareness hypothesis in all of the eight models presented in this section.
V. Conclusions
It must be very disappointed for the critics of the modernization theory that the fantasy hypothesis is more supported by empirical evidence. However, it doesn’t change the fact that people in the Islamic countries have faith in democracy as strong as those in the advanced western countries. We don’t need to be over-pessimistic about the prospect of democratization in the Muslim societies. At least the people support democracy and they recognize democracy is a better political system subjectively. This is the foundation that democratization can take root if only the condition is ripe.
Nonetheless, the findings in this paper also tell us not to be over-optimistic about interpreting the statistics of survey data about democracy in the Muslim societies. Democracy may mean something different from what people think in the West. People in the Islamic world support democracy not necessarily because of individualism or liberalism, but because they use the term democracy to embrace all the nice characteristics in their mind. From the global perspective, the conditionality of democracy we found in this study is still what modernization theorists depicted forty years ago such as economic development,
secularization, and change of the value system for more social trust as well as gender equality. It would be very difficult to argue that the Islamic countries must repeat the path of the West for democratization, but the conditionality in general describes what we have known in the
data very well. Unless we have more data or better methodology, there is no reason to reject the modernization theory.
There is plenty of room to improve this research. I want to raise a concern about the data problem. While World Value Survey has a great reputation for so many years in political science community, there is always some doubt about the quality of measurement from conceptualization, questionnaire design, and sampling method to survey technique, interviewer training, execution, and even data cleaning. As we have discussed, the high average of faith in democracy in Islamic countries could possibly mean different things. It may mean something substantial that needs to explain as we try to do in this paper. Or it may be artificially made due to the methodological problem of the survey. Still, the data may have nothing wrong but the problem is more technical such as using wrong scaling methods or choosing wrong instruments for measurement etc. One way to tackle this problem is using open questions or doing another in-depth focus group study to understand what people think of democracy when they are interviewed. Then we will have more qualitative information to evaluate and modify our survey question or quantitative methods for analysis. This is an important step we have to work on in the near future.
VI. References
Al-Suwaidi, J. (1995). “Arab and Western Conceptions of Democracy: Evidence from a UAE Opinion Survey,” in D. Garnham and M. Tessler, eds., Democracy, War , and Peace
in the Middle East. Bloomington: Indiana University Press, pp.82-115.
Casanova, Josè. (1994). Public Religions in the Modern World. Chicago: The University of Chicago Press.
Hadden, J. K. (1987). Toward Desacralizing Secularization Theory. Social Forces, 65: 587-611.
Huang, Min-Hua. (2004). Why Do People Support Political Islam? A Comparative Study of Eight Muslim. Ph.D. dissertation, University of Michigan.
Huang, Min-Hua. (2005). How Do We Interpret the Popular Support of Political Islam in the Muslim Societies? A Multilevel Analysis. Journal of Social Science and Philosophy, forthcoming. (In Chinese)
Inglehart, Ronald. and Wayne E. Baker. (2000). Modernization, Cultural Change, and the Persistence of Traditional Values. American Sociological Review, 65:19-51. Inglehart, Ronald. (1997). Modernization and Postmodernization: Cultural, Economic, and
Political Change in 43 Societies. Princeton: Princeton University Press.
Pipes, Daniel. (1983). In the Path of God: Islam and Political Power. New York: Basic Books.
Przeworski, Adam. et. al. (2000). Democracy and Development: Political Institutions and
Tessler, Mark. (2002). Islam and Democracy in the Middle East: The Impact of Religious Orientations on Attitudes Toward Democracy in Four Arab Countries. Comparative
Politics, 34: 337-354.
Tessler, Mark. (2003). Arab and Muslim Political Attitudes: Stereotypes and Evidence from Survey Research.” International Studies Perspective, 4: 175-81.
VII. Appendix
Research Design and Methodology
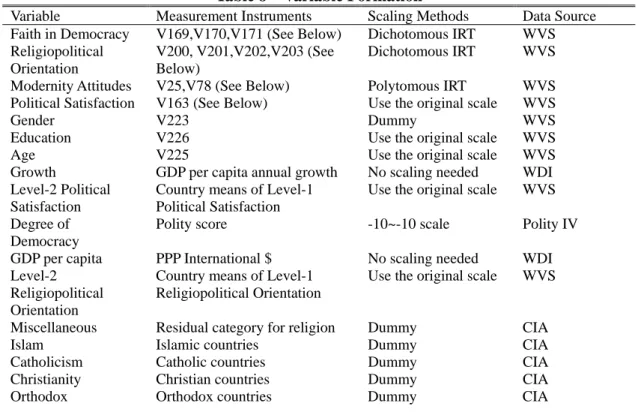
The dependent variable in this paper is Faith in Democracy. It is a subjective measurement of how positively people evaluate democracy as a political system. There are several independent variables in both individual and country levels. The information about variable formation and scaling methods can be found as follows:
Table 8 Variable Formation
Variable Measurement Instruments Scaling Methods Data Source Faith in Democracy V169,V170,V171 (See Below) Dichotomous IRT WVS Religiopolitical
Orientation
V200, V201,V202,V203 (See Below)
Dichotomous IRT WVS
Modernity Attitudes V25,V78 (See Below) Polytomous IRT WVS Political Satisfaction V163 (See Below) Use the original scale WVS
Gender V223 Dummy WVS
Education V226 Use the original scale WVS
Age V225 Use the original scale WVS
Growth GDP per capita annual growth No scaling needed WDI Level-2 Political
Satisfaction
Country means of Level-1 Political Satisfaction
Use the original scale WVS
Degree of Democracy
Polity score -10~-10 scale Polity IV
GDP per capita PPP International $ No scaling needed WDI Level-2
Religiopolitical Orientation
Country means of Level-1 Religiopolitical Orientation
Use the original scale WVS
Miscellaneous Residual category for religion Dummy CIA
Islam Islamic countries Dummy CIA
Catholicism Catholic countries Dummy CIA
Christianity Christian countries Dummy CIA
Orthodox Orthodox countries Dummy CIA
The Exact Wording of the Items (all have been re-phrased in accord to the variable name.) V25 Generally speaking, I would say that most people can be trusted.
V78 I don’t agree that men should have more rights to a job than women when jobs are scarce. V163 I think the system for governing this country is good.
V169 I disagree the statement that economy runs badly in democracy.
V170 I disagree that democracies are indecisive and have too much quibbling. V171 I disagree the democracies aren’t good at maintaining order.
V200 Politicians who do not believe in God are unfit for public office. V201 Religious leaders may influence how people vote in elections.
V202 It would be better for this country if more people with strong religious beliefs held public office.
V203 Religious leaders may influence government decisions.
Regarding the seven tables in the main text, Table 1, 2 and 3 are simply listing
descriptive statistics. Table 4 is the ANOVA table for several important variables. Table 5 is a short summary of the comparison between Christian and Islamic countries in Table 4. Table 6 is a summary of the expected relationships for the two hypotheses. Finally, Table 7 is the result of the hierarchical linear modeling.
Hierarchical linear modeling is the method applied here. Detailed information can be found in Huang (2004). HLM 5.05 is the program for running the model. Since the number of cases in both levels is above 30, we can add several level-2 variables for the control purpose without worrying about the sample-size problem. The centering method for the level 1 is by group means for Religiopolitical Orientation, Modernity attitudes, and Political Satisfaction. Other level-1 background variables are fixed at 40 years old male with complete secondary education (university-preparatory type). At the level 2, the centering method is by grand means, except for the level-2 dummy variables. The weighting method is to adjust each level-2 case with an equal weight.