不完全語意偏好關係預測導入企業資源規劃成功率架構
研究成果報告(精簡版)
計 畫 類 別 : 個別型
計 畫 編 號 : NSC 98-2410-H-151-006-
執 行 期 間 : 98 年 08 月 01 日至 99 年 07 月 31 日
執 行 單 位 : 國立高雄應用科技大學國際企業系
計 畫 主 持 人 : 王天津
計畫參與人員: 碩士班研究生-兼任助理人員:高禾淳
博士班研究生-兼任助理人員:彭淑珍
報 告 附 件 : 出席國際會議研究心得報告及發表論文
公 開 資 訊 : 本計畫涉及專利或其他智慧財產權,2 年後可公開查詢
中 華 民 國 99 年 10 月 31 日
行政院國家科學委員會補助專題研究計畫
; 成 果 報 告
□期中進度報告
不完全語意偏好關係預測導入企業資源規劃成功率架構
Applying Incomplete Linguistic Reference Relations to Forecast the
Success Possibility of Implementing ERP Systems
計畫類別:
;
個別型計畫 □整合型計畫
計畫編號:
NSC 98-2410-H-151-006
執行期間: 98 年 8 月 1 日 至 99 年 7 月 31 日
執行機構及系所:國立高雄應用科技大學 國際企業系
計畫主持人:
王天津
共同主持人:
計畫參與人員:
彭淑珍、高禾淳 (兼任助理二人)
成果報告類型(依經費核定清單規定繳交):;精簡報告 □完整報告
本計畫除繳交成果報告外,另須繳交以下出國心得報告:
□赴國外出差或研習心得報告
□赴大陸地區出差或研習心得報告
;出席國際學術會議心得報告
□國際合作研究計畫國外研究報告
處理方式:
除列管計畫及下列情形者外,得立即公開查詢
□涉及專利或其他智慧財產權,□一年□二年後可公開查詢
中 華 民 國 99 年 10 月 30 日
Abstract—This study applies an analytic hierarchical prediction model based on Multi-Criteria Decision Making with Incomplete Linguistic Preference Relations(InLinPreRa) to help the organizations become aware of the essential factors affecting the Enterprise Resource Planning(ERP), as well as identify the actions necessary before implementing ERP. The subjectivity and vagueness in the prediction procedures are dealt with using linguistic terms quantified in an interval scale[- , ]t t . Then predicted success/failure values are obtained
to enable organizations to decide whether to initiate ERP, inhibit adoption or take remedial actions to increase the possibility of successful ERP. The empirical results not only demonstrate the senior manager support degree, organizational and coordination are the three most important influential factors in the ERP initiative process, but also reveal the applicability and feasibility of reciprocal Incomplete Linguistic Preference Relation(InLinPreRa) for solving complicated hierarchical multiple attribute prediction problems.
Keywords: InLinPreRa, Incomplete Linguistic Preference Relations, ERP, Multi-Criteria Decision Making, Analytical Hierarchy process.
I. INTRODUCTION
nterprise resource planning (ERP) is an enterprise-wide application software package that integrates all necessary business functions into a single system with a common database. In order to implement an ERP project successfully in an organization, it is necessary to select a
suitable ERP system[1-3]. This study uses Incomplete
Linguistic Preference Relations under Multi-Criteria Decision Making to predict the success/failure values of the ERP system. The method uses simple calculation and speeds up the process of comparison and selection of alternative. Decision makers obtain the matrix by choosing a finite and fixed set of alternatives and set a pairwise comparison based on their different preferences and knowledge. The next section discusses the literatures related to ERP, fuzzy preference relation, and Incomplete Linguistic Preference Relations. An analytic hierarchy framework based on the Multi-Criteria Decision Making with Incomplete Linguistic Preference Relations for predicting ERP implementation is described in Section 3. In Section 4, an empirical case of ERP initiative in Taiwan is presented. Finally conclusions are given in Section 5.
II. LITERATURE REVIEW
A. Enterprise Resource Planning(ERP)
In the dynamic and unpredictable business environments, companies face the tremendous challenge of expanding markets and rising customer expectations. This compels them to lower total costs in the entire supply chain, shorten
throughput times, reduce inventories, expand product choice, provide more reliable delivery dates and better customer service, improve quality, and efficiently coordinate globe demand, supply and production. Due to high cost and complication of the implementing process, it is not easy to install ERP system successfully. Thus, for most companies, being able to predict the rates of success before installing the system and finding the factors that influence the ERP success are important .
B. Fuzzy Preference Relations
Herrera-Viedma et al. (2004)[4]proposed Fuzzy Preference
Relations to understand the inconsistent problems in analytic hierarchy process that are caused by multi-decision-makers, multi-criteria, and multi-alternatives. Preference Relation means that the decision maker counters a set of criteria or alternatives according to the linguistic variables so as to carry out the pairwise comparison, then a mapping value can be derived; this value represents the degree of preference of the first alternative over the second alternative. Wang and
Chen (2007) [5]utilized fuzzy preference relations to
criticize the fuzzy analytical approach to partnership selection.
C. The Decision Making Matrix of Incomplete Linguistic Preference Relations
Linguistic preference relations are usually used by decision makers to express their linguistic preference information based on pairwise comparisons (Xu, 2005) [6]. Xu (2006)[7]
proposed the Incomplete Linguistic Preference Relations. The relevant definitions are described as follows.
1) Definition 1: Incomplete
Linguistic
Preference Additive Relation
Let A=(aij n n)× be linguistic preference relation, if A is an incomplete linguistic preference relation, it counters the fact that decision makers can carry out pairwise comparison for attributes so as to satisfy Eq. (1)
0 0 , ,
ij ij ji ii
a ∈S a ⊕a =S a =S (1)
2) Definition 2: Incomplete
Linguistic
Consistent Additive Preference Relation:
Let A=(aij n n) × be complete consistent additive preference
relation, which counters all of the i j k, , decision makers for pairwise comparison, if a >Sik 0 represents xi is better
than xk; while a >Skj 0 represents xk is better than xj,
then a >Sij 0 can be derived the equation of xi better than
j
x is
=
ij ik kj
a a ⊕a (2)
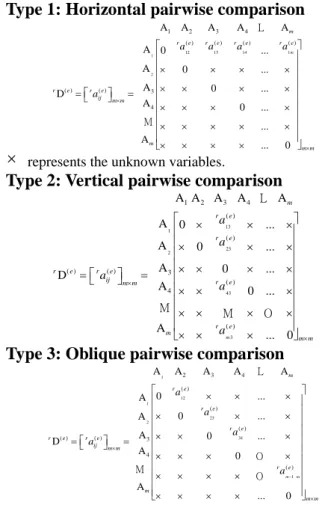
3) Definition 3: The Algorithm Rules of Three
Different Kinds of Pairwise Comparison Decision
Application of Incomplete Linguistic Preference Relations in
predicting the success of ERP Implementation
Making Matrices
Then based on equations, preference relation matrix is generated. For different known factors of decision-making expert’s choice, it could obtain few matrices. The algorithm rules of the three different decision making matrices are shown as below:
Type 1: Horizontal pairwise comparison
13 1 12 14 1 2 1 2 3 4 ( ) ( ) ( ) ( ) ( ) ( ) 3 4 A A A A A A 0 ... A 0 ... A 0 ... D A 0 ... ... A ... 0 m m r e r e r e r e r e r e ij m m m m m a a a a a × × ⎡ ⎤ ⎢ ⎥ ⎢× × × × ⎥ ⎢ ⎥ ⎢× × × × ⎥ ⎡ ⎤ =⎣ ⎦ = ⎢ ⎥ ⎢× × × × ⎥ ⎢ ⎥ × × × × × ⎢ ⎥ ⎢× × × × ⎥ ⎣ ⎦ L M
×
represents the unknown variables.Type 2: Vertical pairwise comparison
13 1 23 2 43 3 1 2 3 4 ( ) ( ) ( ) ( ) 3 ( ) 4 ( ) A A A A A A 0 ... A 0 ... A 0 ... D A 0 ... A ... 0 m m r e r e r e r e ij r e m m r e m m m a a a a a × × ⎡ × × ×⎤ ⎢ ⎥ ⎢× × ×⎥ ⎢ ⎥ ⎢× × × ×⎥ ⎡ ⎤ =⎣ ⎦ = ⎢ ⎥ ⎢× × ×⎥ ⎢ ⎥ × × × × ⎢ ⎥ ⎢ ⎥ × × × ⎣ ⎦ L M M O
Type 3: Oblique pairwise comparison
1 12 1 23 2 34 1 2 3 4 ( ) ( ) ( ) ( ) ( ) 3 4 ( ) A A A A A 0 ... A 0 ... A A 0 ... D A 0 A ... 0 m m m r e r e r e r e r e ij m m r e m m m a a a a a− × × ⎡ × × × ⎤ ⎢ ⎥ ⎢× × × ⎥ ⎢ ⎥ ⎢× × × ⎥ ⎡ ⎤ ⎢ ⎥ =⎣ ⎦ = ⎢× × × × ⎥ ⎢ ⎥ ⎢× × × × ⎥ ⎢ ⎥ ⎢× × × × ⎥ ⎣ ⎦ L O M O
III. FRAMEWORK FOR PREDICTING ERP IMPLEMENTATION
This section comprises four subsections: investigating the influential factors on ERP initiative, determining the priority weights of influential factors, determining the priority ratings for possible out regarding factors, and obtaining the priority weight for prediction.
A. Investigating the influential factors on ERP implementation
The influential factors are derived though widespread investigation and consultation with several experts, including two professionals , three senior mangers, three Systems Analysts and three random sampling staff to analyze the chance if successful ERP implementation. Synthesizing the literature review from, the opinions of these experts are utilized to yield the seven key influential factors used in this study.
B. Determining the priority weights of influential factors Subjectivity and vagueness within the measuring process are dealt with using linguistic variables quantified in a scale of
[- , ]t t . This study are used linguistic to express their strength of preference among influential factor.
1) Linguistic variables
This study provides the evaluators simple linguistic terms quantified on a scale of [-8,8] to express their strength of preference among influential factors (see Table 1). Linguistic variables [8] are simultaneously used to measure the likelihood of success/failure regarding each influential factor (see Table 2).
Table 1 Linguistic terms for the importance weights of influential factors
Definition value value
Absolutely more
important (AB) 8
Less Weakly more important
(LWK) -2
Very strongly more
important (VS) 6
Less Strongly more
important (LST) -4 Strongly more important
(ST) 4
Less Very strongly more
important (LVS) -6 Weakly more important
(WK) 2
Less Absolutely more
important (LAB) -8 Equally important (EQ) 0
Table 2 Linguistic variables for the priority ratings of possible outcome Definition value Very high (VH) 5 4 High (H) 2 Fair (F) 0 Less High (LH) -2
Less Very high (LVH) -4
2) Obtaining priority weights of influential factor
Although Xu’s method made the evaluating process more flexible, he only focused on comparing one unique standard.
Wang and Hsu[9] improved Xu’s method with multi-criteria
and applied to a selection of hearing aids. The following describes the procedures for obtaining the prioritise of influential factors.
♦ Construct pairwise comparison matrices amongst the influential factors ( Cr ,r=1, 2,...,k ). The evaluators
( Ee , e=1, 2,...,n ) used three types of pairwise
comparisons algorithm which are horizontal vertical and oblique to construct pairwise comparison matrices. Three kinds of matrices are as below.
1 2 3 4 ( ) ( ) ( ) ( ) 1 12 13 14 1 2 3 ( ) ( ) 4 ... 0 ... 0 ... 0 ... 0 ... ... ... ... ... ... 0 ... 0 k k k e e e e k e e ij k kxk C C C C C C a a a a C C C a C C × ⎡ ⎤ ⎢ ⎥ × × × × ⎢ ⎥ ⎢× × × × ⎥ ⎡ ⎤ =⎣ ⎦ = ⎢ ⎥ × × × × ⎢ ⎥ ⎢ × ⎥ ⎢ ⎥ × × × × ⎢ ⎥ ⎣ ⎦
1 2 3 4 1 ( ) 21 2 ( ) 3 31 ( ) ( ) ( ) 4 41 ( ) 1 ... 0 ... 0 ... 0 ... 0 ... ... ... ... ... ... 0 ... 0 k k k e e e e ij e e k k kxk C C C C C C a C a C C a C a C a × × × × × ⎡ ⎤ ⎢ × × ×⎥ ⎢ ⎥ ⎢ × × ×⎥ ⎢ ⎥ ⎡ ⎤ =⎣ ⎦ = ⎢ × × ×⎥ ⎢ ⎥ × ⎢ ⎥ ⎢ × × × ⎥ ⎣ ⎦ 1 2 3 4 ( ) 12 1 ( ) 2 23 ( ) 3 ( ) ( ) 34 4 ( ) -1 ... 0 ... 0 ... 0 ... 0 ... ... ... ... ... ... 0 ... 0 k k k e e e e e ij e k k k kxk C C C C C a C C a C a C a C a C × ⎡ × × × ⎤ ⎢ ⎥ × × × ⎢ ⎥ ⎢× × × ⎥ ⎢ ⎥ ⎡ ⎤ =⎣ ⎦ = ⎢× × × × ⎥ ⎢ ⎥ ⎢ ⎥ ⎢× × × × ⎥ ⎣ ⎦ The remaining ( ) ij e
a can be calculates using Eq.(1) and
Eq.(2) to obtain the other known
×
of triangular secondhalf. Finally, obtain the full preference matrix.
♦ Transform the preference value ( )
ij e a into ( ) ij e b in an
interval scale [0,1] ,then the matrix Ct obtained as
( )
( e)
Ct=f C . The transformation function is given by
: [ , ] [0,1] f −a a → , ( ) 2 x a f x a + = (3a) 1 2 3 4 ( ) ( ) ( ) ( ) 12 13 14 1 1 ( ) ( ) ( ) ( ) 21 23 24 2 2 ( ) ( ) ( ) ( ) ( ) ( ) 3 31 32 34 3 ( ) ( ) 4 41 42 43 ... 0 ... 0 ... 0 ... ... ij k e e e e k e e e e k e e e e e e k e e kxk k C C C C C b b b b C b b b b C C b b b b Ct b C b b b C ⎡ ⎤ =⎣ ⎦ = ( ) ( ) 4 ( ) ( ) ( ) ( ) 1 2 3 4 0 ... ... ... ... ... ... ... ... 0 e e k e e e e k k k k kxk b b b b b ⎡ ⎤ ⎢ ⎥ ⎢ ⎥ ⎢ ⎥ ⎢ ⎥ ⎢ ⎥ ⎢ ⎥ ⎣ ⎦ (3b)
♦ Utilize the method of average value to integrate the judgment values of n evaluators, namely
[ ij kxk] C= p (4a) 1( (1) (2) ... ( )) 1 ( ) 1 1,2,..., , =1,2,..., ij ij ij ij n n e pij b b b b n n e i k j k = + + + = = =
∑
(4b)♦ Use
h
ij to indicate the normalized preference values of each influential factor, such as1 2 3 4 ( ) ( ) ( ) ( ) 12 13 14 1 1 ( ) ( ) ( ) ( ) 21 23 24 2 2 ( ) ( ) ( ) ( ) 3 31 32 34 3 ( ) ( ) ( ) ( ) 4 41 42 43 4 ... 0 ... 0 ... 0 ... [ ] = 0 ... ... k e e e e k e e e e k e e e e k ij kxk e e e e k k C C C C C h h h h C h h h h C C h h h h C h C h h h h C = ( ) ( ) ( ) ( ) 1 2 3 4 ... ... ... ... ... ... ... 0 e e e e k k k k kxk h h h h ⎡ ⎤ ⎢ ⎥ ⎢ ⎥ ⎢ ⎥ ⎢ ⎥ ⎢ ⎥ ⎢ ⎥ ⎢ ⎥ ⎢ ⎥ ⎢ ⎥ ⎢ ⎥ ⎣ ⎦ (5a) 1 1,2,... , 1,2,..., ij ij k ij i p h i k j k p = = = =
∑
(5b) ♦ Given the rw
denoting the priority weight ofinfluential factor
r
, the priority weight of each factor can be obtained that is1 1 1 1, 2,..., k rj j r k k ij i j h w i k h = = = =
∑
=∑∑
(6) 1w w,2 ,...,k w , rw∈[0,1], 1 1 k r r w = =∑
C. Determining the priority ratings for possible outcome regarding factors
The evaluators are asked to express their subjective judgments regarding the preference ratings of possible outcome(A ii, =1,2,...,m) regarding each influential factor in
linguistic terms, as listed in Table 2.
♦ The evaluators useed three types of pairwise comparisons algorithm to choose the best of two possible
outcome for a set of m-1preference. data under each
influential factor, three kinds of matrices are below.
12 23 34 -1 1 2 3 4 m ( ) 1 ( ) 2 ( ) 3 ( ) ( ) 4 ( ) ... 0 ... 0 ... 0 ... 0 ... ... ... ... ... ... ... 0 m m m m e r e r e r r e r e uv e r m m m A A A A A a A a A a A D a A a A × × ⎡ ⎤ ⎢ × × × ⎥ ⎢ ⎥ ⎢× × × ⎥ ⎢ ⎥ ⎢ ⎥ × × × ⎢ ⎥ ⎡ ⎤ =⎢ ⎥ = ⎢ ⎥ ⎣ ⎦ ⎢× × × × ⎥ ⎢ ⎥ ⎢ ⎥ ⎢ ⎥ ⎢ ⎥ ⎢× × × × ⎥ ⎣ ⎦ M 23 34 -1 12 1 2 3 4 m ( ) ( ) ( ) ( ) 1 2 3 ( ) ( ) 4 ... 0 ... 0 ... 0 ... 0 ... ... ... ... ... ... ... 0 m m m m e e e e r r r r r e r e uv m m m A A A A A a a a a A A A D a A A × × ⎡ ⎤ ⎢ ⎥ ⎢ ⎥ ⎢× × × × ⎥ ⎢ ⎥ ⎢ ⎥ × × × × ⎢ ⎥ ⎡ ⎤ =⎢ ⎥ = ⎢ ⎥ ⎣ ⎦ ⎢× × × × ⎥ ⎢ ⎥ ⎢ ⎥ × ⎢ ⎥ ⎢ ⎥ ⎢× × × × ⎥ ⎣ ⎦ M 2 1 31 4 1 1 1 2 3 4 1 ( ) 2 ( ) 3 ( ) ( ) ( ) 4 ( ) ... 0 ... 0 ... 0 ... 0 ... ... ... ... ... ... ... 0 m m m m r e r e r e r e uv r e r e m m m A A A A A A a A a A D a A a A a × × ⎡ × × × ×⎤ ⎢ ⎥ ⎢ ⎥ × × × ⎢ ⎥ ⎢ ⎥ × × × ⎢ ⎥ ⎡ ⎤ =⎣ ⎦ = ⎢ ⎥ × × × ⎢ ⎥ ⎢ ⎥ × ⎢ ⎥ ⎢ ⎥ ⎢ × × × ⎥ ⎣ ⎦ M
Using Eq.(1) and Eq.(2) to obtain the corresponding value. Finally, obtain the full preference matrix.
♦ Next, the preference value r ( )e uv
a is transformed in the
range [-4,4] into rbuv( )e in an interval scale [0,1] ,then the
matrix rDt obtained as rDt= f(rD( )e) . The
]
1
,
0
[
]
,
[
:
− a
a
→
f
, ( ) 2 x a f x a + = ( ) [ ] , 1,2,..., r r e uv mxm Dt= b u v= m (7)♦ Utilize the method of average value to integrate the judgment values of n evaluators, namely
[ ] r uv mxm D = q (8a) 1( (1) (2) ... ( )) 1 ( ) 1,2,..., , 1,2,..., 1 e r r r quv buv buv buv n n e rbuv u m v m n e = + + + = = = =
∑
(8b) ♦ Use r uvλ to indicate the normalized preference values of each influential factor, such as
[ ] r r uv mxm D= λ (9a) 1 , 1,2,..., r uv uv m uv u q u v m q λ = = =
∑
(9b) ♦ Consequently, r uϕ denoting the average rating of
possible outcome
u
with respect to influential factorr
is provided. The desired rating of each possible outcome can be obtained for each influential factor that is 1 1 m r r u uv v ϕ λ π = =
∑
(10)D. Obtaining the priority weight for prediction Multiplying the priority weights of influential factors by the ratings of possible outcomes, a predicted value Zu
for chance in success/failure implementation is obtained as:
r r
u u
Z =ϕ ⊗ w (11)
IV. NUMERICAL EXAMPLE
A steel manufacture company located in Taiwan wishes to increase benefit and gain competitive by initiating ERP implement. Due to high cost and complication of the implementing process, it is not easy to install ERP system successfully. Thus, CEO asks a group comprising two professionals , three senior mangers, three Systems Analysts and three random sampling staff to analyze the chance if successful ERP implementation.
A. Weighting calculation of the influential factors Seven major influential factors are considered in this problem of predicting the success of ERP implementation. The sequences of these seven influential factors are randomly assigned, namely, (C1)project procedure time, (C2)function of information system, (C3)user's cooperation, (C4) senior manager support degree, (C5)coordination, (C6)organizational, (C7)cost. The pairwise comparisons for these seven factors are obtained via a series of interviews with the assessment representatives.
1)
Based on the interviews with 11 members
regarding the importance on seven influential
factors, the pairwise comparison matrices for a set
of 6 factors are listed below.
(1) (1) (1) (1) (1) (1) (1) 12 23 34 45 56 67 { , , , , , } {VS, LSLV, LVLA, VT, LAB,ST} C a a a a a a = = (3) (3) (3) (3) (3) (3) (3) 21 23 24 25 26 27 { , , , , , } { , , , , , } C a a a a a a AV LST LAB VS LSLV WK = = (4) (4) (4) (4) (4) (4) (4) 21 31 41 51 61 71 { , , , , , } { , , , , , } C a a a a a a WK LVS LVLA VS LAB LSLV = = (5) (5) (5) (5) (5) (5) (5) 12 32 42 52 62 72 { , , , , , } { , , , , , } C a a a a a a LSLV LST WK ST LVLA LVLA = = (6) (6) (6) (6) (6) (6) (6) 31 32 34 35 36 37 { , , , , , } { , , , , , } C a a a a a a AV VS LST LVS LVLA LWK = = (7) (7) (7) (7) (7) (7) (7) 13 23 43 53 63 73 { , , , , , } { , , , , , } C a a a a a a SW WE LST LVS LAB WE = (8) (8) (8) (8) (8) (8) (8) 41 42 42 45 46 67 { , , , , , } { , , , , , } C a a a a a a AB LST LVLA LSLV LVS VT = = (9) (9) (9) (9) (9) (9) (9) 14 24 34 54 64 74 { , , , , , } { , , , , , } C a a a a a a ST LST LAB LWK LVLA VS = (10) (10) (10) (10) (10) (10) (10) 57 51 52 53 54 56 { , , , , , } { , , , , , } C a a a a a a AB LWK LVLA WE LVS WK = = (11) (11) (11) (11) (11) (11) (11) 57 17 27 37 47 67 { , , , , , } { , , , , , } C a a a a a a AV LWK LAB WK LVS SW = =
The evaluator 1 is used as an example base on Eq.(1) and Eq.(2) to obtain the other known × . Finally, obtain the full preference matrix.
(1) (1) 1 2 3 4 5 6 7 1 2 3 4 5 6 7 C 0 6 1 -6 -1 -9 -5 -6 0 -5 -12 -7 -15 -11 -1 5 0 -7 -2 -10 -6 6 12 7 0 5 -3 1 1 7 2 -5 0 -8 -4 9 15 k k ij a C C C C C C C C C C C C C C × ⎡ ⎤ = ⎣ ⎦ = 10 3 8 0 4 5 11 6 -1 4 -4 0 ⎡ ⎤ ⎢ ⎥ ⎢ ⎥ ⎢ ⎥ ⎢ ⎥ ⎢ ⎥ ⎢ ⎥ ⎢ ⎥ ⎢ ⎥ ⎢ ⎥ ⎣ ⎦
2)
Transform the preference value ( )ij e a into ( ) ij e b in
an interval scale [0,1] ,then the matrix
Ct
.(1) (1) 1 2 3 4 5 6 7 1 2 3 4 5 6 7 0.500 0.700 0.533 0.300 0.467 0.200 0.333 0.300 0.500 0.333 0.100 0.267 0.0 k k ij Ct b C C C C C C C C C C C C C C × ⎡ ⎤ = ⎣ ⎦ = 00 0.133 0.467 0.667 0.500 0.267 0.433 0.167 0.300 0.700 0.900 0.733 0.500 0.667 0.400 0.533 0.533 0.733 0.567 0.333 0.500 0.233 0.367 0.800 1.000 0.833 0.600 0.767 0.500 0.633 0.667 0.867 0.700 0.467 0.633 0.367 0.500 ⎡ ⎤ ⎢ ⎥ ⎢ ⎥ ⎢ ⎥ ⎢ ⎥ ⎢ ⎥ ⎢ ⎥ ⎢ ⎥ ⎢ ⎥ ⎢ ⎥ ⎣ ⎦
(1)-(2) stated above can calculate the preference relation matrices of the other ten evaluators; therefore, using Eq.(4a) , the averaged pairwise comparison matrix of eleven
evaluators can be obtained as listed below.
1 2 3 4 5 6 7 1 2 3 4 5 6 7 0.500 0.478 0.443 0.398 0.440 0.405 0.465 0.522 0.500 0.465 0.420 0.462 0.427 0.487 0.557 0.535 0.500 0.45 k k ij C C C C C C C C C C C C p C C C × ⎡ ⎤ =⎣ ⎦ = 4 0.496 0.461 0.521 0.602 0.580 0.546 0.500 0.542 0.507 0.567 0.560 0.538 0.504 0.458 0.500 0.465 0.525 0.595 0.573 0.539 0.493 0.553 0.500 0.573 0.535 0.513 0.479 0.433 0.475 0.427 0.500 ⎡ ⎤ ⎢ ⎢ ⎢ ⎢ ⎢ ⎢ ⎢ ⎢ ⎢⎣ ⎦7 7x ⎥ ⎥ ⎥ ⎥ ⎥ ⎥ ⎥ ⎥ ⎥
4)
Eq.(5a) is used to normalize the aggregated pairwisecomparison matrix. 1 2 3 4 5 6 7 1 2 3 4 5 6 7 0.129 0.129 0.119 0.126 0.127 0.127 0.128 0.135 0.135 0.125 0.133 0.133 0.134 0.134 0.144 0.144 0.135 0.14 k k ij C C C C C C C C C C C C h C C C × ⎡ ⎤ =⎣ ⎦ = 4 0.143 0.145 0.143 0.156 0.156 0.147 0.158 0.156 0.159 0.156 0.145 0.145 0.135 0.145 0.144 0.146 0.144 0.154 0.154 0.145 0.156 0.159 0.157 0.157 0.138 0.138 0.129 0.137 0.137 0.134 0.137 ⎡ ⎤ ⎢ ⎢ ⎢ ⎢ ⎢ ⎢ ⎢ ⎢ ⎢⎣ ⎦7 7x ⎥ ⎥ ⎥ ⎥ ⎥ ⎥ ⎥ ⎥ ⎥
5)
The priority weight of each influential factor can the be obtained by Eq.(6). The priority weight and rank of each influential factor assessed by eleven evaluators are listed in Table 3 The rank of the influential factor importance weight is substituted as:Table 3 The rank of the influential factor importance weight
C1 C2 C3 C4 C5 C6 C7 Total Rank Weight C1 0.129 0.129 0.119 0.126 0.127 0.127 0.128 0.884 7 0.128 C2 0.135 0.135 0.125 0.133 0.133 0.134 0.134 0.928 6 0.134 C3 0.144 0.144 0.135 0.144 0.143 0.145 0.143 0.997 4 0.144 C4 0.156 0.156 0.147 0.158 0.156 0.159 0.156 1.088 1 0.157 C5 0.145 0.145 0.135 0.145 0.144 0.146 0.144 1.004 3 0.145 C6 0.154 0.154 0.145 0.156 0.159 0.157 0.157 1.083 2 0.156 C7 0.138 0.138 0.129 0.137 0.137 0.134 0.137 0.951 5 0.137 Total 6.935 1.000 (0.157) (0.156) (0.145) (0.144) (0.137) (0.134) (0.128) C4 C6 C5 C3 C7 C2 C1 f f f f f f
B. Calculation of the weights for possible outcomes with respect to influential factors
If every influential factor has a strong presence in the company, then implement ERP system is more likely to be successful. To determine the priority weight matrix for possible outcomes with respect to each influential factor, the linguistic variables for evaluators are listed in Table 2. The priority weights of two possible outcomes are calculated as follow.
1) The eleven evaluators are interviewed to assess which is more likely to occur according to each influential factors. All the opinions of these eleven evaluators regarding the preference intensity for the chance of success and failure with respect to each influential factor are described in Table 4.
2) Transform the values in the scale [-4,4] into the interval [0,1]. Inverse comparison for failure and success.
3) Using Eq.(8a) average value to integrate the judgment values of n evaluators.
4) Using Eq.(9a) and Using Eq.(10) the can be used to normalize and synthesize the preference ratings of two possible outcomes based on seven in influential factors. 5) The normalized values and priority ratings are listed in
Table 5.
Table 4 Linguistic variables given to the priority ratings of two possible outcomes
(1)
D
D
( )2D
( )3D
( )4D
( )5D
( )6D
( )7D
( )8D
( )9D
(10)D
(11)F
F
F
F
F
F
F
F
F
F
F
1C
S
H LHF VH VH F VHG VHG HF VHG VHG H 2C
S
LVH VHG VHG LH HF HF H VHG H H HF 3C
S
VHG VH HF HF LHF H LHF HF LHF LVHG F 4C
S
VH H VHG H H VHG VH H H VHG H 5C
S
HF H H LHF H F H HF H LVHG VH 6C
S
VH H H F VH H VH VH VHG VHG VH 7C
S
H HF VH VHG VHG H F HF VH VHG H Not:S
,F
denoting the abbreviation of success and failure respectively.( )n
Table 5 Normalize priority ratings of possible outcomes based on seven factors
Success Failure Total Priority
Rating Success Failure Total Priority Rating 1
C
Success 0.688 0.607 1.295 0.647C
5 Success 0.579 0.560 1.139 0.569 Failure 0.313 0.393 0.705 0.353 Failure 0.421 0.440 0.861 0.431 2C
Success 0.579 0.560 1.139 0.569C
6 Success 0.786 0.633 1.419 0.710 Failure 0.421 0.440 0.861 0.431 Failure 0.214 0.367 0.581 0.290 3C
Success 0.537 0.532 1.069 0.534C
7 Success 0.698 0.611 1.309 0.655 Failure 0.463 0.468 0.931 0.466 Failure 0.302 0.389 0.691 0.345 4C
Success 0.746 0.624 1.370 0.685 Failure 0.254 0.376 0.630 0.315Table 6 Prediction successful and failure ERP implementation
1
C
C
2C
3C
4C
5C
6C
7 Prediction probabilityFactor weight 0.128 0.134 0.144 0.157 0.145 0.156 0.137
Success 0.647 0.569 0.534 0.685 0.569 0.710 0.655
0.626
Failure 0.353 0.431 0.466 0.315 0.431 0.290 0.345
0.374
C. Determining the prediction possibilities of successful and failure ERP implementation
Using Eq.(11), the prediction successful and failure ERP implementation are listed in Table 6. The prediction successful and failure ERP implementation as below: (0.353* 0.128) (0.431* 0.134) (0.466 * 0.144) (0.315* 0.157) (0.431* 0.145) (0.290 * 0.156) (0.345* 0.137) 0.374 failure Z = + + + + + + = (0.647 * 0.128) (0.569 * 0.134) (0.534 * 0.144) (0.685* 0.157) (0.569 * 0.145) (0.710 * 0.156) (0.655* 0.137) 0.626 success Z = + + + + + + = V. ACKNOWLEDGMENT
The study is the research results of the 2008
funding research project of the National Science
Council of the Republic of China (Number of the
project :NSC 97-2410-H-151-017). The authors
appreciate for financial supporting from the
Council sincerely.
VI. CONCLUSIONS
In order enterprises and organizations, growing revenues, increasing profits, improving customer services, shortening product-manufacturing cycle and enhancing competitive competency are cited ERP systems. Then predicted success/failure values are obtained to enable organizations to decide whether to initiate ERP, inhibit adoption or take remedial actions to increase the possibility of successful ERP. A successfully implemented ERP can offer organizations many major benefits, including automating business process, timely access to management information
and improving supply chain management through the use of e-commerce. The empirical results not only demonstrate the senior manager support degree, organizational and coordination are the three most important influential factors in the ERP initiative process, but also reveal the applicability and feasibility of reciprocal Incomplete Linguistic Preference Relation for solving complicated hierarchical multiple attribute prediction problems. Subsequently, organizations or enterprises planning to initiate ERP system can apply the proposed prediction model to enhance their decision-making process and take proper actions to avoid wasting time and money before ERP Implementation.
VII. REFERENCES
[1] Holland, C. P. and B. Light, “A Critical Success Factors Model for ERP Implementation”, IEEE Software ,vol. 16, no.3, pp. 30-36, 1999. [2] Hunter, Richard, “The Big Bad ERP, Executive Edge”, 7-8 (1999) [3] Illa, X. B., X. Franch and J. A. Pastor, “Formalising ERP Selection
Criteria”, IEEE Computer Society, pp. 115-122, (2000.
[4] Herrera-Viedma, E., Herrera, E., Chiclana, F., Luque, M. , “Some issues on consistency of fuzzy preference relations”, European
Journal of Operational Research, vol. 154, 2004, pp 98-109, 2004.
[5] Wang, T.C., Chen, Y.H., ”Applying consistent fuzzy preference relations to partnership selection”, Omega, vol. 35. no.4, pp. 384—388, 2007.
[6] Xu, Z.S., “Deviation measures of linguistic preference relations in group decision making”, Omega, vol. 33, pp. 249-25, 2005. [7] Xu, Z.S., “Incomplete linguistic preference relations and their
fusion”, Information Fusion, vol. 7, no.3, pp. 331-337, 2006. [8] Wang, T.C., Chiang Y.C., Hsu, S.C., “Applying Incomplete
Linguistic Preference Relations to a Selection of ERP System Suppliers”, The 3th IEEE International conference on Wireless
Communications, Networking and Mobile Computing, pp. 119-123,
2007.
[9] Wang, T.C., Hsu, S.C., Chiang Y.C., “Multi-criteria Decision Making with Expansion of Incomplete Linguistic Preference Relations, WSEAS Transaction on Mathematics”, vol.6, no. 9, pp. 817-823, 2007.
表 Y04
出席國際學術會議心得報告
計畫編號
NSC 98-2410-H-151-006
計畫名稱
不 完 全 語 意 偏 好 關 係 預 測 導 入 企 業 資 源 規 劃 成 功 率 架 構
Applying Incomplete Linguistic Reference Relations to Forecast the Success
Possibility of Implementing ERP Systems
出國人員姓名
服務機關及職稱
王天津
國立高雄應用科技大學 國際企業系 教授
會議時間地點
民國
98 年 8 月 12 日至 98 年 8 月 14 日止 (3 天)
Shenyang, China
會議名稱
2009 Ninth International Conference on Hybrid Intelligent Systems (HIS-20)
發表論文題目
發表
1 篇英文論文:
The Evaluation of the Incomplete Linguistic Preference Relations on the
performance of Web shops
<共發表 1 篇論文,為 EI 引用>
報告內容應包括下列各項:
一、 參加會議經過
本研討會在瀋陽市舉辦之國際研討會,
網址為:
http://his2009.net/index.asp
。論文為
EI
引用。
二、 與會心得
許多國內外學者與會,包括中國大陸的學者,大陸學者相當積極發表論文,應該鼓勵
台灣學者多參加國外國際學術研討會。
三、 考察參觀活動(無是項活動者省略)
四、 建議
建議多多鼓勵國內師生到國外發表文章為國爭光。
五、 攜回資料名稱及內容
表 Y04
本人發表
1 篇論文摘要如下:
Abstract—The proposes of this study is to ascertain the effect of using Incomplete Linguistic
Preference Relations based group decision making under a fuzzy environment to help decision
makers select the best one amongst multiple criteria and alternatives. This study not only
applies Multi-Criteria Decision Making with Incomplete Linguistic model (InlinPreRa) and
uses horizontal, vertical and oblique pairwise comparison algorithms to construct but also
expansion group decision making model. When the decision maker is carrying out the pairwise
comparison, the following problems can be avoided: time pressure, lack of complete
information, the decision maker is lack of this professional knowledge, or the information
provided is unreal and thus it is difficult to obtain information. In this study, the Web shops’
performances will be evaluated effective and immediate in this model.
Keywords: Multi-Criteria Incomplete Linguistic Preference Relations, InlinPreRa, MCDM,
表 Y04
計畫編號
NSC 98-2410-H-151-006
計畫名稱
不 完 全 語 意 偏 好 關 係 預 測 導 入 企 業 資 源 規 劃 成 功 率 架 構
Applying Incomplete Linguistic Reference Relations to Forecast the Success
Possibility of Implementing ERP Systems
出國人員姓名
服務機關及職稱
王天津
國立高雄應用科技大學 國際企業系 教授
會議時間地點
民國
98 年 8 月 18 日至 98 年 8 月 20 日止 (3 天)
中國西安市
會議名稱
2009 Fifth International Conference on Information Assurance and Security
(IAS09)
發表論文題目
發表
1 篇英文論文:
An approach to group decision making based on Incomplete Linguistic
Preference Relations
<共發表 1 篇論文,為 EI 引用>
一、 參加會議經過
1. 98年8月18日參加在西安市舉辦之 “
2009 Fifth International Conference on Information
Assurance and Security (IAS09)” 研 討 會 , 此 研 討 會 論 文 集 為 EI 引 用 。
http://bit.kuas.edu.tw/~ias09/
。
2. 發表1篇英文論文。
二、 與會心得
8月12日在瀋陽參加研討會結束之後,旋即到西安市參加“
2009 Fifth International
Conference on Information Assurance and Security (IAS09)”研討會,有多位大陸學者參
加。與西安電子科技大學舉辦的研討會,西安電子科技大學在大陸為排名前面之重點大
學。
三、 考察參觀活動(無是項活動者省略)
四、 建議
建議多多鼓勵國內師生到國外發表文章為國爭光。
五、 攜回資料名稱及內容
論文集與研討會光碟。
表 Y04
Abstract—This study not only applies Multi-Criteria Decision Making with Incomplete
Linguistic model (InlinPreRa) and uses horizontal, vertical and oblique pairwise comparison
algorithms to construct but also expansion group decision making model. When the decision
maker is carrying out the pairwise comparison, the following problems can be avoided: time
pressure, lack of complete information, the decision maker is lack of this professional
knowledge, or the information provided is unreal and thus it is difficult to obtain information.
Keywords: Multi-Criteria, Incomplete Linguistic Preference Relations, InlinPreRa, MCDM,
表 Y04
計畫編號
NSC 98-2410-H-151-006
計畫名稱
不 完 全 語 意 偏 好 關 係 預 測 導 入 企 業 資 源 規 劃 成 功 率 架 構
Applying Incomplete Linguistic Reference Relations to Forecast the Success
Possibility of Implementing ERP Systems
出國人員姓名
服務機關及職稱
王天津
國立高雄應用科技大學 國際企業系 教授
會議時間地點
民國
98 年 12 月 14 日至 98 年 12 月 16 日止 (3 天)
Kitakyushu City, Japan (日本北九州市早稻田大學)
會議名稱
The 10th Asia Pacific Industrial Engineering & Management Systems
Conference (APIEMS)
發表論文題目
發表
1 篇英文論文:
Evaluating the optimal ERP supply based on the Group Decision Making
Matrix
<共發表 1 篇論文,為 EI 引用>
一、 參加會議經過
1. 98 年 12月 14日 參加 在日 本 北九 州市 早稻 田大 學 舉辦 之 “
The 10th Asia Pacific
Industrial Engineering & Management Systems Conference (APIEMS)”研討會,此研討
會論文集為EI引用。
http://www.apiems.net/conf2009/
。
2. 發表1篇英文論文。
二、 與會心得
12月14日在日本北九州市早稻田大學舉辦之研討會,會中遇見交通大學管科所碩士
班之老師曾國雄教授,曾教授在學術上有極高的評價。
三、 考察參觀活動(無是項活動者省略)
四、 建議
建議多多鼓勵國內師生到國外發表文章為國爭光。
五、 攜回資料名稱及內容
論文集與研討會光碟。
本人發表
1 篇論文摘要如下:
Abstract—ERP is an enterprise-wide application software package that integrates all necessary
表 Y04