行政院國家科學委員會補助專題研究計畫成果報告
※※※※※※※※※※※※※※※※※※※※※※※※※
※ ※
※ 微陣列數據資料相關之統計方法 ※
※
※
※
※
※※※※※※※※※※※※※※※※※※※※※※※※※
計畫類別:þ個別型計畫 ¨整合型計畫
計畫編號:NSC 90-2321-B002-001
執行期間:
90 年 08 月 01 日至 91 年 07 月 31 日
計畫主持人:張啟仁博士
執行單位:國立台灣大學醫學院臨床醫學研究所
中
華
民
國
91 年
10
月
31
日
行政院國家科學委員會專題研究計畫成果報告
計畫編號:NSC 90-2321-B002-001 執行期限: 90 年 08 月 01 日至 91 年 07 月 31 日 主持人:張啟仁 執行機構及單位名稱 國立台灣大學醫學院臨床醫學研究所 計畫參與人員:劉孝斌 執行機構及單位名稱 國立台灣大學醫學院臨床醫學研究所 中文摘要 在目前台灣之各大教學醫院的研究 群中,基因體醫學因大型生物資訊資料庫 之進步,大型之資料能很容易地被取得、 納入、分享並迅速地分析,加上在研究型 之教學醫院如台大醫院,許多研究者除了 在本身因臨床經驗資料能快速取得、整理 之外,大都皆已投入與基因相關之研究。 尤其在基因微陣列實驗更投入相當大之人 力與預算。台大醫院已建立一個良好的「研 究服務」團隊,包括微陣列實驗室之分子 生物科學家及生物統計學家。透過此一研 究服務機制、生物醫學上的新發現即能很 快地散佈於所有研究者之中。因此,許多 費時、費錢的實驗,也得以免除重覆執行 的命運。 生物資訊與生物統計資料處理之研究 服務亦提供了因微陣列數列資料之產生而 運應而生之資料分析相關之工作,鑑於該 資料之數量龐大,因此資料的整理、除錯、 建檔及分析的需求亦相對地增加。由於微 陣列技術所產生之資料在實際應用上因為 其間之處理過程相當複雜,也自然而然在 其資料之產生過程中,引進了許多之誤 差,所以該筆資料在實際分析過程中,若 不有效地控制並探討其資料之可靠及正確 性,那麼之後統計所得之結果就沒有其代 表之意義,資料篩減(Data Filtering)之重要 性亦自然而然隨之增加。因此、我們提出 ACE (Alternating Conditional Expectation Transformation) 統計方法應用於資料篩 減並與其他現行之方法做比較。關鍵詞: 研究服務, 微陣列,生物統計,
生物資訊科學,ACE。
1. Abstr act
Genomic medicine research studies in Taiwan have just begun. Thanks to the Modern laboratory tools, computer technology advances and ubiquity of the internet offer unprecedented opportunity for scientists to gain access to, share, and analyze critical data and information stored in databases over the cyberspace. Scientific discovery can be expedited and many wastefully and costly experiments can be avoided if the vast information could be stored, shared, analyzed and opened to the research scientists in any clinical research institute. One of the successful collaboration examples among physicians, laboratory scientists, and biostatisticians has been established within National Taiwan University Hospital Research Group. They have successfully implemented their own research topics in collaboration with scientist in Microarray laboratory and Bioinformatics and Biostatistics laboratory.
Recent development of Microarray technology has enabled research scientists approaching their own area into a new era. With the collaboration from scientists in generating Microarray data, investigators can look into the research problems from a vast point of view, i.e. from a large data generated by array machine. However, due to the fast growing technique and astonishing data output, data analysis of this new Bioinformatic became an important issue in biomedical research.
Understanding what and how the Bioinformatics can provide has given clinical physicians in medical center a starting point to reconsider an infrastructure of Bioinformatics facility as a research service resource. A Microarray facility center has been established under the direction of Dr. Jeremy Chen in which research services and
education in using Microarray machine and technique were rapidly provided within NTUH. In the meantime, statistical data analysis support for Microarray data in Bioinformatic area has also been provided in NTUH research campus. A NSC supported grant “Bioinformatics Research Services Facility Using Microarray Data (NSC89-2316-B-002-035)” has provided us a good starting point to setup the connection among Microarray data analysts, Microarray data generators, and research investigators. In adjunction to the previous year support from NSC, another NSC research project “Statistical Mining Methods for Information Generated from Microarray (NSC90-2321-B002-001)” in dealing with the statistical methods is awarded and emphasize in discovering the data filtering method.
Huge data sets can easily be generated from the fast speed machine, and thus the demands of data collection, clearing, selection, and data management in the database is therefore strongly needed. However, the ability to tackle such problems can only be made and solved by limited attached programs from the array management software such as Genecluster from MIT or Spotfire. However, even with a good starting point of the statistical support to the data generated from Microarray research. There still exist some potential problems in handling the data from the early data management stage to the later statistical modeling and analysis stage. Some interested issues in dealing with the data from Microarray are 1) data filtering; 2) cluster analysis; and 3) discriminant classification analysis. Our goals are to study, develop practical and advanced statistical data mining methods for Microarray data, especially when the data generated involved lots of uncertainty and thus the data filtering become the major issue in this research proposal. Formal statistical consideration of the validity of huge data set has been considered from many automatically software performed by individual PIs and their assistants. We have thus experienced the data generated from the Microarray machines have it own
uncertainty. How to handle this error and how to perform the data correction become a good issue and have been discussed by many experts such as Lee, et al., and DeRisi et al. In a study to identify the possible clusters of genes, one need to eliminate the false expressed genes, it can be solved using both cell populations such as normal and abnormal genes in the experiment. This can be solved using two-stage procedure, first to use the normal vs. normal genes in expression to detect which genes are sensitive to the noise or bias of the experiment and thus to identify the “false expressed” genes. Secondly, after eliminating these “false expressed” genes, one can plot the normal vs. tumor genes to identify the influential genes. We propose using ACE (Alternating Conditional Expectation Transformation) to tackle the abnormality of the data generated from Microarray. Some discussion of this method is presented in this report. This report is under the guidance for report writing supported by the Grant of National Science Council.
Keywor ds: Research Services, Microarray,
Biostatistics, Bioinformatics, ACE.
2. Objective and Goal
An essential step in the analysis of microarray expression data is to determine which genes are expressed differently between two cell populations. In general, a differentially expressed gene means that its ratio of expression level in one population to that in another population exceeds a certain threshold. It is trivial to use the fold approach to truncate the raw data by comparing the expression ratio to a pre-specific fold. However, inspection of gene expression data suggests that this fold approach is not satisfactory i.e., various constants chosen can have quite different significance depending on the expression level. On the other hand, regardless of what criteria is chosen for the threshold, it is likely that some genes that are “differentially-expressed” by chance or due to unsteadiness from experimental conditions
such as hybridization, labeling efficiency, etc. Misleading results arise if these falsely expressed genes are not properly filtered beforehand. This brings up two fundamental problems, whether to delete the wrongly expressed genes at large or simply pickup the truly expressed genes. This can be solved using two-stage procedure, first to use the normal vs. normal genes in expression to detect which genes are sensitive to the noise or bias of the experiment and thus to identify the “false expressed” genes. Secondly, after eliminating these “false expressed” genes, one can plot the normal vs. tumor genes to identify the influential genes.
We utilized the ACE transformation (Alternating Conditional Expectations) proposed by Breiman in 1985, which was able to obtain the most random residual plot and normal-like residual distribution. The goal is to identify whether this transformation data filtering method can be used in eliminating the possible experimental bias.
3. Method
We utilized the dye swapping technique to form the replicated data in the following form:
Rik + Gjk = xk, i < j,
Rjk + Gik = yk, i < j, i, j =1 to 4.
Where R and G represent the red, green intensities at kth gene of the ith (jth) replicate. Four replicates of the data were considered here and thus there are 6 pairwise linear regression lines fitted. Linear regression line of the xk’s over yk’s (or vise versa) without y
intercept was fitted and slopes were estimated. The residuals were derived. The well-known Cook’s distance was used as the indication of influential point. They can be represented as: yk= β1 xkj + ek1or xk= β2 yk + ek2 kk k k h e r − = 1 σ) )
Random allocation of the residuals were the major issue discussed in this report,
due to the uncertainty of the residual derived from the linear regression line, one can’t exactly eliminated the outlier or the influential points. Thus, different transformations of the gene expression readings were used before fitting the regression line and before the detection of the falsely identified genes from the Microarray experiments. There were the transformations of logarithm, cubic root or square root of the y’s, in addition to these, ACE transformation were also considered.
ACE transform x and y toϕ(x) and φ(y)
by using an optimal nonparametric smoother, where the optimality is in the sense of maximizing the coefficient of correlation between ϕ(x)’s and φ(y)’s. This transformation of x and y is unambiguously defined and estimated without use of ad hoc heuristic or restrictive distributional assumptions. Note that ϕ(x) and φ(y) still preserve the order of the original x and y.
Simulation data were generated in order to test the true rate of the genes using different transformations. “Counting method” was applied to assemble all the frequencies in the simulation. Different underlying distribution of the error term and the distribution of the estimated slope in the simulated linear equation were assumed, these include the normal, log normal and uniform distribution for error and chi-square, double exponential for the estimated slopes. We also consider different proportions of the normal and abnormal genes in the overall simulated data.
4. Results
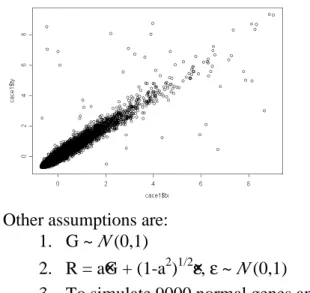
Examples of the scatter plots of red vs. green signals were presented in Figure 1 through 3. They were plotted as the original, standardized and ACE transformed.
It is noted that the scatter plots of these three figures are all in the different scales. The values of the residual of each of the genes in the regression line will be reflected in the calculation of the Cook’s distance.
A typical example test run of the simualion is presented as followings:
corr(R,G) = f(a) = a = E(corr(R,G)) and “normal” genes is distributed as:
a ~ Unif (0.95,1.00)
while the distribution of abnormal genes is: a ~ Unif (-1,+1).
Figure 1: scattered plot of the red intensity vs. green intensity in the original scales
Figure 2: scattered plot of the red intensity vs. green intensity in the standardized scales
Figure 3: scattered plot of the red intensity vs. green intensity in the ACE transformed
scales
Other assumptions are: 1. G ~ N (0,1)
2. R = a×G + (1-a2)1/2×ε, ε ~ N (0,1)
3. To simulate 9000 normal genes and 1000 abnormal genes.
4. Use ACE to correct data.
5. Fit linear regression to filter outlier genes.
Figures 4 and 5 present the Q-Q plots of the residuals with and without the ACE transformation.
Figure 4: normal plot of the residual without the ACE transformation
Figure 5: normal plot of the residual with the ACE transformation
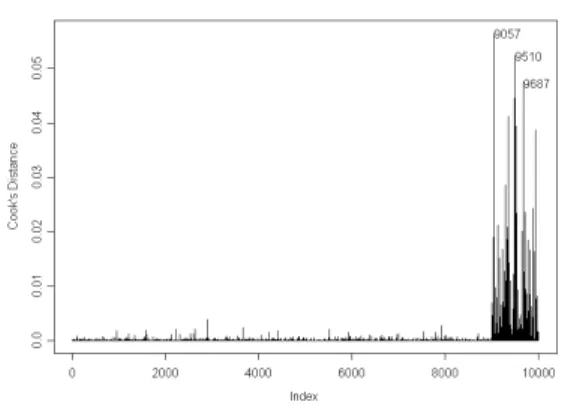
Figure 6: Histogram of Cook distance without ACE transformation
It can be seen that the probability plot or the normal plot of the residual is more likely to be normal distributed using the ACE transformation. Although it is difficult to see the difference of the histogram plots of the Cook distance between the data with and without ACE transformation. One can derive
the difference using the counting method. It can be concluded that using the ACE transformation is likely to have more accurate proportion in detecting the normal (or abnormal) genes. More detailed of the method in calculating accuracy of the proportion of truly identified normal genes when duplicated samples were considered are still in the progress.
Figure 7: Histogram of Cook distance with ACE transformation
5. Discussion
How to evaluate accuracy of the data derived from a Microarray experiment is important. This will subject to the quality of the experiments and materials used in within. Whether the data collected from this experiment will correctly be used needs lots of attention in the quality itself. We tried and simulated the scenarios of the distribution of the normal and abnormal genes derived from Microarray experiments. Different assumptions of the distribution in the error terms were assumed. Approaches under different transformations of the original data were examined in order to fulfill the reality of the experiment and assumptions of the model. It appears to us that no matter how good the filtering and transformation methods are, we can’t derive good results from data without a quality experiment.
6. Assessment
This grant proposal has given us a good start in using the simulated data to test whether the appropriate transformation of the data from Microarray experiments. Future
steps will be prepared in collaborating with research scientists in cancer research using Microarray experiment especially when the genes to disease is somewhat known in advance. We will use real example to test the appropriateness of the ACE transformation as well as other novel transformations.
This study is collaborated with Prof. Cathy SJ Fann at Institute of Biomedical Science, Academia Sinica and Prof. Ie-Bin Lien at Department of Mathematics, National Chung Hwa University.
.
7. Refer ences
[1] Lee, M.L., Kuo, F.C., Whitemore G.A., and Sklar, J., Importance of replication in microarray gene expression studies: statistical and evidence from repetitive cDNA hybridizations. Proceedings of the National Academy of Sciences of the United States of America. 97,9834-9. [2] DeRisi JL, Iyer VR and Brown PO:
Exploring the metabolic and genetic control of gene expression on a genomic scale. Science 278:680-686,1997.
[3] DeRisi J, van den Hazel B, Marc P, Balzi E, Brown P, Jacq C, Goffeau A. Genome microarray analysis of transcriptional activation in multidrug resistance yeast mutants. FEBS Lett. 470:156-60. 2000. [4] Breiman L, Friedman JH. 1985.
Estimating optimal transformations for multiple regression and correlation. J. Am. Stat. Assoc. 80:580-598.