行政院國家科學委員會專題研究計畫 期中進度報告
吸附於矽(111)之銦的表面結構及其隨溫度的相變化(1/2)
計畫類別: 個別型計畫
計畫編號: NSC91-2112-M-110-011-
執行期間: 91 年 08 月 01 日至 92 年 07 月 31 日
執行單位: 國立中山大學物理學系(所)
計畫主持人: 蔡秀芬
報告類型: 精簡報告
處理方式: 本計畫可公開查詢
中 華 民 國 92 年 5 月 23 日
1. 在本計劃年度內已將第一部份研究計畫的表面結構成果投至
Phys. Rev. B:
Shiow-Fon Tsay, M-H Tsai, 2003,” Structural
properties of the (4*1)- and (8*2)-In/Si(111) surface”,
(submitted April. 3, 2003),如附件。目前正進行這兩種結構
的能帶結構計算,以進一步探討兩表面結構的特性與物理性質不
同點發生原因。
2. 惟目前所應用的程式沒有經平行化處理,在計算量與計算資源
兩方面均面臨考驗。目前一方面採購 pc cluster,一方面學習
應用已經平行化的計算軟體 VASP,如此除可比較不同計算軟體
間的差異性外,亦可以與國內外計算物理的工作者有更多的交
流。
3. 由於 8 nodes pc cluster 約需 1,000,000 元,故擬變更預核經
費成為部份研究設備費採購電腦與周邊設備。
Structural properties of the (41)- and (82)-In/Si (111)
surfaces
Shiow-Fon
Tsay
* and
M.-H. Tsai
Department of Physics, National Sun Yat-sen University, Kaohsiung, Taiwan 804,
Republic of China
PACS number: 68.35.Bs, 68.35.Rh
Abstract
The structures of the (41) and (82) phases of In on the Si(111) surface have
been studied by the first-principles molecular-dynamics method. We find that the
displacements of the adatoms in the zigzag Si chains are mainly along the
1
10
direction and that in the (82) phase the In adatoms on the edges of adjacent In zigzag
chains form pairs. Our calculated structure for the (82) phase show a strong lateral
coupling between adjacent In chains, which suggest that the quasi-one-dimensional
behavior of the zigzag In chain of the (41) phase become quasi-two-dimensional in
the (82) phase. The calculated structural properties of both phases agree reasonably
well with x-ray diffraction measurements of Kumpf et al..
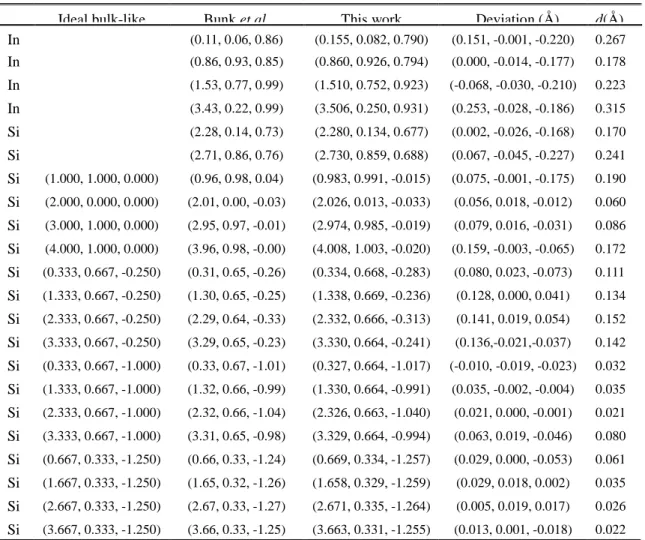
Table I. Calculated atomic positions of the (4×1)In-Si(111) system. The ideal
(bulk-like) and experimentally determined
2atomic positions are shown
in columns 2 and 3, respectively, for comparison. The differences
between experimental and calculated atomic positions are shown in
columns 5 and 6.
Ideal bulk-like Bunk et al. This work Deviation (Å) d(Å)
In (0.11, 0.06, 0.86) (0.155, 0.082, 0.790) (0.151, -0.001, -0.220) 0.267 In (0.86, 0.93, 0.85) (0.860, 0.926, 0.794) (0.000, -0.014, -0.177) 0.178 In (1.53, 0.77, 0.99) (1.510, 0.752, 0.923) (-0.068, -0.030, -0.210) 0.223 In (3.43, 0.22, 0.99) (3.506, 0.250, 0.931) (0.253, -0.028, -0.186) 0.315 Si (2.28, 0.14, 0.73) (2.280, 0.134, 0.677) (0.002, -0.026, -0.168) 0.170 Si (2.71, 0.86, 0.76) (2.730, 0.859, 0.688) (0.067, -0.045, -0.227) 0.241 Si (1.000, 1.000, 0.000) (0.96, 0.98, 0.04) (0.983, 0.991, -0.015) (0.075, -0.001, -0.175) 0.190 Si (2.000, 0.000, 0.000) (2.01, 0.00, -0.03) (2.026, 0.013, -0.033) (0.056, 0.018, -0.012) 0.060 Si (3.000, 1.000, 0.000) (2.95, 0.97, -0.01) (2.974, 0.985, -0.019) (0.079, 0.016, -0.031) 0.086 Si (4.000, 1.000, 0.000) (3.96, 0.98, -0.00) (4.008, 1.003, -0.020) (0.159, -0.003, -0.065) 0.172 Si (0.333, 0.667, -0.250) (0.31, 0.65, -0.26) (0.334, 0.668, -0.283) (0.080, 0.023, -0.073) 0.111 Si (1.333, 0.667, -0.250) (1.30, 0.65, -0.25) (1.338, 0.669, -0.236) (0.128, 0.000, 0.041) 0.134 Si (2.333, 0.667, -0.250) (2.29, 0.64, -0.33) (2.332, 0.666, -0.313) (0.141, 0.019, 0.054) 0.152 Si (3.333, 0.667, -0.250) (3.29, 0.65, -0.23) (3.330, 0.664, -0.241) (0.136,-0.021,-0.037) 0.142 Si (0.333, 0.667, -1.000) (0.33, 0.67, -1.01) (0.327, 0.664, -1.017) (-0.010, -0.019, -0.023) 0.032 Si (1.333, 0.667, -1.000) (1.32, 0.66, -0.99) (1.330, 0.664, -0.991) (0.035, -0.002, -0.004) 0.035 Si (2.333, 0.667, -1.000) (2.32, 0.66, -1.04) (2.326, 0.663, -1.040) (0.021, 0.000, -0.001) 0.021 Si (3.333, 0.667, -1.000) (3.31, 0.65, -0.98) (3.329, 0.664, -0.994) (0.063, 0.019, -0.046) 0.080 Si (0.667, 0.333, -1.250) (0.66, 0.33, -1.24) (0.669, 0.334, -1.257) (0.029, 0.000, -0.053) 0.061 Si (1.667, 0.333, -1.250) (1.65, 0.32, -1.26) (1.658, 0.329, -1.259) (0.029, 0.018, 0.002) 0.035 Si (2.667, 0.333, -1.250) (2.67, 0.33, -1.27) (2.671, 0.335, -1.264) (0.005, 0.019, 0.017) 0.026 Si (3.667, 0.333, -1.250) (3.66, 0.33, -1.25) (3.663, 0.331, -1.255) (0.013, 0.001, -0.018) 0.022
Table II. The calculated distances (in unit Å) between In and Si adatoms and
substrate atoms in the (4×1) and (8×2) phases. The labels of the atoms
are shown in figures 1 and 2.
(4×1) In-Si(111) (8×2) In-Si(111) In(1)-Si(1) 2.701 2.693 In(2)-Si(2) 2.700 2.639 In(7)-Si(3) 2.681 2.634 In(8)-Si(4) 2.679 2.731 In(1)-In(3) 2.908 2.902 In(2)-In(4) 2.906 2.840 In(1)-In(4) 2.906 2.850 In(2)-In(3) 2.905 2.810 In(5)-In(7) 2.921 2.855 In(6)-In(8) 2.916 2.906 In(5)-In(8) 2.910 2.865 In(6)-In(7) 2.913 2.801 In(3)-In(5) 3.046 2.794 In(4)-In(6) 3.048 2.783 In(3)-In(6) 3.009 3.991 In(4)-In(5) 3.011 4.366 In(1)-In(2) 3.846 3.832 3.256 4.428 In(3)-In(4) 3.845 3.833 4.112 3.646 In(5)-In(6) 3.830 3.849 3.662 4.102 In(7)-In(8) 3.832 3.846 3.207 4.474 Si(1)-Sibulk 2.360 2.338 Si(1)-Si(3’) 2.434 2.430 Si(1)-Si(4’) 2.435 2.402 Si(2)-Si(4’) 2.436 2.414 Si(2)-Si(3’) 2.434 2.441 In(3)-Sibulk 2.584 2.621
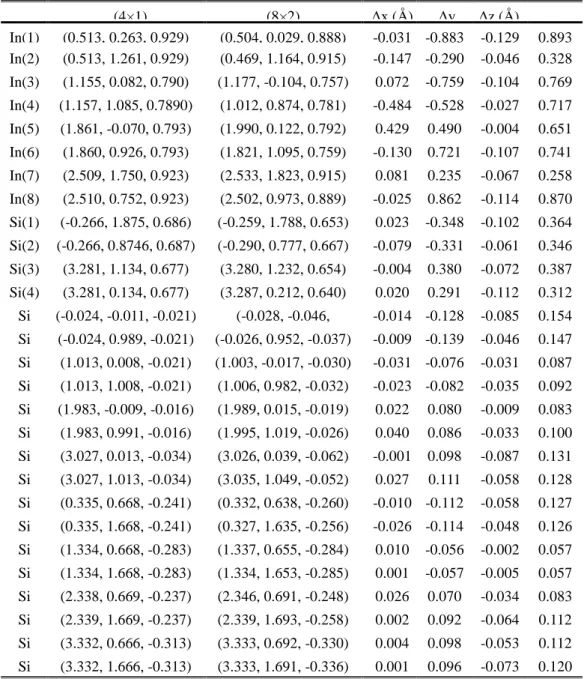
Table III. Comparison between calculated atomic positions of the (4×1) and (8×2)
structures. The displacements of In and Si atoms in the (8×2)
structure relative to those in the (4×1) structure are shown in columns
4-7. The coordinates and labeling of atoms are shown in Figs. 1 and 2.
(4×1) (8×2) Δx (Å) Δy Δz (Å) In(1) (0.513, 0.263, 0.929) (0.504, 0.029, 0.888) -0.031 -0.883 -0.129 0.893 In(2) (0.513, 1.261, 0.929) (0.469, 1.164, 0.915) -0.147 -0.290 -0.046 0.328 In(3) (1.155, 0.082, 0.790) (1.177, -0.104, 0.757) 0.072 -0.759 -0.104 0.769 In(4) (1.157, 1.085, 0.7890) (1.012, 0.874, 0.781) -0.484 -0.528 -0.027 0.717 In(5) (1.861, -0.070, 0.793) (1.990, 0.122, 0.792) 0.429 0.490 -0.004 0.651 In(6) (1.860, 0.926, 0.793) (1.821, 1.095, 0.759) -0.130 0.721 -0.107 0.741 In(7) (2.509, 1.750, 0.923) (2.533, 1.823, 0.915) 0.081 0.235 -0.067 0.258 In(8) (2.510, 0.752, 0.923) (2.502, 0.973, 0.889) -0.025 0.862 -0.114 0.870 Si(1) (-0.266, 1.875, 0.686) (-0.259, 1.788, 0.653) 0.023 -0.348 -0.102 0.364 Si(2) (-0.266, 0.8746, 0.687) (-0.290, 0.777, 0.667) -0.079 -0.331 -0.061 0.346 Si(3) (3.281, 1.134, 0.677) (3.280, 1.232, 0.654) -0.004 0.380 -0.072 0.387 Si(4) (3.281, 0.134, 0.677) (3.287, 0.212, 0.640) 0.020 0.291 -0.112 0.312 Si (-0.024, -0.011, -0.021) (-0.028, -0.046, -0.014 -0.128 -0.085 0.154 Si (-0.024, 0.989, -0.021) (-0.026, 0.952, -0.037) -0.009 -0.139 -0.046 0.147 Si (1.013, 0.008, -0.021) (1.003, -0.017, -0.030) -0.031 -0.076 -0.031 0.087 Si (1.013, 1.008, -0.021) (1.006, 0.982, -0.032) -0.023 -0.082 -0.035 0.092 Si (1.983, -0.009, -0.016) (1.989, 0.015, -0.019) 0.022 0.080 -0.009 0.083 Si (1.983, 0.991, -0.016) (1.995, 1.019, -0.026) 0.040 0.086 -0.033 0.100 Si (3.027, 0.013, -0.034) (3.026, 0.039, -0.062) -0.001 0.098 -0.087 0.131 Si (3.027, 1.013, -0.034) (3.035, 1.049, -0.052) 0.027 0.111 -0.058 0.128 Si (0.335, 0.668, -0.241) (0.332, 0.638, -0.260) -0.010 -0.112 -0.058 0.127 Si (0.335, 1.668, -0.241) (0.327, 1.635, -0.256) -0.026 -0.114 -0.048 0.126 Si (1.334, 0.668, -0.283) (1.337, 0.655, -0.284) 0.010 -0.056 -0.002 0.057 Si (1.334, 1.668, -0.283) (1.334, 1.653, -0.285) 0.001 -0.057 -0.005 0.057 Si (2.338, 0.669, -0.237) (2.346, 0.691, -0.248) 0.026 0.070 -0.034 0.083 Si (2.339, 1.669, -0.237) (2.339, 1.693, -0.258) 0.002 0.092 -0.064 0.112 Si (3.332, 0.666, -0.313) (3.333, 0.692, -0.330) 0.004 0.098 -0.053 0.112 Si (3.332, 1.666, -0.313) (3.333, 1.691, -0.336) 0.001 0.096 -0.073 0.120