Revision #4
1 2
A New Diagnostic Approach using Regional
3
Analysis of Anterior Knee Laxity in Patients with
4
Anterior Cruciate Ligament Deficiency
5 6
Hsiu-Chen Lin, PT, PhD1,2,a 7
Chia-Ming Chang, PT, BS2,a 8
Horng-Chaung Hsu, MD3 9
Weng-Hang Lai, PT, MS2 10
Tung-Wu Lu, D.Phil.1,* 11
12 1
Institute of Biomedical Engineering, National Taiwan University, Taipei 100, Taiwan,
13
R.O.C.
14 2
Department of Physical Therapy, China Medical University, Taichung 404, Taiwan,
15
R.O.C.
16 3
Department of Orthopedics, China Medical University Hospital, Taichung 404,
17 Taiwan, R.O.C. 18 19 20 21 22 Corresponding author: 23
Dr. Tung-Wu Lu, D.Phil. 24
Institute of Biomedical Engineering, National Taiwan University,
25
No. 1, Sec. 1, Jen-Ai Road, Taipei 100, Taiwan, R.O.C.
26 Tel: +886-2-33653335 27 Fax: +886-2-33653335 28 E-mail: [email protected] 29 30 31 32 33
Abstract
1
Purpose
2
The first purpose of this study was to analyze the characteristics of the anterior knee laxity in the three
3
regions of different stiffness in the force-displacement curve, which was obtained from a frequently
4
used arthrometer for quantifying knee joint stability in the patients with anterior cruciate ligament
5
(ACL) rupture and the healthy controls. The second purpose was to compare the characteristics from
6
the regional analysis of the anterior knee laxity between two subject groups in order to explore proper
7
diagnosis criteria.
8
Methods
9
Seventy-one patients with unilateral ACL tear and eighty healthy controls were enrolled and their
10
anterior knee laxities were tested using the KT-2000 arthrometer. The displacements and stiffness of
11
the three regions were extracted separately and compared between groups to further develop the
12
diagnostic criteria.
13
Results
14
The results indicated that the laxity behavior was mostly affected in Region 2 and Region 3 after ACL
15
tear. Two good indicators for ACL tear were found in the receiver operating characteristic (ROC)
16
curve analysis: Region 2 with the displacement larger than 3.7 mm and Region 3 with the stiffness
17
smaller than 22 N/mm. These two criteria provided better diagnostic accuracy with increased
18
sensitivity.
19
Conclusions
20
The regional analysis method developed in this study could provide more information for
21
understanding the characteristics of the anterior knee laxity and help increase the diagnostic accuracy
22
for ACL rupture.
23 24
Key words: Knee, Diagnostic criteria, Anterior cruciate ligament injury, KT-2000
25
arthrometer
26 27
The level of evidence: Level II 28
Diagnostic studies–Development of diagnostic criteria in a consecutive series of patients and 29
a universally applied “gold” standard 30
Introduction
1Anterior cruciate ligament (ACL) is the most frequently injured structure in 2
acute traumatic hemarthrosis of the knee [31]. The incidences of ACL tears range 3
from 0.21 to 2.78 per 1000 exposures to various sports participations, such as soccer, 4
basketball, skiing and wrestling [34]. Accurate diagnosis of ACL tear, which is vital 5
to the following patient care, relies on injury history, clinical examinations [5,23], MR 6
imaging and arthroscopy [8]. In clinical diagnosis, three examinations are 7
commonly used: the Lachman, the anterior drawer, and the pivot shift tests [23,33]. 8
These tests reportedly had a high level of specificity (range: 92-98%) but a relatively 9
low level of sensitivity in the pivot shift test (24%) and the anterior drawer test (55%) 10
without anesthesia [5]. The Lachman test is considered reliable [44] and having the 11
greatest validity and highest diagnostic accuracy (sensitivity: 85%) [5,33]. Henning 12
et al. [16] have demonstrated the positive correlation between the ACL strain and 13
the applied forces during the Lachmen test, and established the relative ACL strain in 14
the Lachmen test for various functional activities and rehabilitation exercises. 15
However, the testing acuity could be affected by several examiner-related variables 16
such as the hand position in force application [17], method of charting, level of 17
experience, and degree of specialization [33]. Therefore, instrumented 18
measurements of knee laxity are frequently used as assisting diagnosis tools [4,9,10]. 19
KT-1000 or KT-2000 arthrometer (MEDmetric Co., San Diego, USA) is a 20
popular instrument for knee laxity measurements [20,21,32,37,41] and has been 21
proven to have good clinical validity and reliability [14,19,29,30,35,38]. The 22
clinical diagnostic criteria for ACL injuries were established by selecting proper 23
parameters in the measured anterior forces and corresponding tibia displacements 24
with the same testing position as the Lachman test [36]. Because of the larger 1
variation in the absolute values of anterior displacements at specific applied forces 2
from one knee, most clinicians consider the side-to-side differences between the 3
injured and the contralateral uninjured knees would provide better discrimination in 4
identifying ACL injuries [2,4,10,30]. The diagnostic criteria for the side-to-side 5
differences of displacement at 89 N (20 lb) and 134 N (30 lb) forces have been 6
reported to have an anterior displacement difference (ADD) larger than 3 millimeter 7
(ADD20 ≥ 3 mm and ADD30 ≥ 3 mm) [9,42]. Another parameter is the compliance 8
index (CI), the difference of the displacements between 89 N and 67 N forces from 9
one knee [9,10], and its diagnostic criterion is suggested to be larger than 3 10
millimeters (CI ≥ 3 mm) [10]. The CI side-to-side difference (CID) larger than 1.5 11
mm (CID ≥ 1.5 mm) was considered a better indicator than CI because of the higher 12
sensitivity level [10,13]. However, the parameters using side-to-side differences 13
require an uninjured contralateral knee, and therefore may be unsuitable for those 14
suffering from bilateral knee pathologies. 15
When the examination is limited to only one knee, the stiffness can be used to 16
help discriminate the ACL injury [24,26,27]. The stiffness, defined by the slope of 17
the applied force to the displacement of the tibia [26], reportedly varied with different 18
knee flexion angles and the smallest value is found at flexion 20-30° [11,26]. 19
Changes of stiffness in different regions of the force-displacement curve represented 20
changes in restraining properties of the knee joint under various loading conditions 21
[24,26,27]. Two in vitro studies analyzed the stiffness in the initial and terminal 22
loading regions and found significantly smaller values in the ACL-deficient knees 23
when compared with the normal ones [11,26]. However, according to the diagrams 24
in the literature and our tested data, the anterior force-displacement curve in the 25
KT-2000 arthrometer test showed a pattern with three different stiffness [22,24,27]. 26
Moreover, to our best knowledge, no specific diagnostic criterion for the stiffness 1
parameter has been proposed. Therefore, the purposes of this study were (1) to 2
analyze the stiffness characteristics of anterior knee laxity in three regions of the 3
anterior force-displacement curve in the KT-2000 arthrometer test, and (2) to compare 4
the characteristics between healthy controls and patients with ACL rupture in order to 5
explore proper diagnosis criteria for the stiffness parameter. The hypotheses of this 6
study are (1) the mechanical properties of three regions in force-displacement diagram 7
are different between normal and ACL-deficient knees, and (2) the testing results from 8
one knee could be used to establish proper diagnostic criteria for stiffness parameter 9
to accurately distinguish the ACL injury. 10
11
Materials and Methods
12Seventy-one patients with ACL rupture from China Medical University 13
Hospital were enrolled. They were diagnosed by an experienced orthopedic surgeon 14
as unilateral ACL complete tear with physical examinations and confirmed either by 15
arthroscopy or MRI examination. Eighty healthy adults from the university campus 16
were recruited voluntarily for comparison. They were aged 18 to 45 years and had 17
no pathology in their lower extremities. All participants signed the consent form and 18
then received routine medical history taking and physical examination to ensure the 19
intact structures around the knees. Firstly, 40 ACL patients and 40 healthy adults 20
were selected randomly to establish the diagnostic criteria. Secondly, 21
cross-validation was performed by the data from the remaining 31 patients, and 40 22
healthy adults to examine the accuracy of the diagnostic criteria. These 31 patients 23
were further divided into acute and chronic subgroups by the post-injury duration of 24
three months. There were 6 patients in the acute subgroup and 25 in the chronic 1
subgroup. 2
KT-2000 arthrometer was used to investigate the responses of the knee laxity 3
to various loading conditions. The applied force and corresponding displacement 4
data were recorded into a laptop via a data acquisition A/D card (DaqCard 216B, 5
IOtech, USA) with the measurement resolutions of 0.14 N and 0.012 mm at 1000 Hz. 6
Then, the displacement parameters, including ADD20, ADD30, CI, and CID, and also 7
the displacement and stiffness in each of the three regions would be extracted from 8
the force-displacement curve. To avoid inter-rater variability, one experienced tester 9
with KT-2000 performed all the tests. The tester demonstrated high level of 10
intra-rater reliability (ICC(3,1) >0.76) and clinical validity (ICC(3,3) >0.86), by 11
comparing among repeated trials and comparing the computed maximum 12
displacement with the reading from the dial. 13
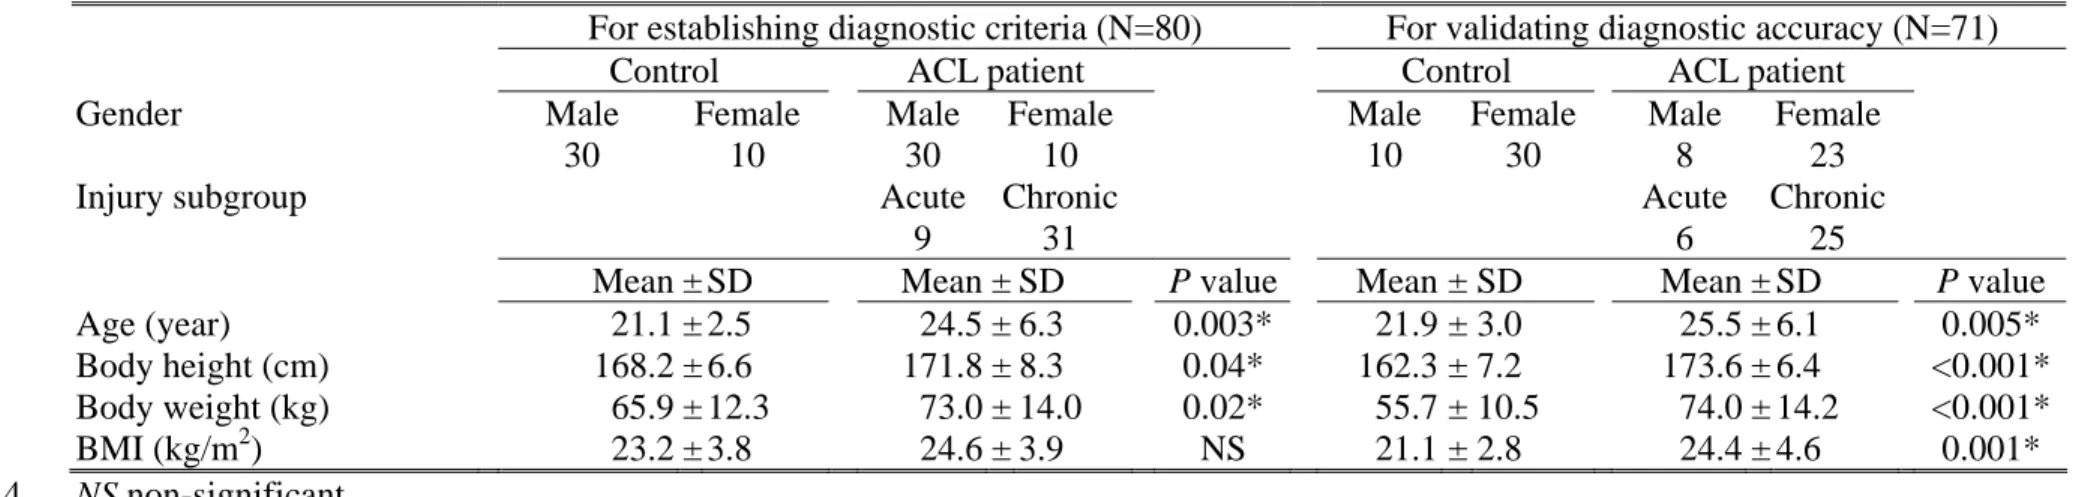
The basic data of each participant, such as age, height, weight and dominant 14
leg, was collected firstly (Table 1). Although there were significant differences in 15
the comparisons of the age, body height and weight between groups, no difference in 16
the body mass index (BMI) suggested similar body figures. The KT-2000 17
arthrometer was fastened on the lower leg and perpendicular loads were applied to the 18
tibia. The test was performed at 30° of knee flexion with the right knee tested first in 19
the control group, and the uninjured knee first in the patient group. A pre-test trial 20
was necessary to ensure the relaxation of the surrounding muscles and to obtain the 21
starting reference position. A successful trial consisted of an anterior pull (up to 134 22
N), a posterior push (up to 134 N) and then a release. The trial should end with the 23
indicator of the dial returning to ± 0.5 mm of the starting reference position. Patient 24
relaxation must be maintained throughout the entire test because the muscle 25
contraction could cause significant measuring errors. The examiners would 26
periodically check the patient’s thighs to make sure there is no muscle contraction or 1
guarding. If the dial needle was noted to shift unsteadily or any muscle contraction 2
or guarding was detected during the trial, the trial would be considered a failure. 3
Moreover, any sudden distortion in the force-displacement curve display immediately 4
after each trial would also be considered a failure as well. Three successful trials 5
would be obtained to calculate the mean value of the variables for each knee. 6
The applied force and corresponding displacement data formed a 7
force-displacement curve that was then analyzed with a self-written MATLAB 8
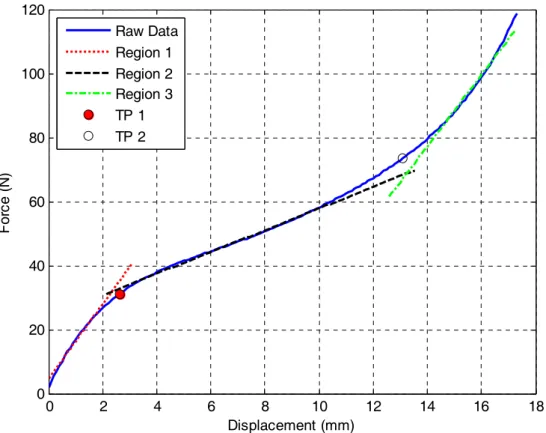
(MathWorks, USA) program. The curve was first approximated using a 5-order 9
polynomial function [24], and two turning points of the curve were selected manually 10
by a same operator. These two turning points separated the curve into three regions, 11
each of which was then fitted with a straight line using simple linear regression 12
(Figure 1). The slope of the line in each region represented its stiffness. 13
Statistical Analysis
14
Intraclass correlation coefficient (ICC) for the results from each region of the 15
three successful trials was calculated to investigate the inter-trial and inter-rater 16
reliability. For the inter-rater reliability, another operator was enrolled and 17
performed the same data management procedure on the 40 controls and 40 ACL 18
patients. Paired t-test was used to compare the forces, displacements and stiffness of 19
the three regions between dominant and non-dominant sides in the control group. 20
The independent t-test was used to compare all the variables between genders in the 21
control group, and between the control and patient groups. The comparing results 22
between groups were then used to select suitable variables to establish proper 23
diagnostic criteria. Receiver operating characteristic (ROC) curve was constructed 24
for each selected variable, and the area under the ROC curve (AUC) was calculated to 25
acquire the diagnostic accuracy. The point with maximal summation of sensitivity 26
and specificity on the ROC curve was considered the proper diagnostic criterion. 1
The specificity, sensitivity, positive and negative likelihood ratios (LR+, LR-) of all 2
the diagnostic criteria were further calculated using the testing data from the 3
additional 40 healthy participants and the two subgroups of the 31 ACL patients. 4
The differences of AUCs between regions were tested with MedCalc statistical 5
software (Mariakerke, Belgium), and all other statistical analyses were conducted 6
using SPSS software (SPSS Inc., Chicago, IL, USA) with significant level at 0.05. 7
8
Results
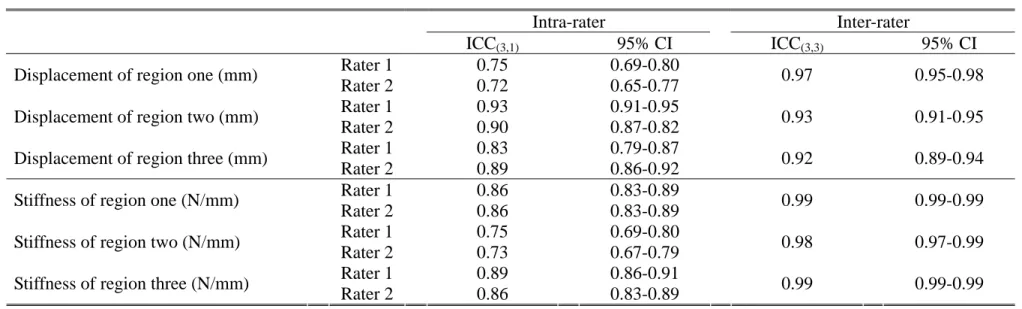
9A high level of inter-trial reliability for each region was demonstrated for both 10
operators (ICC(3,1)=0.72-0.96, P<0.001), and also the inter-rater reliability (ICC(3,3)= 11
0.92-0.99, P<0.001) (Table 2). The force-displacement curves in the control and 12
patient groups were constructed from the mean force and displacement data listed in 13
Table 3, and the two turning points were also shown in Figure 2. In the control 14
group, no significant differences between dominant and non-dominant sides were 15
found for the displacements, forces and stiffness of the three regions. Comparisons 16
between genders showed no significant differences except that females had a larger 17
displacement (female: 2.5 ± 0.8 mm, male: 1.8 ±0.9 mm, P= 0.02) and smaller 18
stiffness (female: 29.2 ± 11.1 N/mm, male: 40.3 ± 14.0 N/mm, P= 0.03) in Region 3. 19
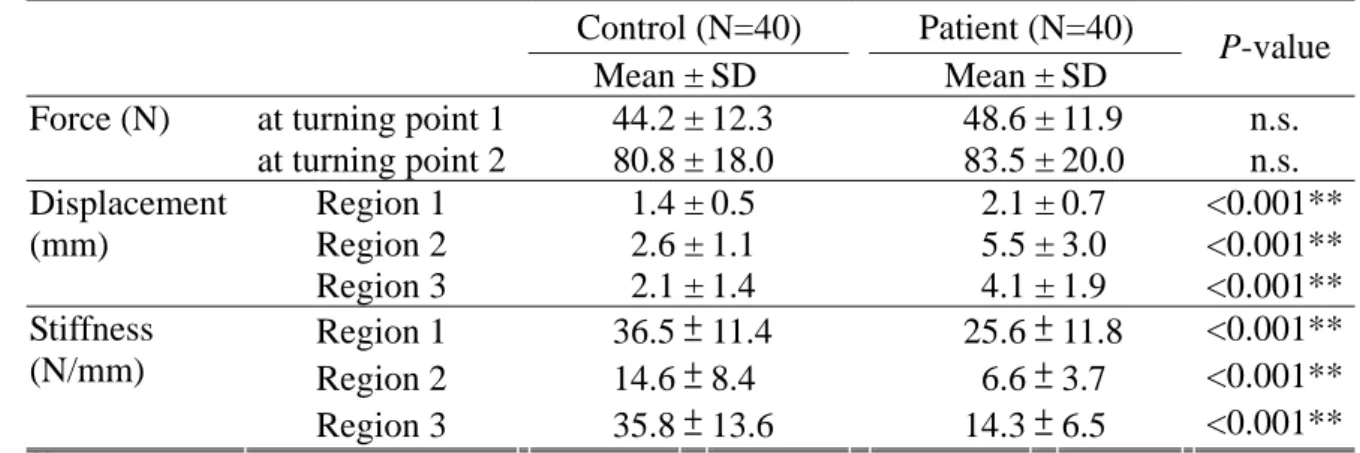
Comparisons between the control and patient groups showed significantly 20
differences in the displacement and stiffness parameters but not in the force 21
parameters (Table 3). The forces of the two turning points have similar mean values 22
around 46 N and 82 N in both groups. Interestingly, if converting the forces of the 23
first turning points into percentage of individual’s body weight (%BW), the forces of 24
46 N were found equivalent to an average value of 6%BW approximately. The 1
displacements of all three regions were significantly larger (P <0.001), and the 2
stiffness were significantly smaller in the patient group (P <0.001) than those in the 3
control group. Therefore, these two variables were treated as possible diagnostic 4
parameters and used to establish their clinical diagnostic criteria. 5
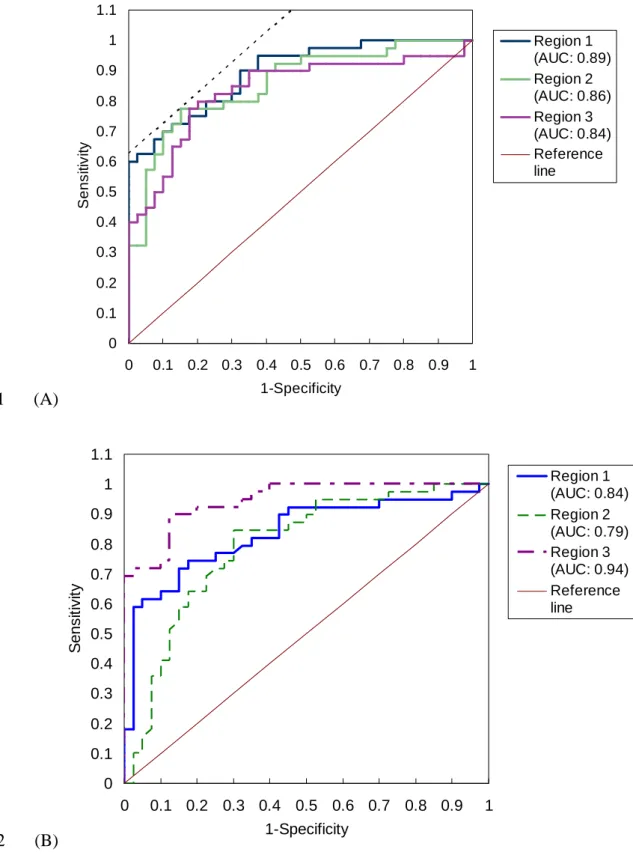
The ROC curves of the possible diagnostic parameters were shown in Figure 3. 6
The AUCs for the displacements were similar between the three regions (area: 7
0.837-0.894). The point closer to the upper-left corner was selected as the diagnostic 8
criterion, with 3.7 mm displacement of Region 2 (specificity: 85%, sensitivity: 75%) 9
(Figure 3A). For the stiffness of the three regions, Region 3 had the largest AUC 10
(area: 0.945), and the best diagnostic criterion would be at 22 N/mm (specificity: 88%, 11
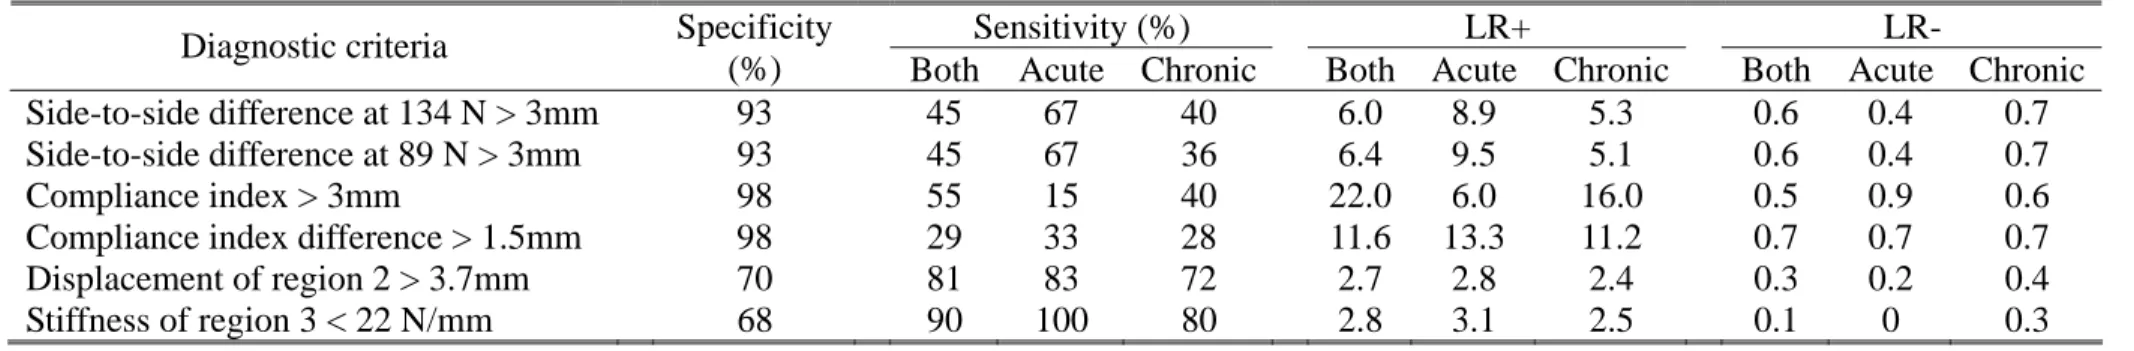
sensitivity: 90%) (Figure 3B). The estimated specificity, sensitivity, LR+, and LR- 12
of these two criteria and several other criteria suggested in the literature were shown 13 in Table 3. 14 15
Discussion
16The most important finding of the present study was to establish two 17
diagnostic criteria for ACL deficiency by using regional analysis of the anterior knee 18
laxity test, which was proved to have high levels of intra- and inter-rater reliability. 19
Our results indicated that the ACL group had significantly larger displacements and 20
smaller stiffness than the control group in both Region 2 and Region 3, suggesting the 21
important roles of the ACL in these two regions. Previous studies have also reported 22
a larger anterior tibial translation at 134 N in the ACL injured knee than in the normal 23
knee [4,10,25,30]. The ACL strain in daily activities seldom exceeded 4.5% (or 1.4 24
mm estimated elongation approximately) [6,7,12], and the ACL elongation would 1
have less than 50% relative to the Lachman test (or under the applied forces of 20 lb) 2
[15]. The average force at the end point of Region 2 was 82 N (18.4 lb) and the 3
corresponding displacements were 2.6 mm and 5.5 mm in the two groups of this study 4
(Table 3). So the characteristics of Region 2 would be closely correlated to the knee 5
stability in daily activities. For Region 3, the amount of the applied forces and 6
corresponding tibial translations would make the ACL strain or elongation exceed far 7
beyond those in daily activities and therefore should be considered in discussions 8
about strenuous or sport-related movements. Matsumoto et al. also reported that the 9
terminal stiffness, defined as the stiffness between 89 N and 134 N, of the 10
ACL-injured knee was significantly smaller than the normal knee [27]. Although the 11
force leading to ACL rupture might be higher than 134 N, the laxity characteristics 12
beyond 134 N reportedly had similar linear relationships with those just below 134 N 13
[30]. Therefore, the stiffness of Region 3 may play a more significant role than the 14
displacement in the reference of ACL injury. 15
Two diagnostic criteria were developed based on our results: Region 2 with a 16
displacement larger than 3.7 mm and Region 3 with stiffness smaller than 22 N/mm. 17
Specificity refers to the correct rate of negative results (indicating normals) in a true 18
normal group, while sensitivity is the correct rate of positive results (indicating 19
injuries) in a true injury group. The previous diagnosis criteria (i.e. ADD20, ADD30, 20
CI, and CID) work excellently only in indicating normals with high specificity [4,5,39] 21
and most of them required a contralateral intact knee. When compared with the 22
previous criteria, the criteria developed in this study needed testing data from only 23
one knee, and could have good performances in both indicating the ACL injury with 24
73-83% sensitivity and indicating normal with 70-80% specificity (Table 4). 25
Different levels of LRs suggested the clinical importance for the test results. They 26
were defined as large (LR+ > 10, LR- < 0.1), moderate (LR+: 5-10, LR-: 0.1-0.2), 1
small (LR+: 2-5, LR-: 0.2-0.5) and rarely important (LR+: 1-2, LR-: 0.5-1) levels [18]. 2
The previous diagnosis criteria generated moderate to large importance for LR+, but 3
rarely to small importance for LR-. Our diagnostic criteria generated small clinical 4
importance for both LRs, but better performances were noticed for LR- when 5
compared with the previous diagnostic criteria. These results suggested that our 6
diagnosis criteria could be useful for recognizing the ACL-injured knees from 7
possible ACL patients, especially for the stiffness in Region 3. 8
The comparison within the control group showed that females had 9
significantly larger displacements and smaller stiffness than males in Region 3. 10
Similar gender difference had already been discussed in several studies, but most of 11
them only revealed smaller knee anterior displacements in male subjects [1,16,43]. 12
Hinton et al. [16] reported that the differences between genders in the knee anterior 13
displacement emerged at the loadings of 89 N and 134 N, which agreed with our 14
results in Region 3. For Region 1, the applied forces worked to orient and tighten 15
the collagen fibers of surrounding structures and counteracted the weight of the lower 16
leg [24,28]. According to the anthropometric data, the weight of the lower leg is 17
nearly 6.1% of the body weight [45]. The mean loading of the first turning point 18
was around 6.6% of the body weight for both groups in this study. The result 19
supported the statement that Region 1 represented the counteraction of the gravity 20
forces (weights) from the lower leg and the instrument. 21
In this study, there were some limitations needing to be addressed regarding 22
the selection of the participants. The ACL group consisted of the consecutive 23
patients during a period of time and the control group was the convenient sample from 24
the university campus. This may lead to the first limitation of the heterogeneity in 25
the age, body height and weight between two subject groups. However, Anderson et 26
al. had studied the correlation between anthropometric data and ACL size, and found 1
that the ACL size was correlated to the lean body mass (i.e. BMI) only [3]. Previous 2
studies showed that the anterior knee translation would decrease with age for subjects 3
between 11 and 18 years old [1,16,40], but the subjects in our study have all passed 4
their adolescence. Therefore, the differences of the demographic data between 5
groups would not significantly influence the characteristics of the anterior knee laxity. 6
The second limitation is the small subject number in the acute subgroup, and it may 7
influence the diagnostic accuracy in the acute subgroup. The results of diagnostic 8
accuracy in this study demonstrated minor incongruousness with the results in Bach et 9
al. [4], in which they reported poorer accuracy of these diagnosis criteria for the 10
patients with acute ACL tear than for those with chronic tear, but the opposite result 11
was demonstrated in this study. This disagreement may be caused by the small 12
subject number of the acute subgroup in this study. Another explanation is the 13
possible discrepancy in the severity of symptom (e.g. joint swelling) and the 14
post-injury duration, because presence of the acute symptoms may influence the 15
general knee laxity and the adaptations on the mechanical property of the surrounding 16
tissues after ACL tear would gradually increase with the post-injury duration. For 17
clinical relevance, a simpler analysis method could be developed according to our 18
results, by setting the loadings of Region 2 from 46 N to 82 N and those of Region 3 19
from 82 N to 134 N. Then, this analysis method could be used to easily analyze the 20
force-displacement curve region-wise to acquire detailed and valuable information 21
about the mechanical characteristics of the knee joint. It also provides another 22
means to assist the diagnosis of the ACL injuries before the invasive arthroscopic or 23
extensive MRI examination. 24
Conclusion
1A new diagnostic approach with regional analysis of the anterior knee laxity 2
for ACL deficiency was presented in this study. The reliability of this analysis 3
method showed high levels of inter-trial and inter-rater reliability, which would 4
support the future application of this method. The results suggested the crucial 5
restraint role played by the ACL in Region 2 and Region 3. Two diagnostic criteria 6
were developed based on our results: Region 2 with a displacement larger than 3.7 7
mm and Region 3 with stiffness smaller than 22 N/mm. They were shown to have 8
good levels of both sensitivity and specificity. The simplified regional analysis 9
method could be developed according to the results of this study and provide a means 10
to acquire detailed information about the mechanical characteristics of the knee joint 11
and could be used as a diagnostic means for ACL rupture before the invasive 12
arthroscopic or expensive MRI examination. 13
14
Acknowledgments
15
The authors gratefully acknowledge the financial support of the China Medical University
16 (CMU95-080). 17 18 References 19
1. Ahmad CS, Clark AM, Heilmann N, Schoeb JS, Gardner TR, Levine WN (2006) Effect of gender
20
and maturity on quadriceps-to-hamstring strength ratio and anterior cruciate ligament laxity. Am J
21
Sports Med 34:370-374
22
2. Alford JW, Bernard R. Bach J (2005) Arthrometric aspects of anterior cruciate ligament surgery
23
before and after reconstruction with patellar tendon grafts. Tech Orthop 20:421-438
24
3. Anderson AF, Dome DC, Gautam S, Awh MH, Rennirt GW (2001) Correlation of anthropometric
25
measurements, strength, anterior cruciate ligament size, and intercondylar notch characteristics to
26
sex differences in anterior cruciate ligament tear rates. Am J Sports Med 29:58-66
27
4. Bach BR, Jr., Warren RF, Flynn WM, Kroll M, Wickiewiecz TL (1990) Arthrometric evaluation of
28
knees that have a torn anterior cruciate ligament. J Bone Joint Surg Am 72:1299-1306
5. Benjaminse A, Gokeler A, Schans Cpvd (2006) Clinical diagnosis of an anterior cruciate ligament
1
rupture: A meta-analysis. J Orthop Sports Phys Ther 36:267-288
2
6. Beynnon BD, Fleming BC (1998) Anterior cruciate ligament strain in-vivo: A review of previous
3
work. J Biomech 31:519-525
4
7. Beynnon BD, Fleming BC, Labovitch R, Parsons B (2002) Chronic anterior cruciate ligament
5
deficiency is associated with increased anterior translation of the tibia during the transition from
6
non-weightbearing to weightbearing. J Orthop Res 20:332-337
7
8. Crawford R, Walley G, Bridgman S, Maffulli N (2007) Magnetic resonance imaging versus
8
arthroscopy in the diagnosis of knee pathology, concentrating on meniscal lesions and ACL tears:
9
A systematic review. Br Med Bull 84:5-23
10
9. Daniel DM, Malcom LL, Losse G, Stone ML, Sachs R, Burks R (1985) Instrumented measurement
11
of anterior laxity of the knee. J Bone Joint Surg Am 67:720-726
12
10. Daniel DM, Stone ML, Sachs R, Malcom L (1985) Instrumented measurement of anterior knee
13
laxity in patients with acute anterior cruciate ligament disruption. Am J Sports Med 13:401-407
14
11. Eagar P, Hull ML, Howell SM (2001) A method for quantifying the anterior load-displacement
15
behavior of the human knee in both the low and high stiffness regions. J Biomech 34:1655-1660
16
12. Fleming BC, Beynnon BD, Renstrom PA, Johnson RJ, Nichols CE, Peura GD, Uh BS (1999) The
17
strain behavior of the anterior cruciate ligament during stair climbing: An in vivo study.
18
Arthroscopy 15:185-191
19
13. Hang YS, Fung WC, Hang D (1993) Quantitative test of knee laxity in chinese. J Formos Med
20
Assoc 92:907-910
21
14. Hanten WP, Pace MB (1987) Reliability of measuring anterior laxity of the knee joint using a knee
22
ligament arthrometer. Phys ther 67:357-359
23
15. Henning CE, Lynch MA, Glick KR, Jr. (1985) An in vivo strain gage study of elongation of the
24
anterior cruciate ligament. Am J Sports Med 13:22-26
25
16. Hinton RY, Rivera VR, Pautz MJ, Sponseller PD (2008) Ligamentous laxity of the knee during
26
childhood and adolescence. J Pediatr Orthop 28:184-187
27
17. Hurley WL, Boros RL, Challis JH (2004) Influences of variation in force application on tibial
28
displacement and strain in the anterior cruciate ligament during the lachman test. Clin Biomech
29
19:95-98
30
18. Jaeschke R, Guyatt GH, Sackett DL (1994) Users' guides to the medical literature. III. How to use
31
an article about a diagnostic test. B. What are the results and will they help me in caring for my
32
patients? The evidence-based medicine working group. JAMA 271:703-707
33
19. Khan RT, Lie DT, Cashman PM, Thomas RW, Amis AA (2007) Measurement of laxity in the
34
anterior cruciate ligament-deficient knee: A comparison of three different methods in vitro. Proc
35
Inst Mech Eng H 221:653-663
36
20. Kupper J, Loitz-Ramage B, Corr D, Hart D, Ronsky J (2007) Measuring knee joint laxity: A review
37
of applicable models and the need for new approaches to minimize variability. Clin Biomech
22:1-13
1
21. Lee MC, Seong SC, Lee S, Chang CB, Park YK, Jo H, Kim CH (2007) Vertical femoral tunnel
2
placement results in rotational knee laxity after anterior cruciate ligament reconstruction.
3
Arthroscopy 23:771-778
4
22. Lin H-C, Lai W-H, Shih Y-F, Chang C-M, Lo C-Y, Hsu H-C (2009) Physiological anterior laxity in
5
healthy young females: The effect of knee hyperextension and dominance. Knee Surg Sports
6
Traumatol Arthrosc 17:1083-1088
7
23. Lubowitz JH, Bernardini BJ, Reid JB, 3rd (2008) Current concepts review: Comprehensive
8
physical examination for instability of the knee. Am J Sports Med 36:577-594
9
24. Maitland ME, Bell GD, Mohtadi NG, Herzog W (1995) Quantitative analysis of anterior cruciate
10
ligament instability. Clin Biomech 10:93-97
11
25. Markolf KL, Kochan A, Amstutz HC (1984) Measurement of knee stiffness and laxity in patients
12
with documented absence of the anterior cruciate ligament. J Bone Joint Surg Am 66:242-252
13
26. Markolf KL, Mensch JS, Amstutz HC (1976) Stiffness and laxity of the knee--the contributions of
14
the supporting structures. A quantitative in vitro study. J Bone Joint Surg Am 58:583-594
15
27. Matsumoto H, Toyoda T, Kawakubo M, Otani T, Suda Y, Fujikawa K (1999) Anterior cruciate
16
ligament reconstruction and physiological joint laxity: Earliest changes in joint stability and
17
stiffness after reconstruction. J Orthop Sci 4:191-196
18
28. Minns RJ, Soden PD, Jackson DS (1973) The role of the fibrous components and ground substance
19
in the mechanical properties of biological tissues: A preliminary investigation. J Biomech
20
6:153-165
21
29. Monaco E, Labianca L, Maestri B, De Carli A, Conteduca F, Ferretti A (2009) Instrumented
22
measurements of knee laxity: KT-1000 versus navigation. Knee Surg Sports Traumatol Arthrosc
23
17:617-621
24
30. Myrer JW, Schulthies SS, Fellingham GW (1996) Relative and absolute reliability of the KT-2000
25
arthrometer for uninjured knees. Testing at 67, 89, 134, and 178 N and manual maximum forces.
26
Am J Sports Med 24:104-108
27
31. Noyes FR, Bassett RW, Grood ES, Butler DL (1980) Arthroscopy in acute traumatic hemarthrosis
28
of the knee. Incidence of anterior cruciate tears and other injuries. J Bone Joint Surg Am
29
62:687-695
30
32. Osti L, Papalia R, Del Buono A, Merlo F, Denaro V, Maffulli N (2010) Simultaneous surgical
31
management of chronic grade-2 valgus instability of the knee and anterior cruciate ligament
32
deficiency in athletes. Knee Surg Sports Traumatol Arthrosc 18:312-316
33
33. Peeler J, Leiter J, MacDonald P (2010) Accuracy and reliability of anterior cruciate ligament
34
clinical examination in a multidisciplinary sports medicine setting. Clin J Sport Med 20:80-85
35
34. Prodromos CC, Han Y, Rogowski J, Joyce B, Shi K (2007) A meta-analysis of the incidence of
36
anterior cruciate ligament tears as a function of gender, sport, and a knee injury-reduction regimen.
37
Arthroscopy 23:1320-1325.e6
35. Pugh L, Mascarenhas R, Arneja S, Chin PY, Leith JM (2009) Current concepts in instrumented
1
knee-laxity testing. Am J Sports Med 37:199-210
2
36. Rijke AM, Perrin DH, Goitz HT, McCue FC, 3rd (1994) Instrumented arthrometry for diagnosing
3
partial versus complete anterior cruciate ligament tears. Am J Sports Med 22:294-298
4
37. Robert H, Nouveau S, Gageot S, Gagniere B (2009) A new knee arthrometer, the GNRB®:
5
Experience in ACL complete and partial tears. Orthop Traumatol Surg Res 95:171-176
6
38. Sernert N, Kartus J, Kohler K, Ejerhed I, Karlsson J (2001) Evaluation of the reproducibility of the
7
KT-1000 arthrometer. Scand J Med Sci Sports 11:120-125
8
39. Sherman OH, Markolf KL, Ferkel RD (1987) Measurements of anterior laxity in normal and
9
anterior cruciate absent knees with two instrumented test devices. Clin Orthop Relat Res
10
215:156-161
11
40. Shultz SJ, Nguyen AD, Schmitz RJ (2008) Differences in lower extremity anatomical and postural
12
characteristics in males and females between maturation groups. J Orthop Sports Phys Ther
13
38:137-149
14
41. Sorensen OG, Larsen K, Jakobsen BW, Kold S, Hansen TB, Lind M, Soballe K (2010) The
15
combination of radiostereometric analysis and the telos stress device results in poor precision for
16
knee laxity measurements after anterior cruciate ligament reconstruction. Knee Surg Sports
17
Traumatol Arthrosc Doi:10.1007/s00167-010-1205-2
18
42. Steiner ME, Brown C, Zarins B, Brownstein B, Koval PS, Stone P (1990) Measurement of
19
anterior-posterior displacement of the knee. A comparison of the results with instrumented devices
20
and with clinical examination. J Bone Joint Surg Am 72:1307-1315
21
43. Trimble MH, Bishop MD, Buckley BD, Fields LC, Rozea GD (2002) The relationship between
22
clinical measurements of lower extremity posture and tibial translation. Clin Biomech 17:286-290.
23
44. Wiertsema SH, van Hooff HJ, Migchelsen LA, Steultjens MP (2008) Reliability of the KT 1000
24
arthrometer and the lachman test in patients with an acl rupture. Knee 15:107-110
25
45. Winter DA (2004) Biomeahcnaics and motor control of human movement. 3rd edn. John Wiley &
26
Sons Inc, Hoboken, pp63
27 28
1
Table 1: The demography of the control and patient groups
2 3
For establishing diagnostic criteria (N=80) For validating diagnostic accuracy (N=71)
Control ACL patient Control ACL patient
Gender Male Female Male Female Male Female Male Female
30 10 30 10 10 30 8 23
Injury subgroup Acute Chronic Acute Chronic
9 31 6 25
Mean ± SD Mean ± SD P value Mean ± SD Mean ± SD P value
Age (year) 21.1 ± 2.5 24.5 ± 6.3 0.003* 21.9 ± 3.0 25.5 ± 6.1 0.005* Body height (cm) 168.2 ± 6.6 171.8 ± 8.3 0.04* 162.3 ± 7.2 173.6 ± 6.4 <0.001* Body weight (kg) 65.9 ± 12.3 73.0 ± 14.0 0.02* 55.7 ± 10.5 74.0 ± 14.2 <0.001* BMI (kg/m2) 23.2 ± 3.8 24.6 ± 3.9 NS 21.1 ± 2.8 24.4 ± 4.6 0.001* NS non-significant 4 * P < 0.05 5
Table 2: The intraclass correlation coefficient (ICC) of intra-rater and inter-rater reliability for regional analysis of anterior knee laxity in 40 ACLD and 40 control 1 subjects. 2 3 Intra-rater Inter-rater ICC(3,1) 95% CI ICC(3,3) 95% CI Rater 1 0.75 0.69-0.80
Displacement of region one (mm)
Rater 2 0.72 0.65-0.77 0.97 0.95-0.98
Rater 1 0.93 0.91-0.95
Displacement of region two (mm)
Rater 2 0.90 0.87-0.82 0.93 0.91-0.95
Rater 1 0.83 0.79-0.87
Displacement of region three (mm)
Rater 2 0.89 0.86-0.92 0.92 0.89-0.94
Rater 1 0.86 0.83-0.89
Stiffness of region one (N/mm)
Rater 2 0.86 0.83-0.89 0.99 0.99-0.99
Rater 1 0.75 0.69-0.80
Stiffness of region two (N/mm)
Rater 2 0.73 0.67-0.79 0.98 0.97-0.99
Rater 1 0.89 0.86-0.91
Stiffness of region three (N/mm)
Table 3: The displacement and stiffness of each region between groups
1 2
Control (N=40) Patient (N=40)
Mean ± SD Mean ± SD P-value at turning point 1 44.2 ± 12.3 48.6 ± 11.9 n.s. Force (N) at turning point 2 80.8 ± 18.0 83.5 ± 20.0 n.s. Region 1 1.4 ± 0.5 2.1 ± 0.7 <0.001** Region 2 2.6 ± 1.1 5.5 ± 3.0 <0.001** Displacement (mm) Region 3 2.1 ± 1.4 4.1 ± 1.9 <0.001** Region 1 36.5 ± 11.4 25.6 ± 11.8 <0.001** Region 2 14.6 ± 8.4 6.6 ± 3.7 <0.001** Stiffness (N/mm) Region 3 35.8 ± 13.6 14.3 ± 6.5 <0.001** ** P<0.001 3 n.s. non-significant 4
Table 4: The sensitivity, specificity, positive and negative likelihood ratio (LR+, and LR-) of the diagnosis criteria in both acute and chronic subgroups (N=71)
1 2
Sensitivity (%) LR+ LR-
Diagnostic criteria Specificity
(%) Both Acute Chronic Both Acute Chronic Both Acute Chronic
Side-to-side difference at 134 N > 3mm 93 45 67 40 6.0 8.9 5.3 0.6 0.4 0.7
Side-to-side difference at 89 N > 3mm 93 45 67 36 6.4 9.5 5.1 0.6 0.4 0.7
Compliance index > 3mm 98 55 15 40 22.0 6.0 16.0 0.5 0.9 0.6
Compliance index difference > 1.5mm 98 29 33 28 11.6 13.3 11.2 0.7 0.7 0.7
Displacement of region 2 > 3.7mm 70 81 83 72 2.7 2.8 2.4 0.3 0.2 0.4
0 2 4 6 8 10 12 14 16 18 0 20 40 60 80 100 120 Displacement (mm) F orc e (N) Raw Data Region 1 Region 2 Region 3 TP 1 TP 2 1 2 3
0 5 10 15 20 25 30 35 0 2 4 6 8 10 12 14 Displacement (mm) F o rc e (N ) Control Patient 1
Figure 2: The average force-displacement curves of the control (N =40) and patient (N=40) groups.
(A) 0 0.1 0.2 0.3 0.4 0.5 0.6 0.7 0.8 0.9 1 1.1 0 0.1 0.2 0.3 0.4 0.5 0.6 0.7 0.8 0.9 1 1-Specificity S e n s it iv it y Region 1 (AUC: 0.89) Region 2 (AUC: 0.86) Region 3 (AUC: 0.84) Reference line 1 (B) 0 0.1 0.2 0.3 0.4 0.5 0.6 0.7 0.8 0.9 1 1.1 0 0.1 0.2 0.3 0.4 0.5 0.6 0.7 0.8 0.9 1 1-Specificity Se n s it iv it y Region 1 (AUC: 0.84) Region 2 (AUC: 0.79) Region 3 (AUC: 0.94) Reference line 2
Figure 3: The ROC curve of diagnosis variables (A) displacement variables, the dash oblique line is
3
parallel with reference line; (B) stiffness variables (N=80)
4 5 6