行政院國家科學委員會專題研究計畫 成果報告
報價深度,實質深度及隱藏性深度
計畫類別: 個別型計畫 計畫編號: NSC91-2416-H-110-045- 執行期間: 91 年 12 月 01 日至 92 年 10 月 31 日 執行單位: 國立中山大學財務管理學系(所) 計畫主持人: 王子真 報告類型: 精簡報告 處理方式: 本計畫可公開查詢中 華 民 國 92 年 11 月 28 日
行政院國家科學委員會補助專題研究計畫成果報告
計畫類別:; 個別型計畫 □整合型計畫 計畫編號:NSC 91-2416-H-110-045 執行期間:91 年 12 月 1 日至 92 年 10 月 31 日 計畫主持人: 王子真 執行單位: 國立中山大學財務管理學系 計畫名稱: 報價深度、實質深度、隱藏性深度Quoted Depth, Effective Depth, and Hidden Depth
Quoted Depth, Effective Depth, and Hidden Depth
C.J. Wang Department of Finance National Sun Yat-Sen University
Kaohsiung, Taiwan [email protected]
Current draft: November 24, 2003
Abstract
In a market with market-makers, when the transaction volume is greater than its corresponding quoted depth, the posted depth is no longer an effective measure of market liquidity in the quantity dimension. Employing a sample of NYSE stocks, we find that 18% of trading volume of non-block trades are the excess market depth trades. In the cross-sectional analysis, the frequency/size of the excess market depth trades has a positive relationship with the trading intensity and a negative relationship with the corresponding quoted depth. Though, these findings are consistent with the one-price market-making function, they also support the notion that it is because of the concerns of information asymmetry and inventory control; specialists have the incentive to post a conservative depth when trading is intensive. Only when orders come in for execution, will the specialist decide the actual matching size.
Introduction
One of the key characteristics of an organized financial market is liquidity (Campbell, Lo, and MacKinlay, 1997). In fact, the provision of liquidity is one of the major reasons for the establishment of organized financial markets. It encourages the collection of costly information that leads to improved resource allocation (Seppi, 1997). Liquidity in stock markets encompasses multiple transactional properties of markets (e.g., Black, 1971; Kyle, 1985. For a comprehensive discussion, see O’Hara, 1995). For instance, the bid-ask spread, a conventional measure of tightness, is the cost of turning around a position over a short period of time. Nonetheless, just spread alone is not a sufficient measure of market liquidity (Grossman and Miller, 1988). Lee, Mucklow and Ready (1993) show that liquidity providers use both the spread and the depth1 to manage their risk in the market. Knez and Ready (1996) and Ready (1999) find that conditional expected price improvement is strongly and nonlinearly related to the normalized difference between quoted depth and order size. Kavajecz (1999) show that specialists change in quoted depth are consistent with the control of inventory and information event. Kavajecz and Odders-White (2001) find that changes in the best prices and depths on the limit order book have a significant impact on the posted price schedule, while the effects of transactions and order activity are secondary. Huang (2002) examines the quality of ECN quotes (both the spread and the depth) relative to those of posted by Nasdaq dealers. Coughenour and Deli (2002) study the liquidity provision of NYSE specialist firms. They find that there is a strong negative relationship between quoted spread and depth, indicating the tendency for specialists to reduce depth and widen spreads in the presence of increased uncertainty. Barclay, Christie, Harris, Kandel, and Schultz (1999) review the effect of U.S. stock market reform on Nasdaq stocks and find that the average trade size reduced under the new SEC rules, but there are sufficient depth at the posted quotes, which indicates the transaction cost for investors has fallen. In a different aspect, Petersen and Fialkowski (1994) show that there is a significant difference between the quoted spread and the effective spread2. When trades are executed inside the quoted bid-ask spread, the quoted spread is no longer an accurate measure of execution costs faced by investors. Sometimes the market is actually more liquid (therefore, less costly), in the tightness sense3, than what is indicated by the price posted on the quotation system. If the quoted spread is not an accurate measure of liquidity costs and market liquidity contains multiple properties as suggested by Black and Kyle, then questions arise about the relationship between the
1
An alternative measure of market depth is to measure the sensitivity of price change with respect to the order flow. This type of market depth can be found in, among others, Kyle (1985), Admati and Pleiderer (1988), Foster and Viswanathan (1990, 1993, 1996), Glosten and Milgrom (1985), Holden and Subrahmanyam (1992), and Back, Cao, and Willard (2000).
2
The purpose of the effective spread is to measure the size of the realized spread. In an auction (with market makers) or dealership market, each transaction only satisfies one side of the market. Hence, price improvement exists whenever the transaction price falls between the bid and ask quotes, but the effective spread is not readily measurable. Conventionally, to circumvent this issue is by assuming spread symmetry (e.g., Lee, Mucklow, and Ready, 1993; Petersen and Fialkowski, 1994). In a quantity (depth) improvement scenario, we prefer not to assume depth symmetry because quoted depth observed on both sides are often not the same.
3
By using stocks listed on Taiwan Stock Exchange, Rhee and Wang (1999) find that the difference between the quoted spread and the effective spread are not economically significant and conclude that is due to there is no designated market in TSE.
quoted depth4 and the effective (or realized) depth: Is the realized depth the same as the quoted depth? Is the market more liquid, in quantity dimension, than it appears to be? In particular, how significant is the realized depth greater than the corresponding quoted depth (market depth enhancement)5? In this paper, we are going to address these questions. At the intuitive level, a possible quick response to these questions is that the frequency of trade, whose actual trade size is beyond the corresponding quoted size, is at least equal to the frequency of the improvement in the price dimension6. An interesting implication of this study of depth is to the relationship between liquidity and asset pricing. Amihud and Mendelson (1986) propose a model that implies asset returns are positively correlated with their illiquidity (e.g., measured by the bid-ask spread). If depth is one of the major elements in liquidity, then we should observe a negative relationship between asset returns and the excess market depth trade7. Our empirical findings show that the phenomenon of the excess market depth does exist, and it is comprised as much as 18% of the total trading volume. Cross-sectional analysis shows that on average, trades that have excess market depths correspond to significantly smaller sizes in quoted depths. This suggests that market makers provide liquidity to those stocks when it is needed, which is consistent with the one-price market-making function. The frequency ratio of the excess market depth trade is negatively related to the mean transaction return. It implies that the higher the liquidity of the stock the lower its expected return, which is consistent with the prediction in Amihud and Mendelson (1986). In intraday analysis, we find that the quoted depth utilization ratio of the excess market depth trade has a U-shaped intraday pattern. However, the quoted depth utilization ratio of the regular trade has a decreasing intraday pattern, which is consistent with the prediction of the intraday pattern in the Kyle-type market depth (Holden and Subrahmanyam, 1992).
The rest of the paper is organized as follows. Section 1 discusses possible sources of depth-enhanced liquidity. Section 2 describes data and methodology. Section 3 presents empirical evidence, and is followed by concluding remarks.
1. Possible Sources of Depth-Enhanced Liquidity
In the current literature, most of the empirical analyses of liquidity in market depth focus on the quoted depth (Lee, Mucklow and Ready, 1993; Biais, Hillion, and Spatt, 1995; Kavajecz, 1996, 1999). The quoted depth, essentially8 the best quotes on the limit order book plus the market maker’s participation, is only part of the market
4
The quoted depths on NYSE and AMEX are minimum guarantees of performance posted by the specialist (Knez and Ready, 1996).
5
It is equivalently interesting to know how often and why does the realized depth is less or equal to the quoted depth.
6
For every improvement in the price dimension, there is an associated new quoted size (never been posted, however) in quantity dimension that fulfills the matched incoming orders. For every enhancement in quantity dimension (i.e., the actual depth is greater than the quoted depth), there may or may not have an associated improvement in price dimension. In short, a trade with a price improvement must have the improvement in both the price and the quantity dimension.
7
By extending this view, there should be a relationship between the asset pricing and the resilience of the asset price. That is, the higher the resilience of the asset price, the lower the expected return on the asset.
8
On the U.S. exchanges, the displayed quotes may not be solely from the limit order book: they may alternatively be the specialist’s own quotes or the quotes of floor traders, if there are better than the best quotes on the book (Schwartz, 1988, pp.24).
depth available9. Here, we would like to discuss some possible sources of
depth-enhanced liquidity that do not necessarily directly stem from the limit order
book.
1.1 No Quote Revision, After A Trade
Observe that, after a trade, if the trade consumed at least part of the posted depth and if there were no immediate competitive incoming new limit orders10, from the same side, with the same price or better, added to the book, then a set of new quotes needs to be posted to reflect the change in the quoted depth for the stock. But, often, after a trade, there is no quote revision, which means that the previous quote remains in effect11. It is possible that there are some timely incoming new public orders, which have the same price, added to the limit order book and the number of new shares is equal to the previous trading volume. The chance of having this kind of case, however, is probably low. It is more likely due to:
Institutional policy: A specialist may believe that there should be a minimum level of depth posted for his/her stock at all time no matter what is in the limit order book. For instance, if there are 300 shares bid in the book, the specialist may choose to post a total of bid 500 shares in which 200 shares are from his/her own inventory. Later, however, if there are some incoming limit bid orders with the same price and their number of shares is not significantly different12 from that of the specialist’s participation, then there will not be a quote revision in the bid depth. The new shares of incoming orders simply take place of the specialist’s participation13 in the posted depth. In this case, the specialist’s participation on the quotation system may be reduced, but his/her trading interest (including the requirement from the institutional policy) remains unchanged14. Similarly, after a trade, in the absence of new incoming public orders with the same price, the specialist may resume his/her participation posted on the quotation system by not revising the quotes.
Floor traders15: Working floor traders in the trading crowd are not required to disclose
9
Here, total market depth available, we mean that all the possible trading intention, in terms of volume, at that price in the marketplace. However, the quoted depth only reflects all the trading intention that has been entered the trading system, which is less than or equal to the total trading intention at that price in the marketplace. As to why some of the trading intention at that price has not entered the trading system can be due to reasons, such as trading strategies or inventory balancing concern.
10
We assume that the specialist does not change the level of his/her trading interest, if there is no quote revision. If the incoming orders have a better price, then there will be a quote revision.
11
The Consolidated Quote binary file, CQyymm.bin, is written in binary integer format with a fixed record length of 27 bytes. It contains one record for each quote reported, which remains in effect until it is changed (The TAQ Database, NYSE, Inc., version 3.2, pp.25).
12
When a specialist has some participation in the posted depth, it does not necessarily mean that he/she is really interested to trade that full amount participated, but may simply to fulfill the institutional policy in order to maintain a minimum level of depth in quotes. This minimum level of depth posted may contain some rounding effects. Author greatly appreciate this insight suggested by Michael Goldstein.
13
If the specialist chooses not to withdraw his/her quotes from the quotation system, this public order has the privilege to be traded before that of the specialist. This is called public order precedence rule.
14
That is, the trading interest of the specialist is simply moved to the background, not on the trading system, but still in the marketplace. Most importantly, the specialist has the direct access to the trading system at any time.
15
On the surface, it seems that trades among floor traders do not enhance market liquidity, especially towards public investors. Nonetheless, if floor traders do not trade among themselves but trade with public orders, it may take market liquidity away from other public orders. Hence, trades among floor
their full interests on the quotation system. They may choose to place timely orders to fulfil consumed depth at the same price.
The above scenarios show that the market depth can be thicker than what was posted on the quotation system. However, these types of ‘additional’ market depths surface only after a trade and they do not always contribute to the actual (realized) market depth. Nonetheless, they do form a platform for the excess market depth as described in the following.
1.2 Excess Market-Depths
Conventionally, we might perceive that if there is a trade match, the trading volume ‘normally’ is less than or equal to the corresponding quoted depth. It is possible, however, that a trade size is actually greater than the corresponding quoted depth, i.e., an excess market-depth trade16. This excess market depth17 can be due to the following factors18:
Specialist’s participation19: Specialists normally use their own inventories to fill the amount of the limit orders that are not completely filled by the public. It is important for specialists to give one-price execution because they are rated in their evaluation for performing this function. If a specialist gives a customer two prices, it increases the customer’s transaction cost. As in (A), a specialist’s participation displayed may be only a fraction of his/her total trading interest, if the combined number of shares of his/her participation and the shares of public orders has reached the minimum level required by the institutional policy. Further, from a strategic trading point of view, once a specialist’s participation is posted, he/she is committed to trade at that price with that depth before revision. In order to leave room for manoeuvring, there is an incentive for a specialist not to post his/her full-intended trading interest on the quotation system. A specialist’s intended trading interest may be revealed (possibly still partially) only at the time when orders come in for execution.
Floor traders’ participation: floor traders in the trading crowd are not required to divulge their full interests on the quote systems. Floor traders can trade with public orders as they come in for execution (Knez and Ready, 1996). A similar strategic trading behavior as that of specialists in (1).
If the transaction price was executed within the bid-ask quotes20, then there is a price improvement with a quantity enhancement (since the quoted depth on the quotation
traders, at least, passively enhance liquidity in the market.
16
Petersen and Fialkowski (1994) have mentioned this phenomenon and used it (Order size > quoted depth, Appendix: Variable definitions, pp. 291) as an independent variable in their regression measures. Angel (1997), Knez and Ready (1996), and Ready (1999) also apply this phenomenon to examine price improvement issue. However, they did not mention whether block trades are a possible concern. Furthermore, they did not particular examine the characteristics of this excess quoted-depth trades.
17
The excess quoted-depth trades implies that the trade did not invoke the discriminatory pricing rule.
18
The factors (1) and (2) are based upon conversations with Jeff Benton, the RPM Specialist on the NYSE. The author gratefully appreciates his advice.
19
Specialist participation expressed as the sum of shares purchased and sold by specialists divided by the twice total volume (TTV) was 15.1% of the total reported purchases and sales in 2001 (NYSE Fact Book, 2001 Data, pp.17).
20
The possible reasons for trades occur inside the quoted spread can be found in Petersen and Fialkowski (1994).
system21 has never been referred.) -- a dual improvement in market liquidity.
Market order enhanced liquidity: Timely incoming or unexecuted market orders22 can be a possible source of liquidity to match with incoming orders from the other side and leave the posted quote unchanged, even though the chance of this kind of case can be quite low (Hasbrouck, 1988).
Inducements for order flows: If the trade was transacted with a dealer who matched his/her price with the National Best Bid and Offer (NBBO, or BBO) but he/she was not the party who displayed the quotes in NBBO, then this trade implies that the effective intermarket depth is thicker than the quoted depth in the national marketplace. Transactions under inducements for order flows normally are retail orders with small trade-sizes.
Block trades of 10,000 shares or more can be negotiated upstairs or simply directly traded downstairs (Keim and Madhaven, 1996; Madhaven and Cheng, 1997). For a block trade negotiated in the upstairs market on NYSE, normally the volume of the block trade is not entirely supported by the posted depth or ignited from the limit order book (Schwartz, 1988). Hence, at least a significant portion of trading volume of block trades is the additional depth for the stock provided by the market. Nonetheless, this type of excess quoted-depths is not readily accessible by retail investors in the market.
From the above analysis, we perceive that a market can actually be more liquid, in term of depth, than what was displayed on the quotation system. In order to explore this phenomenon, we wish to focus our analysis on factors (1), (2) and (3), i.e., the excess quoted-depth trades on the NYSE and the price improvement trades. (Petersen and Fialkowski, 1994; Ready, 1998). By using the NYSE TAQ database, we cannot identify the types (market or limit orders) of orders. Hence, it may be difficult to test the market order enhanced liquidity in factor (4). Elements in factor (5) involve inter-market trading behavior, which may complicate our study and block trades in factor (6) are not available for typical retail investors. Thus, we do not evaluate them in this study.
2. Data and Methodology
For the study sample, we employ total ten months of transactional data that are recorded in the NYSE TAQ database, New York Stock Exchange, Inc., from July 2002 to April 2003. This database contains intraday transactional data (trades and quotes) for all securities listed on the New York Stock Exchange and the American Stock Exchange, as well as Nasdaq National Market System and SmallCap issues. To serve our purpose, we only choose those common stocks listed on the NYSE. Each stock in our sample needs to have a minimum average price of one dollar and maximum average price of five hundred dollar in each month. Furthermore, every
21
The transaction volume in the price improvement case is not a consumption of the current quoted depth in an order-driven market, such as NYSE. It is supported by hidden limits, floor traders/specialist, or incoming orders with better prices (Petersen and Fialkowski, 1994).
22
Handa and Schwartz (1996) suggested that a limit order supplies liquidity to the market and a market order demands liquidity from the market. Hence, it seems that the analysis of market depth based upon limit orders is more from the supply side point of view. Nonetheless, a market order can also be viewed as a supply of liquidity, when it is not executed immediately. Jeff Benton, a specialist on the NYSE, suggests that on the NYSE the average turnaround time on market orders from entry to execution is about 22 seconds.
month each stock needs to have a minimum of one hundred observations in order to be qualified to included in our sample. We classify these trades into four categories: (1) Regular trades: These trades are non-price improvement trades, non-block trades, and only trades with trade sizes less than or equal to their corresponding quoted depths, (2) Excess market depth trades23 (non-block trades): These trades are non-block trades and their trade sizes are greater than their corresponding quoted depths, (3) Price improvement trades: Trades in the sense of Petersen and Fialkowski (1994): They are non-block trades, and (4) Others. To use NYSE TAQ database for our purpose, we first need to match trades with quotes using the algorithm in Lee and Ready (1991) adjustment for quote timing. To identify these trades, we need to know their trade directions. We employ the methodology in Lee and Ready (1991) to find the trade direction for each trade.
In this study, we examine the cause of the excess market depth trade and its trading environment. We address the following questions: What is the situation for the quoted depth utilization? Does the excess market depth trade exist? How frequent and how significant is the excess market depth trade? Is there an intraday pattern for the quoted depth utilization? What are the firm characteristics of the excess market depth trade? Why would the excess market depth trades ever exist? (strategic trading behavior: inventory, information)
3. Results
3.1 Cross-sectional statistics
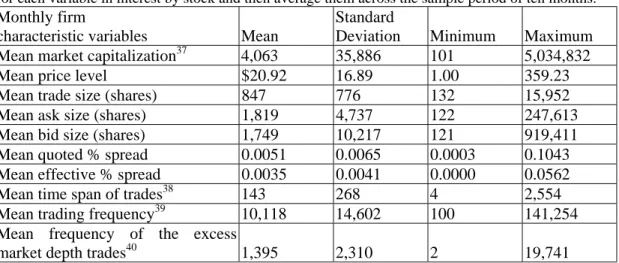
In Table 1-1, we present the summary statistics of the basic firm characteristics in our sample. The data that we employed are, Trade and Quote data, New York Stock Exchange, from July 2002 to April 2003. We first calculate monthly means for variables in interest for each firm, then compute the grand means of all firms for all ten months. In this study, we compute a new variable, the effective trading time span, which measures how long it takes for a trade to occur after a quote revision, to indicate trading intensity. The grand mean of monthly trading frequency is 10,019 per firm. The grand mean of the monthly frequency of the excess market depth trade is 1,387. This show that the phenomenon of the excess market depth trade does exist. Next, we are going to examine its significance.
Insert Table 1-1 here
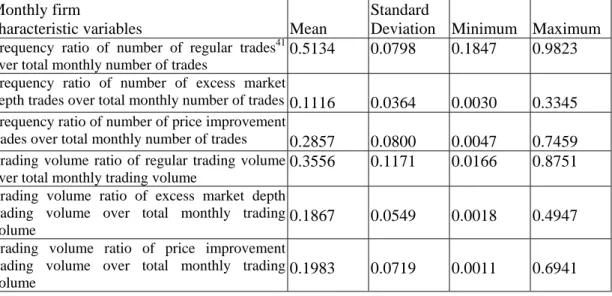
In Table 1-2, we show that the grand mean of the monthly frequency ratio24 of the number of the excess market depth trade over the total number of trade is 0.1118, relative to 0.2851 of the frequency ratio of the price improvement and 0.5135 of the frequency ratio of the regular trade25. It seems that, even though the excess market
23
Our definition of the excess market depth is different from that defined in Knez and Ready (1996) and Ready (1999). They define excess depth as the normalized difference between the quoted depth and the incoming order size. The difference can be positive or negative. We classify trades as the excess market depth trade only when the incoming order size is greater than the corresponding quoted depth and it is transacted at a single price.
24
We first compute the monthly ratio for each firm in each month, then average them across the sample period.
25
depth trade does occur, its frequency is relatively low. However, by examining the trading volume, we find that the mean monthly trading volume ratio26 of the excess market depth trading volume over the total trading volume is 0.1861, comparing to 0.1979 of the price improvement trade. The difference between the two is minimal. Thus, the excess market depth trade not only exists but also is significant.
Insert Table 1-2 here
The interesting phenomenon of relative low trading frequency ratio but relative high trading volume ratio of the excess market depth trade leads us to examine its trade related variables further. In Table 1-3, we show that the mean corresponding posted size (depth) of the excess market depth trade is smaller than that of price improvement trades or the regular trades. However, the mean trade size of the excess market depth trade is much larger than that of price improvement trades or the regular trades. This finding gives us the first clue of the characteristic of the excess market depth trade, i.e., it is not just having a trade size greater than its corresponding posted depth, but when the corresponding posted depth is relatively small. It also interesting to find that the grand mean of the effective percentage spread is much larger for the excess market depth trade than that of price improvement or regular trades. Furthermore, the grand mean effective trading time span of both the excess market depth trade and price improvement trade are much smaller than that of the regular trade. These two pieces of evidence imply that liquidity is enhanced when it is needed, especially when trading is intensive27. That is, the excess market depth trade occurs in an environment when its corresponding quote size is low, the spread is wide, and trading is intensive.
Insert Table 1-3 here
3.2 Intraday Trade Sizes, Quoted Sizes, and Quote Size Utilization
In this section, we examine the intraday patterns of the quoted depth utilization and its related variables. These analyses may provide us more insights to understand what happened in the market.
In Figure 1, we show the general pattern (i.e., for all types of trade) of the 30-minute intraday mean trade size and the mean quoted sizes of both sides. F-test and Duncan’s multiple range tests indicate that the mean trade sizes in the thirteen intraday 30-minute trading intervals present a gentle U-shaped pattern similar to the well-known pattern in trading volume (e.g., Lee, Mucklow, and Ready, 1993). In contrast, the pattern of the 30-minute intraday mean quoted depths of bid and ask both present a gradual increasing pattern, which is also confirmed by F-test and the Duncan test. This finding contrasts to the one in Lee, Mucklow, and Ready28(1993). Does this phenomenon imply that toward the close, the market becomes more liquid? To
10,000 share or more.
26
This trading volume of the excess market depth trade is its trade size.
27
The grand mean of the effective trading time span is 135 seconds, which is much smaller than that of the regular trade. This indicates that the price improvement trade offend occurs when trading is intensive.
28
In Lee, Mucklow, and Ready, 1993, their quoted depth is equal to the sum of the depth at the ask and bid, and these depths are measured at the end of each 30-minute interval.
address this question, we need to explore a fundamental issue of the measurement in quantity dimension. First, a thicker or a thinner quoted depth at the ask or bid itself alone may not form a complete basis to draw an inference on the liquidity quality. In quantity dimension, the proper measure of market liquidity should consider both the trade size and the size of liquidity provided. In this manner, we could then determine the quality of the market liquidity in quantity dimension. For instance, if the quoted depth is large at that moment but its matched incoming order size is even larger, then we would describe the level of liquidity quality as thin, if there is no extra depth around. Second, if trade initiation (i.e., buyer initiated or seller initiated) is random, then the side of the corresponding quoted depth is also random. To properly measure the size of available liquidity, we could not simply measure ask depth, bid depth, or the combination. We need to measure the corresponding quoted depth of the trade initiation29. In this sense, we need only to measure one series of quoted depth, i.e., the corresponding quoted depth30, and one series of trade size in order to form a relevant base for measuring liquidity quality in quantity dimension. Based upon these two series, we can develop the series of the quoted depth utilization ratio (i.e., trade size divided by the corresponding quoted depth), which indicates the level of liquidity quality31.
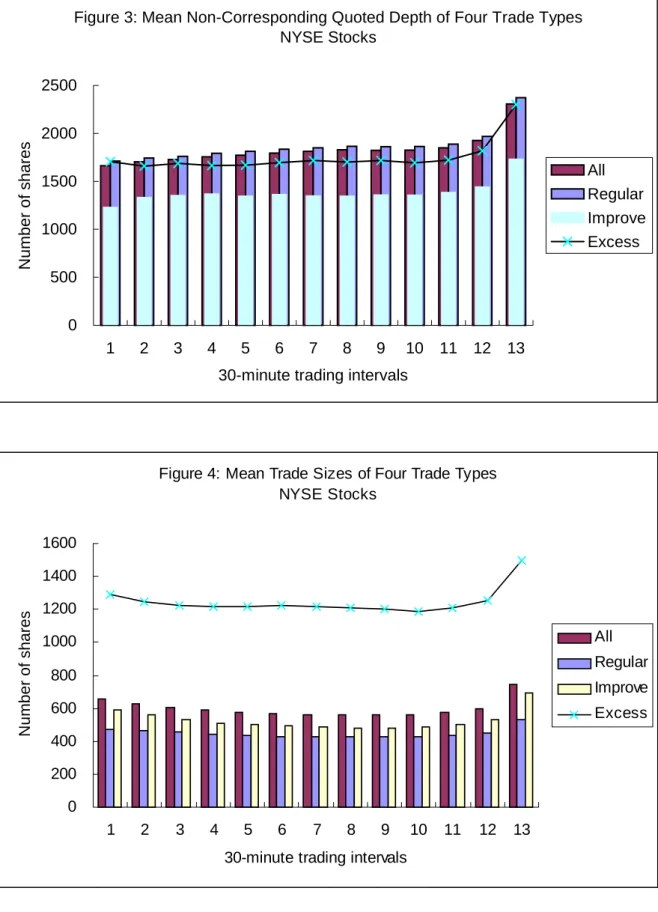
To serve our purpose, we decompose trades into four different trade types32 according to their trade characteristics i.e., the trades without price improvements and blocks, the excess market depth trades (but no blocks), the trades with price improvement (but no blocks), and the regular trades (without excess market depth trades, price improvements, and blocks). In Figure 2, we have the intraday patterns of the trade sizes of these four different trade types, they all present an U-shaped intraday pattern. Note that the mean sizes of the excess market depth trade in thirteen trading intervals are all significantly larger than those of the other three trade types. In Figure 3, the quoted sizes of these four trade types all present gradual rising patterns. That is, the quoted sizes of the last 30-minute trading intervals all significantly higher than those of the other trading intervals. However, the mean quoted sizes of the excess market depth in these thirteen trading intervals are all significantly smaller than those of the other trade types. This phenomenon dramatically contrasts the finding in Figure 2. Is it true that the level of the quoted depths for the excess market depth trade is always lower than those of the other three trade types? To answer this question, we compute the mean non-corresponding quoted depths and present them in Figure 4. Their sizes are very similar to those in Figure 3, with one exception. That is, the mean non-corresponding quoted depths of the excess market depth trade are much higher than their counterparts in Figure 3.
29
In order to do so, the determination of trade direction is crucial. We employ the methodology in Lee and Ready (1991). The drawback is that it could not determine trade direction for all trades due to, for instance, the trade was occurred at the mid price.
30
A series of non-corresponding quoted depth (i.e., the counterpart of the corresponding quoted depth) can also be developed. It certainly can be used to compare the pattern in the corresponding quoted depth.
31
The notion of our quoted depth utilization ratio is similar to the measure of the excess depth used in Knez and Ready (1996) and Ready (1999). Their measure is to normalize the difference between the quoted depth and the trade size. We prefer the ratio type measure is because we recognize there are many different trade types, such as trades of block, price improvement, excess market depth, and regular. Thus, the mean depth used in normalization would not properly serve our purpose.
32
Trade directions of these trades all can be identified in order to find their corresponding quoted depth. Trades that do not have a trade direction are excluded.
This finding implies that throughout the thirteen trading intervals the excess market depth trade occurs at the moment when the market suffers a dramatic order imbalance because the specialist/floor traders stepped in with extra liquidity and did not let the matched incoming order walk up the limit order book. In this case, whether the specialist (and floor traders) is informed (e.g., able to access the limit order book) or not, he/she may perceive the matched incoming order as a liquidity order. Otherwise, the matched incoming order would have to walk up the limit order book under the discriminatory pricing rule.
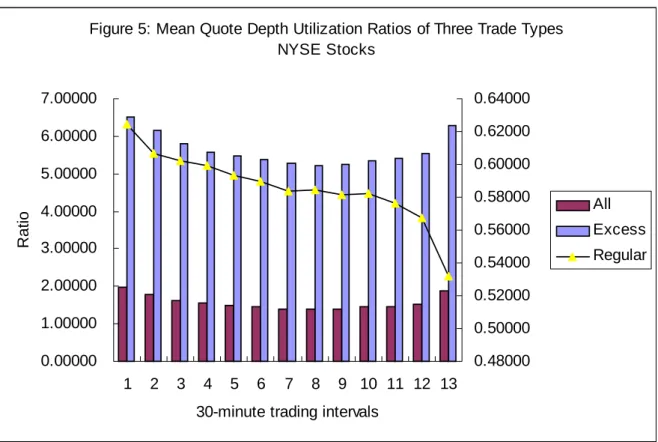
The intraday quoted depth utilization ratio patterns of three trade types are illustrated in Figure 5. Quoted depth utilization ratio is defined as the trade size divided by its corresponding quoted size. The quoted depth utilization ratios of the excess market trades has a U-shaped intraday pattern as many intraday patterns, such as trading volume, in the literature. The quoted depth utilization ratio of the regular trade, however, has a downward-slope pattern. In particular, the utilization ratio is declining continuously, except from the 7th to the 10th 30-minute trading intervals, which is confirmed by the Duncan’s multiple range test. This result implies that on average not all the trade sizes (see Figure 1 and 2) increase the same proportion as those in their corresponding quoted depths (see Figure 3). This is particularly true for those of regular trades. A higher level of mean quote depth utilization is, at least, partially due to the contribution of the excess market depth trades, especially around market close. If we only consider the quoted depth utilization in its purest form, i.e., no block trades and no excess market depth trades, then the decreasing intraday pattern in the quoted depth utilization of regular trades implies that the quoted liquidity in quantity dimension is low in the earlier period of trading and gradually become higher and higher toward the end of trading period. This finding is interestingly consistent with the prediction of increasing market liquidity in Holden and Subrahmanyam (1992) and contrasts to the constant market liquidity model in Kyle (1985). Holden and Subrahmanyam also examine how quickly the system approaches the perfect competition outcome characterized by the price fully reflecting the information of all privately informed agents. Our regular trades are in a perfect competition setting because the supply and demand in liquidity are all from general public traders, including the specialist and floor traders. However, it is not necessarily the same for block trades or the excess market depth trades. Furthermore, the quoted depth maybe does not represent the whole concept of market depth as described in Kyle-type models, but the quoted depth certainly is a major part of market depth. For instance, a thin quoted depth of a marketable limit order may not satisfy matched income order and the discriminatory pricing rule will apply, which makes price move.
3.3 Regression analyses
In this section, we are going to examine the firm characteristics of the excess market depth trade. We wish to find out how firm characteristics affects the occurrence and the magnitude of the excess market depth trade.
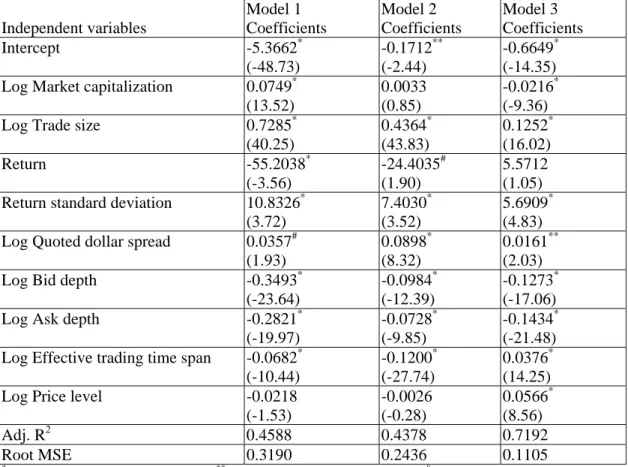
In Table 2, we present the result of the regression analyses. In Model 1, the dependent variable is the frequency ratio of the number of monthly excess market depth trades
over the number of monthly regular trades33 at the natural logarithm level. It is the relative frequency, instead of the absolute frequency, that concerns us. In Model 2, the dependent variable is the monthly mean volume ratio of the excess market depth trade size over the corresponding quote size at the natural logarithm level. In Model 3, the dependent variable is the monthly mean volume ratio of the regular trade size over the corresponding quote size at the natural logarithm level. All three models regress on a same set of firm characteristic variables and liquidity variables, which are all at the natural logarithm levels, except the mean transaction return and its standard deviation.
Insert Table 2 here
In Model 1, the relative frequency ratio of the excess market depth trades is significantly positively related to the market capitalization and trade size. That is, larger firms and/or larger trade size firms will on average have a higher relative frequency ratio of the excess market depth trades. There is a significant negative relationship between the relative frequency ratio and the mean return variable. This finding is consistent with the prediction of Amihud and Mendelson (1986). If liquidity is priced by the market, then there should be a negative relationship between the liquidity of a security and its expected return in equilibrium. A higher relative frequency ratio of the excess market depth trade represents a higher liquidity34. Thus, securities that have higher relative frequency ratios of the excess market depth trade should have lower expected returns. The relationship between the relative frequency ratio and the mean quoted dollar spread is significantly positive. Furthermore, the relationship between the relative frequency ratio and the depths of bid and ask is negative. Firms have smaller quoted bid and ask depths tend to have a higher frequency of the excess market depth trades. These two findings imply that the extra liquidity is provided to these stocks, since their liquidity in both price and quantity dimensions are relatively limited cross-sectionally, more likely by the specialist and/or floor traders. Finally, there is a negative relationship35 between the relative frequency ratio and the mean effective trading time span (the time span between the quotation time and the transaction time). The mean effective trading time span represents the trading intensity. Firms with higher trading intensity will have smaller mean effective trading time span, and, thus have higher relative frequency ratios of the excess market depth trade. Why is that? For high trading intensity stocks, information is continuously incorporated into prices in high speed. To minimize the adverse selection issue or changes in the market condition, public traders may tend to submit orders for those stocks with relative more conservative order sizes. This gives rise of opportunities to other traders, such as the specialist and floor traders, who can react quickly to fill up these gaps.
In Model 2, we regress the mean of the excess market depth trade size ratio on the
33
There are other types of trade, such price improvement trade or block trade. All these types of trade are deviations from regular trades.
34
We may view this type of liquidity as unexpected liquidity.
35
Here, the meaning of the negative relationship between the relative frequency ratio and the mean effective trading time span is that for firms having smaller effective trading time spans tend to have higher relative frequency ratios of the excess market depth trade. However, in Table 1-3, the meaning of smaller mean effective trading time span for the excess market depth trade is that on average the excess market depth trade has a smaller effective trading time span for all firms.
same set of independent variables. This model is to examine how does the size of the excess market depth be determined cross-sectionally. We find that the signs and the significance of the slope coefficients are all the same as those in Model 1, except that of the market capitalization. This finding indicates that this set of independent variables is able to explain not only the occurrence frequency but also the size of the excess market depth trade. The adjusted R2 of both models exceeds 0.40. In particular, the negative relationship between the mean excess market depth trade size ratio and the mean return implies that firms with low expected returns should expect high excess market depth trade size ratios. Similarly, the negative relationship between the mean excess market depth trade size ratio and the mean effective trading time span implies that that firms with low effective trading time span (i.e., high trading intensity) should expect high excess market depth trade size ratios. These two variables, along other variables, determine both the frequency and the magnitude of the hidden liquidity in quantity dimension.
In Model 3, we examine the determinants of the mean trade size ratio of the regular trade. A negative relationship between the regular trade size ratio and the mean market capitalization implies that smaller firms tend to have higher regular trade size ratio. This finding contrasts to that market capitalization is not a determinant to the size ratio of the excess market depth trade in Model 2. The signs of the coefficients of the mean trade size, the mean bid quoted depth and the mean ask quoted depth are the same as those in Model 2. The main reason is that the dependent variables in both models are ratios. In Model 3, the positive coefficient of the mean trade size implies that the larger the trade size (in the numerator of the ratio) the higher the regular trade size ratio. The negative coefficients of the mean bid and ask quoted depths suggest that the lower the quoted depth (in the denominator of the ratio) the higher the trade size ratio of the regular trade. However, no matter how high the regular trade size ratio is, it is still a regular trade. It does not enjoy a higher liquidity than what was posted on the quotation system. Its liquidity quality is as what was posted on the quotation system. Thus, the coefficient of the mean return is insignificantly positive, contrasting to the one of the excess market depth trade size ratio in Model 2. Furthermore, the coefficient of the mean effective trading time span is significantly positive. It implies that the trade size ratio of the regular trade is higher for those stocks whose trading activities are less intensive, contrast to the one of the trade size ratio of the excess market depth trade in Model 2.
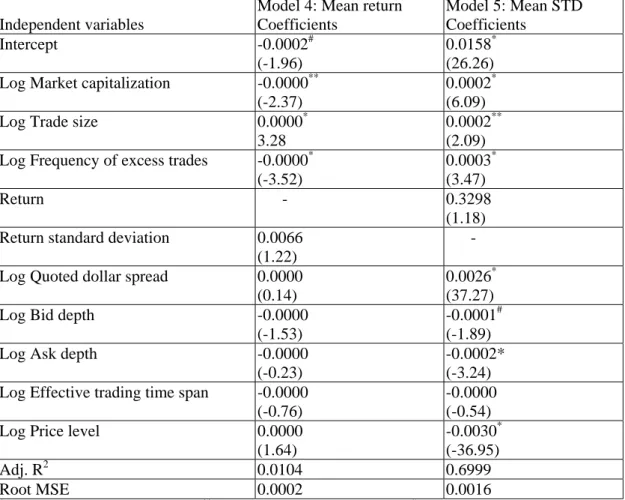
After showing the firm characteristics of the excess market depth trades, we examine how would the excess market trades and its associated variables affect the price discovery process after controlling for the firm characteristic variables, i.e., firm size, trade size, mean return, and price level. In model 4, we regress the mean returns on a set of independent variables similar to the ones in the previous models, only by replacing mean returns with the log frequency ratios of the excess market depth trade frequency over the regular trade frequency. In model 5, we regress the mean return standard deviations on a set of independent variables similar to the ones in model 4, only by replacing the mean return standard deviations with the mean returns. In Table 3, we present the regression results. Except the controlling variables, the only variable that affects the mean return, i.e., the dependent variable, is the mean frequency ratio of the excess market depth. Its negative sign is consistent with the finding in the previous models. That is, the higher the frequency ratio of the excess market depth, the higher the liquidity of the stock, thus, the lower the expected return,
which means that the liquidity is priced in the market. Nonetheless, there is no other liquidity associated variables can offer any explanation to the dependent variable of the mean return. Furthermore, the adjusted R square of the model is trivial. The findings in model 5, however, offer some clues about the relationship between the liquidity variables and the price discovery process at the return standard deviation level. After controlling for the firm characteristic variables, all liquidity variables are significant. The coefficient of the log frequency ratio of the excess market trades has a positive sign, which indicates that firms with high frequency ratio of the excess market depth trades have higher volatility. Both coefficients of the log ask and bid quoted depths are significantly negative. It may be interpreted as that there is a negative relationship between the quoted depth and the return volatility, which is intuitively appealing. However, these quotes are directly taken from limit orders, which offer liquidity to the market. At the same time, in the literature, limit orders are claimed as free options. That is, they are free to whoever the participants in the market can timely matched these orders. Are limit orders free options, or they are simply part of an advertising scheme? Amihud and Mendelson (1986) show that as asset’s liquidity feature should have been priced in the market. Their empirical evidence shows that there is a positive relationship between the size of the bid-ask spread and the mean return of the stock. In this case, we can form the null hypothesis that limit orders provide free options to the market, and the alternative hypothesis is that limit orders facilitate market liquidity with a price36. In Model 4,
there is not much relationship between the mean return and the liquidity variables (quoted depths and spread). However, there are significant relationships between the quoted depth/spread and the mean return standard deviation in Model 5. Our finding may be interpreted as that quotes have value, and they are not free because they have been priced in the price discovery process at the second moment level. In particular, cross-sectionally, the thinner the quoted depths and the wider the quoted dollar spread, the higher the volatility of the stock. After all, the users would need to pay for all the associated costs whether is at the return or at the risk level.
Insert Table 3 here Conclusion
This study examines the market liquidity by contrasting the effective depth to the posted depth, and, thus, the hidden depth. In particular, we focus on the issue of liquidity enhancement in quantity dimension. That is, the phenomenon that the actual transaction volume is greater than the size of the corresponding posted depth, even without price improvement. It is inherit in the market-maker trading system (the specialist system and, possibly, the dealership system as well) that market makers have an incentive to post a smaller quote, in terms of their own participation, than their full trading interests. This is because the quotes posted are binding and market makers face both the adverse selection and the inventory control problems, in addition to the obligation of market-making. To protect their positions, quoted depth, in addition to price quote, is an important choice variable to keep themselves in the
36
An alternative to view posted quotes as trading options is that it is not free. It is simply that traders pay for the option premium at the same time when they exercise the options. Since this is the only way and only time that both sides of the option traders can exchange the derivatives and cash. All other traders who can only observe the posted quotes. If they want to exercise the options, they also need to pay for it.
game (rather than withdraw completely, e.g., by considering an inferior price; or not to perform aggressively, e.g., by considering a price improvement). Only when orders coming in for execution, should the market maker consider whether it is feasible (the one-price market-making function, the adverse selection/inventory control concerns) for him/her to fill up the orders by providing additional depth from his/her own inventory.
Our empirical findings show that the phenomenon of the excess market depth does exist, and it is comprised as much as 18% of the total trading volume (without considering the trading volume of the price improvement trade). Cross-sectional analysis shows that on average, trades that have excess market depths correspond to significantly smaller sizes in quoted depths. This suggests that market makers provide liquidity to those stocks when it is needed, which is consistent with the one-price market-making function. Larger equity size firms tend to have higher frequency in excess market depth trades. The frequency ratio of the excess market depth trade is negatively related to the mean transaction return. It implies that the higher the liquidity of the stock the lower its expected return, which is consistent with the prediction in Amihud and Mendelson (1986). In intraday analysis, we find that the sizes of the quoted depths present an increasing function in the thirteen 30-minute trading intervals. Similar patterns were found in both the corresponding and non-corresponding quoted depths, while the intraday trade sizes present a U-shaped pattern.. These findings are summarized in the quoted depth utilization ratios. We find that the quoted depth utilization ratio of the excess market depth trade has a U-shaped intraday pattern. However, the quoted depth utilization ratio of the regular trade has a decreasing intraday pattern, which is consistent with the prediction of the intraday pattern in the Kyle-type market depth (Holden and Subrahmanyam, 1992).
Reference
Andrews, D.W.K., 1991, Heteroscedasticity and Autocorrelation Consistent Covariance Matrix Estimation, Econometrica 59, 817-858.
Andrews, D.W.K. and J.C., Monahan, 1992, An Improved Heteroscedasticity and Autocorrelation Consistent Covariance Matrix Estimator, Econometrica 60, 953-966. Admati, A.R., and Plfeiderer, P., 1988, A Theory of Intraday Trading Patterns: Volume and Price Variability, Review of Financial Studies, 1, 3-40.
Amihud, Y., and Mendelson, H., 1986, Asset Pricing and the Bid-Ask Spread, Journal of Financial Economics 17, 223-249.
Angel, J.J., 1997, Who Gets Price Improvement on the NYSE? Working paper, Georgetown University.
Back K., C.H. Cao, and G.A. Willard, 2000, Imperfect Competition among Informed Traders, Journal of Finance 55, 2117-2155.
Barclay, M.J., W.G. Christie, J.H. Harris, E. Kandel, and P.H. Schultz, 1999, The Effects of Market Reform on the Trading Costs and Depths of Nasdaq Stocks, Journal of Finance 54, 1-34.
Black, F., 1971, Toward a Fully Automated Stock Exchange, Financial Analysts Journal, July-August, 29-44.
Biais, B., Hillion, P., and Spatt, C., 1995, An Empirical Analysis of the Limit Order Book and the Order Flow in the Paris Bourse, Journal of Finance, 50, 1655-1689. Campbell, J.Y., Lo, A. W., and MacKinlay, A. C., 1997, The Econometrics of Financial Markets, Princeton University Press, Princeton, NJ.
Christie, W.G., and Schultz, P.H., 1994, Why Do Nasdaq Market Makers Avoid Odd-Eighth Quotes? Journal of Finance 49, 1813-1840.
Coughenour, J.F., and D.N. Deli, 2002, Liquidity Provision and the Organizational Form of NYSE Specialist Firms, Journal of Finance 57, 841-869.
Dupont, D.Y., 1995, Market Making, Prices and Quantity Limits, Working paper, Board of Governors of the Federal Reserve System.
Foster, F.D., and S. Viswanathan, 1990, A Theory of the Intraday Variations in Volume, Variance and Trading Costs in Securities Markets, Review of Financial Studies.
Foster, F.D., and S. Viswanathan, 1996, Strategic Trading when Agents Forecast the Forecast of Others, Journal of Finance 47, 247-270.
Glosten, L., and Milgrom, P., 1985, Bid, Ask and Transaction Prices in a Specialist Market with Heterogeneously Informed Traders, Journal of Financial Economics 14, 71-100.
Handa, P, and Schwartz, R.A., 1996, Limit Order Trading, Journal of Finance 51, 1835-1861.
Hasbrouck, J., 1988, Trades, Quotes, Inventories, and Information, Journal of Financial Economics 22, 229-252.
Holden, G.W., and A Subrahmanyam, 1992, Long-Lived Private Information and Imperfect Competition, Journal of Finance 47, 247-270.
Huang, R.D., 2002, The Quality of ECN and Nasdaq Market Maker Quotes, Journal of Finance 57, 1285-1319.
Kavajecz, K., 1999, A Specialist’s Quoted Depth and the Limit Order Book, Journal of Finance 54, 747-771.
Kavajecz, K., 1998, A Specialist’s Quoted Depth as a Strategic Choice Variable, Unpublished working paper, the Wharton School, University of Pennsylvania.
Kavajecz, K.A., and E.R. Odders-White, 2001, An Examination of Changes in Specialists’ Posted Price Schedules, Review of Financial Studies 14, 681-704.
Keim, D.B, and A. Madhavan, 1996, The Upstairs Market for Large-Block Transactions: Analysis and Measurement of Price Effects, Review of Financial Studies 9, 1-36.
Knez, P.J., and Ready, M.J., 1996, Estimating the Profits from Trading Strategies, Review of Financial Studies 9, 1121-1163.
Kyle, A.S., 1985, Continuous Auction and Insider Trading, Econometrica 53, 1315-1335.
Lee, C.M.C., and Ready, M.J., 1991, Inferring Trade Direction from Intraday Data, Journal of Finance 46, 733-746.
Lee, C., Mucklow, B., and Ready, M., 1993, Spreads, Depths, and the Impact of Earnings Information: An Intraday Analysis, Review of Financial Studies 6, 345-374. Madhavan, A, and M. Cheng, 1997, In Search of Liquidity: Block Trades in the Upstairs and Downstairs Markets, Review of Financial Studies 10, 175-203.
McInish T.H., and R.A. Wood, 1995, Hidden Limit Orders on the NYSE, Journal of Portfolio Management, Spring, 19-26
NYSE Fact Book, 2001, New York Stock Exchange, Inc.
O’Hara, M., 1995, Market Microstructure Theory, Blackwell Publishers, Inc., Cambridge, MA.
Petersen, M.A., and Fialkowski, 1994, D., Posted versus Effective Spreads: Good Prices or Bad Quotes? Journal of Financial Economics 35, 269-292.
Ready, M.J., 1999, The Specialist’s Discretion: Stopped Orders and Price Improvement, Review of Financial Studies 12, 1075-1112.
S. G. Rhee and C.J. Wang, 1999, "The Quoted and the Effective Spread on the Taiwan Stock Exchange." in Advances in Pacific Basin Financial Markets., Vol. V (edited by Theodore Bos and Thomas A. Fetherston), JAI Press Inc., Greenwich, CT.
Rock, K, 1989, The Specialist’s Order Book and Price Anomalies. Working paper. Harvard University.
Schwartz, R.A., 1988, Equity Markets: Structure, Trading, and Performance, Harper & Row, New York, Chapter 3.
Seppi, D.J., 1997, Liquidity Provision with Limit Orders and a Strategic Specialist, Review of Financial Studies 10, 103-150.
The TAQ Database, Version 3.2, New York Stock Exchange, Inc.
White, H., 1980, A Heteroskedasticity-Consistent Covariance Matrix Estimator and a Direct Test for Heteroskedasticity, Econometrica 48, 817-838.
Table 1-1: Monthly Cross-Sectional Summary Statistics
We select common stocks listed on the New York Stock Exchange, from July 2002 to April 2003 in NYSE TAQ data that have at least one hundred observations per month and the monthly mean price level is between one dollar and five hundred dollars (inclusive). We first compute the monthly mean for each variable in interest by stock and then average them across the sample period of ten months.
Monthly firm
characteristic variables
Mean
Standard
Deviation Minimum Maximum Mean market capitalization37 4,063 35,886 101 5,034,832
Mean price level $20.92 16.89 1.00 359.23
Mean trade size (shares) 847 776 132 15,952
Mean ask size (shares) 1,819 4,737 122 247,613
Mean bid size (shares) 1,749 10,217 121 919,411 Mean quoted % spread 0.0051 0.0065 0.0003 0.1043 Mean effective % spread 0.0035 0.0041 0.0000 0.0562
Mean time span of trades38 143 268 4 2,554
Mean trading frequency39 10,118 14,602 100 141,254
Mean frequency of the excess
market depth trades40 1,395 2,310 2 19,741
From July 2002 to April 2003, the monthly numbers of firms selected are 2,436, 2,429, 2,405, 2,429, 2,423, 2,471, 2,460, 2,430, 2,452, and 2,469, respectively. The effective bid-ask spread calculation procedure follows the methodology suggested in Petersen and Fialkowski (1994).
37
Market capitalization is in millions.
38
The effective trading time span is the time length in seconds between the time of the quote and the time of the trade.
39
The trading frequency is the number of trades per month of a firm.
40
Frequency of the excess market depth trades is the number of the excess market depth trade per month of a firm.
Table 1-2: The Cross-Sectional Mean of the Frequency Ratios
We select common stocks listed on the New York Stock Exchange, from July 2002 to April 2003 in NYSE TAQ data that have at least one hundred observations per month and the monthly mean price level is between one dollar and five hundred dollars (inclusive). We first compute the monthly mean for each variable in interest by stock and then average them across the sample period of ten months.
Monthly firm
characteristic variables
Mean
Standard
Deviation Minimum Maximum
Frequency ratio of number of regular trades41 over total monthly number of trades
0.5134 0.0798 0.1847 0.9823
Frequency ratio of number of excess market
depth trades over total monthly number of trades 0.1116 0.0364 0.0030 0.3345
Frequency ratio of number of price improvement
trades over total monthly number of trades 0.2857 0.0800 0.0047 0.7459
Trading volume ratio of regular trading volume over total monthly trading volume
0.3556 0.1171 0.0166 0.8751
Trading volume ratio of excess market depth trading volume over total monthly trading
volume 0.1867 0.0549 0.0018 0.4947
Trading volume ratio of price improvement trading volume over total monthly trading
volume 0.1983 0.0719 0.0011 0.6941
41
The regular trades do not include block trades, price improvement trades, or excess market depth trades..
Table 1-3: The Cross-Sectional Means of Trade Sizes, Quote Sizes, and Effective Percentage Spreads
We select common stocks listed on the New York Stock Exchange, from July 2002 to April 2003 in NYSE TAQ data that have at least one hundred observations per month and the monthly mean price level is between one dollar and five hundred dollars (inclusive). We first compute the monthly mean for each variable in interest by stock and then average them across the sample period of ten months.
Monthly firm
characteristic variables
Mean
Standard
Deviation Minimum Maximum Trade size: excess market depth trades 1,240 565 229 5,905 Trade size: price improvement trades 519 291 106 2,410
Trade size: regular trades 512 299 121 3,011
Corresponding posted size: excess market
depth trades 462 277 100 4,067
Corresponding posted size: price
improvement trades 1,661 5,089 120 327,841
Corresponding posted size: regular trades
2,062 6,031 168 347,101 Quoted % spread: excess market depth
trades
0.0052 0.0066 0.0003 0.1347
Effective trading time span: excess market depth trades
140 302 4 5,256
Effective trading time span: price improvement trades
127 271 4 4,575
Table 2: Cross-Sectional Regression Analyses
We select common stocks listed on the New York Stock Exchange, from July 2002 to April 2003. We compute variables in interests at the transactional level for each firm in each month. Then, we form a panel data sorted by firm and month. The specification of the regression model is: Dependent variable = a + b1⋅LogMktCap + b2⋅LogTradeSize + b3⋅Return + b4⋅ReturnSTD + b5⋅LogQuoted$Spread
+ b6⋅LogBidDepth + b7⋅LogAskDepth + b8⋅LogEffectiveTime + b9⋅LogPrice + ε. The dependent
variable for model 1 is the frequency ratio of the number of the monthly excess market depth trade over the total number of monthly trade of stock i, where i = 1, 2, … N. N is the number of stocks in the sample month. The dependent variable for model 2 is the logarithm monthly mean ratio of the trade size over its corresponding quoted depth for the excess market depth trade. The dependent variable for model 3 is the logarithm monthly mean ratio of the trade size over its corresponding quoted depth for the regular trade. t-values reported in the parentheses are based upon the consistent covariance matrix (Andrew, 1991; Andrew and Monahan, 1992).
Independent variables Model 1 Coefficients Model 2 Coefficients Model 3 Coefficients Intercept -5.3662* (-48.73) -0.1712** (-2.44) -0.6649* (-14.35) Log Market capitalization 0.0749*
(13.52)
0.0033 (0.85)
-0.0216* (-9.36)
Log Trade size 0.7285*
(40.25) 0.4364* (43.83) 0.1252* (16.02) Return -55.2038* (-3.56) -24.4035# (1.90) 5.5712 (1.05) Return standard deviation 10.8326*
(3.72)
7.4030* (3.52)
5.6909* (4.83) Log Quoted dollar spread 0.0357#
(1.93)
0.0898* (8.32)
0.0161** (2.03)
Log Bid depth -0.3493*
(-23.64)
-0.0984* (-12.39)
-0.1273* (-17.06)
Log Ask depth -0.2821*
(-19.97)
-0.0728* (-9.85)
-0.1434* (-21.48) Log Effective trading time span -0.0682*
(-10.44)
-0.1200* (-27.74)
0.0376* (14.25)
Log Price level -0.0218
(-1.53) -0.0026 (-0.28) 0.0566* (8.56) Adj. R2 0.4588 0.4378 0.7192 Root MSE 0.3190 0.2436 0.1105 *
Table 3: Cross-Sectional Regression Analyses
We select common stocks listed on the New York Stock Exchange, from July 2002 to April 2003. We compute variables in interests at the transactional level for each firm in each month. Then, we form a panel data sorted by firm and month. The specification of the regression models is: Dependent variable = a + b1⋅LogMktCap + b2⋅LogTradeSize + b3⋅LogFreq + b4⋅Return (or + b4⋅ReturnSTD, for
model 5) + b5⋅LogQuoted$Spread + b6⋅LogBidDepth + b7⋅LogAskDepth + b8⋅LogEffectiveTime +
b9⋅LogPrice + ε. The dependent variable for model 4 is the monthly mean transactional return of
stock i, where i = 1, 2, … N. N is the number of stocks in the sample month. The dependent variable for model 6 is the monthly transactional return standard deviation. t-values reported in the parentheses are based upon the consistent covariance matrix (Andrew, 1991; Andrew and Monahan, 1992).
Independent variables
Model 4: Mean return Coefficients Model 5: Mean STD Coefficients Intercept -0.0002# (-1.96) 0.0158* (26.26) Log Market capitalization -0.0000**
(-2.37)
0.0002* (6.09)
Log Trade size 0.0000*
3.28
0.0002** (2.09) Log Frequency of excess trades -0.0000*
(-3.52)
0.0003* (3.47)
Return - 0.3298
(1.18) Return standard deviation 0.0066
(1.22)
-
Log Quoted dollar spread 0.0000 (0.14)
0.0026* (37.27)
Log Bid depth -0.0000
(-1.53)
-0.0001# (-1.89)
Log Ask depth -0.0000
(-0.23)
-0.0002* (-3.24) Log Effective trading time span -0.0000
(-0.76)
-0.0000 (-0.54)
Log Price level 0.0000
(1.64) -0.0030* (-36.95) Adj. R2 0.0104 0.6999 Root MSE 0.0002 0.0016 *
Figure 1: Mean Trade Sizes and Quoted Depths NYSE Stocks 0 500 1000 1500 2000 2500 1 2 3 4 5 6 7 8 9 10 11 12 13
30-minute trading intervals
Number of shares
masize mbsize mtsize
Figure 2: Mean Corresponding Quoted Depths of Four Trade Types NYSE Stocks 0 500 1000 1500 2000 2500 3000 1 2 3 4 5 6 7 8 9 10 11 12 13
30-minute trading intervals
Number of shares
All Regular Improve Excess
Figure 3: Mean Non-Corresponding Quoted Depth of Four Trade Types NYSE Stocks 0 500 1000 1500 2000 2500 1 2 3 4 5 6 7 8 9 10 11 12 13
30-minute trading intervals
Number of shares
All Regular Improve Excess
Figure 4: Mean Trade Sizes of Four Trade Types NYSE Stocks 0 200 400 600 800 1000 1200 1400 1600 1 2 3 4 5 6 7 8 9 10 11 12 13
30-minute trading intervals
Number of shares
All Regular Improve Excess
Figure 5: Mean Quote Depth Utilization Ratios of Three Trade Types NYSE Stocks 0.00000 1.00000 2.00000 3.00000 4.00000 5.00000 6.00000 7.00000 1 2 3 4 5 6 7 8 9 10 11 12 13
30-minute trading intervals
Ratio 0.48000 0.50000 0.52000 0.54000 0.56000 0.58000 0.60000 0.62000 0.64000 All Excess Regular