PERGAMON Carbon 37 (1999) 1919–1928
Effect of metal additives on the physico-chemical characteristics
of activated carbon exemplified by benzene and acetic acid
adsorption
a b ,
*
c dHung-Lung Chiang , C.P. Huang
, P.C. Chiang , J.H. You
aDepartment of Environmental Engineering, Fooyin Institute of Technology, Kaoshiung, Hsien, 831, Taiwan b
Department of Civil and Environmental Engineering, University of Delaware, Newark, DE 19716, USA c
Graduate Institute of Environmental Engineering, National Taiwan University, Taipei, Taiwan d
Department of Chemical Engineering, Chang-Gung College of Medicine and Technology, Tao-Yuan, Taiwan Received 6 August 1998; accepted 30 April 1999
Abstract
The effects of treatment with inorganic salts exemplified by Mg (NO )3 2 or Ba (NO )3 2 on the physical-chemical
characteristics of activated carbon were studied. Results indicate that the pore volume remains relatively unchanged upon salt
˚ ˚
treatment when the pore diameter ranges between 7 A and 20 A. Significant variation in pore volume was observed when
˚
pore diameter is less than 7 A; generally, the pore volume of AC is greater than AC–Ba and AC–Mg. Major oxygen functional groups such as hydroxyl group for AC, carboxyl group for AC–Ba, and hydroxyl and carbonyl groups for AC–Mg were created. Regenerated at a temperature of 4008C, creates more pore volume especially when treated with
Mg(NO ) with an increase of 13.0%. The regenerated AC–Mg exhibits the greatest acetic acid adsorption capacity among3 2
all activated carbons studies. 1999 Elsevier Science Ltd. All rights reserved.
Keywords: A. Activated carbon; D. Porosity, Surface areas
1. Introduction activated carbon. These include the surface characteristics, the chemistry of the adsorbate and the ambient condition
Activated carbon is an effective adsorbent for volatile [5,6]. In general, the larger the specific surface area, the
organic compounds (VOCs) and odors [1–4]. The ad- greater the adsorption capacity. The specific surface area of
sorption of polar and non-polar compounds, on activated commercial activated carbon is usually between 500 and
2
carbon is a non-selective process [1–4]. The spent acti- 1300 m / g. Pore size distribution is determined by the
vated carbon can be regenerated by thermal desorption. composition of the activated carbon, the degree of
activa-The organic solvent desorbed could be recovered by tion, and the frequency of regeneration. The pore size
condensation or distillation. The exhaust gas from desorp- distribution of an activated carbon greatly affects the
tion can also be treated by various methods such as capacity and rate of adsorption. Dubinin [7,8] has
differen-incineration [1–4]. tiated pore size into four classes: micropores (,0.6–0.7
In this investigation, metal salts were used as additives nm), super micropores (between 0.6–0.7 and 1.5–1.6 nm),
to modify the surface of activated carbon for the purpose mesopore (between 1.5–1.6 nm and 100–200 nm), and
of removing VOCs or odor pollutants at low concentration macropore (.100–200 nm). Urano and coworker [9] have
from air. This is done by hot air treatment as a means to showed that the adsorption capacity is proportional to the
oxidize the adsorbed VOCs. The presence of metals on the cumulative micropore volume (Note: Urano defined
micro-˚
activated carbon surface could reduce the regeneration pore size as those smaller than 32 A).
temperature and enhance the regeneration efficiency. The activated carbon surface has free and active charges.
Many factors can effect the adsorption capacity of an The charges can bind atoms and molecules, and change the
surface characteristics of an activated carbon. When a large
*Corresponding author. number of metal ions or oxygen functional groups are
0008-6223 / 99 / $ – see front matter 1999 Elsevier Science Ltd. All rights reserved. P I I : S 0 0 0 8 - 6 2 2 3 ( 9 9 ) 0 0 0 9 7 - 4
present on the activated carbon surface, the surface charge vacuum oven at 1058C for 24 h. The temperature was then
distribution will not be uniform. It has been reported that decreases to 308C and the activated carbon was purged
physico-chemical treatments can modify the activated with nitrogen gas for 3 h. Benzene and acetate were chosen
carbon surface and its VOCs adsorption capacity. as adsorbates as they are common industrial solvents. The
Huston et al. [10] have showed that the adsorption of concentration of adsorbates ranged between 700 and 2500
MnO2 onto the activated carbon surface enhances the ppm.
adsorption capacity of water vapor. Stoecki [11] and
Werner [12] have demonstrated that the water vapor 2.2. Adsorbents characterization
adsorbed on the surface can influence the adsorption
capacity of VOCs. Hiroshi [13] and Hahn [14] have The physical characteristics of the activated carbon
studied the effect of acid and base treatment on the including BET specific surface area, micropore area,
distribution of oxygen functional group and the VOCs micropore volume, and pore size distribution were
de-adsorption characteristics. Swiatkowski et al. [15,16] have termined using an ASAP 2000 micropore analyzer
(Mi-treated activated carbon with O , H O3 2 2 and H SO and2 4 cromeritrics Inc., USA). The nitrogen adsorption was
reported that there are formation of oxygen functional carried out at 77 K. A photomicrography of the activated
groups on the activated carbon surface. As a result, the carbon surface was obtained by scanning electron
micro-VOC’s adsorption capacity of the treated activated carbon scope (SEM, Hitachi S-2400, Japan).
increases. The surface functional group plays an important The nitrogen, carbon, hydrogen, and oxygen contents of
role on the physico-chemical characteristics (such as the activated carbon were analyzed using an element
dampness, catalytic effect and electrical properties) of analyzer (Heraeus CHN-O Rapid Element Analyzer,
activated carbon. Donnet et al. has classified the functional USA). Sulfur and chloride were detected with another
group into three clusters: acid, base and neutral [17]. The element analyzer (Tacussel Coulomax 78) and sulfanilic
acid groups are carboxyl group (–COOH), hydroxyl group acid and 1-chloro-2,4-dinitrobenzene as standards.
How-(–OH), and carbonyl group (–C5O). The base group is ever ICP-AES analysis of the activated carbon surface
chomene(–CH or –CHR group), which can react with a2 revealed no sulfur element. This same element analyzer
strong acid and oxygen. The neutral neutral group is was also used to detect the content of Mg and Ba. The
quinone-type carbonyl group [18]. relative reference standard for ICP-AES was
NBS-SRM-1648. For the sake of quality assurance and quality control, duplicated analysis was conducted on five samples.
2. Experimentals Analysis of oxygen functional groups on the activated
carbon was done following the Bohem’s titration method
2.1. Adsorbents and adsorbates [9]. Place treated activated carbon in a vacuum oven
22 23
(10 –10 mmHg, 1058C) for 24 h. Weigh out 5 g of
An activated carbon (8330 mesh) provided by Kowa activated carbon. Prepare NaOH, NaHCO3 and Na CO2 3
Cosmos Company, Japan, was selected for this research. solutions (0.1 N). Add 25 ml of 0.1 N alkali solution and
Before experiments, the activated carbon was stored in an the pre-weighted activated carbon sample into a series of
oven at 1058C for 48 h. One kilogram of the activated test tubes. The tubes are then placed in a vibrator and
carbon was added to 2 l of 2N Ba(NO ) or Mg(NO )3 2 3 2 mixed at 100 rpm, and 258C for 24 h. Draw 5 ml of the
solution and mixed vigorously with a rotator for 24 h. The supernatant from the tubes for titration with 0.1 N HCl
activated carbon was then separated from the solution, solution. Calculate the concentration of various functional
filtered, dried at room temperature, and then placed in a groups accordingly.
Table 1
Physical characteristics of AC, AC–Ba and AC–Mg
Adsorbents BET surface Micropore Micropore Pore
2 2 ˚
area (m / g) area (m / g) volume (cc / g) diameter (A)
a,b,c AC 776628 664626 0.30460.003 14.9160.02 (0%) (0%) (0%) (0%) AC–Ba 668632 561635 0.26860.006 14.8060.04 (213.9%) (212.9%) (27.4%) (27.4%) AC–Mg 677625 581621 0.27660.003 14.6660.03 (212.8%) (29.8%) (29.21%) (216.8%) a Standard deviation. b Sample number: 5. c
2.3. Sorption experiments
Place diffusion tubes filled with liquid benzene or acetic acid inside a temperature control tank to generate the VOCs. The temperature controller was maintained at less than 60.58C. Determine the concentrations of VOCs in the nitrogen stream by gas chromatography equipped with a flame ionization detector (HP, Model 5890 II).
Dry the activated carbon adsorbent in a vacuum oven
22 23
(for 24 h at 1058C and 10 to 10 mmHg). Place 20 g of
the activated carbon sample into a column (diameter of 2.5 cm) and maintain the temperature at 3060.58C with a water bath. Purge the nitrogen gas at a rate of 2 l / min through the VOCs generator as to facilitate the transport of acetic acid and / or benzene vapor into the activated carbon column. The concentration of the adsorbates are analyzed by gas chromatography (HP-5890 GC). When the ad-sorption bed reaches the breakthrough, gas samples are taken at an interval of 5 to 10 min to monitor the residual VOCs concentration in the adsorption zone.
For regeneration, place five grams of the saturated activated carbon into the desorption tube through which a nitrogen gas was being purged at a flow rate of 2 l / min for 30 min. The desorption temperatures were 30, 100, 200, 300, and 4008C, respectively. The regenerated adsorbents were analyzed for physico-chemical characteristics and VOCs adsorption capacity according to procedures de-scribed above.
3. Results and conclusions
3.1. Physico-chemical characteristics analysis
Table 1 shows specific surface area, micropore area, micropore volume, and pore diameter of the activated carbon. The specific surface area of AC (untreated), AC–
Ba (Ba(NO ) treated) and AC–Mg (Mg(NO ) treated)3 2 3 2
2
are 776, 668 and 677 m / g, respectively. The BET surface area decreases by 13.9% and 12.8% for AC–Ba and AC–Mg respectively compared to the untreated AC. The
2
micropore area decreases from 644 m / g for AC to 561
2 2
m / g for AC–Ba and 581 m / g for AC–Mg. This is a decrease of 12.9% and 9.8% respectively for AC–Ba and AC–Mg with respect to the untreated AC sample. The
3
micropore volume decreases from 0.304 cm / g for AC to
3
0.268 cm / g for AC–Ba (a decrease of 11.8%), and to
3
0.276 cm / g for AC–Mg (a decrease of 9.2%). The pore diameter of the activated carbon remained relatively
˚ ˚ ˚
unchanged 14.8 A and 14.7A, versus at 14.9 A of the untreated AC, for AC–Ba and AC–Mg, respectively. This is an insignificant decrease of 0.7% for AC–Ba and 1.7%
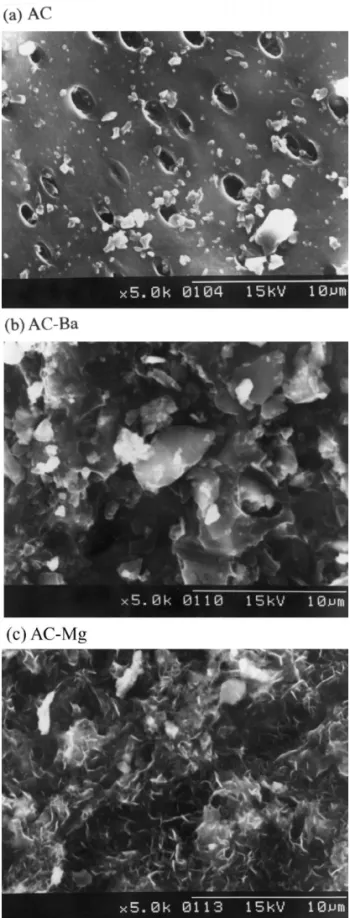
for AC–Mg, individually with respect to the untreated AC Fig. 1. SEM photomicrographs of (a) AC, (b) AC–Ba, (c) AC–
samples. Results clearly indicate that Ba(II) and Mg(II) Mg. Note that there are crystal formations upon salt treatment, pin
surface area, micropore volume, and pore diameter of the and 0.52% for AC, AC–Ba and AC–Mg, respectively. The
activated carbon. oxygen content increases from 10.8% for AC to 13.78%
Fig. 1 shows the SEM photos for these three activated for AC–Ba and 16.45% for AC–Mg. The results show that
carbon samples. Careful examination of the SEM pictures the activated carbon is impregnated by both Ba (NO )3 2
suggests that there are many pores in the grains of the and Mg(NO ) and that nitrate could be entrapped in the3 2
activated carbon and the pore diameter is about 2 mm. activated carbon which in turn will contribute nitrogen and
SEM photos also reveals that there are salt crystals formed oxygen to the activated carbon surface. The molar ratio of
on the surface of AC–Ba and AC–Mg. The irregular shape C:H:O:N is 500:115:45:1, 100:27:13:1, and 167:55:27:1
of the barium salt was formed on the AC–Ba surface and a for AC, AC–Ba and AC–Mg, respectively. This indicates
pin shape magnesium salt was formed on the AC–Mg that the surface polarity of the AC–Ba and the AC–Mg is
surface. Apparently, formation of crystal on the surface of greater than that of AC. It is also noted that there is a slight
AC–Ba and AC–Mg decreases the surface area and the loss of C during salt treatment.
pore volume of the impregnated activated carbon. Table 3 shows the results of oxygen functional groups.
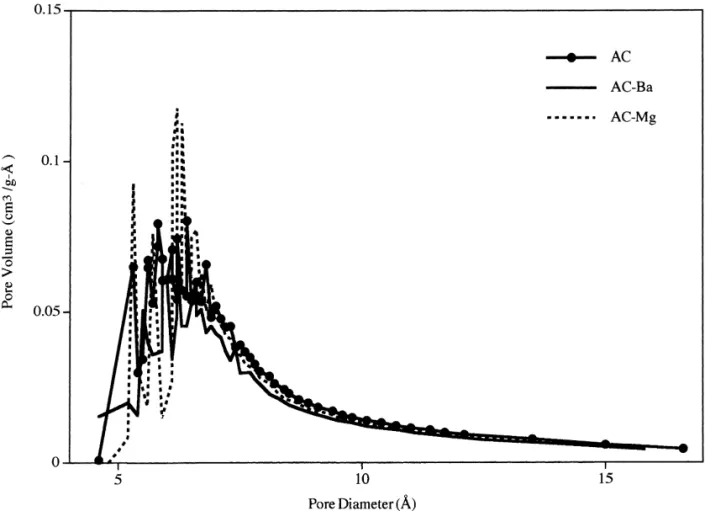
Fig. 2 demonstrates that the pore volume of AC is Results indicate that the oxygen functional group capacity
generally greater than those of the AC–Ba and AC–Mg in is 0.290, 0.343, and 0.305 meq / g for AC, AC–Ba and
˚
the pore diameter range of less than 20 A. A significant AC–Mg, respectively. This is a slight increase in oxygen
variation of pore volume was observed on all activated functional group by Ba(NO ) and Mg(NO ) treatment.3 2 3 2
˚
carbon in the pore diameter range of less than 7 A. The predominant oxygen functional groups are the
hy-Table 2 shows results of the measurement of elements droxyl group(–OH) on AC, the carboxyl group(–COOH)
on the activated carbon surface. It shows that the elemental on AC–Ba, and the hydroxyl (–OH) and carbonyl (–C5
21
composition of C, N, and O on the activated carbon O) groups on AC–Mg. Since Ba is a stronger oxidant
21
surface changes after the treatment with Ba(NO )3 2 or than Mg and the formation energy of carboxyl group is
Mg(NO ) solution. The nitrogen content is 0.22%, 0.94%3 2 the greatest among all oxygen functional groups, it is
Table 2
The compositions of AC, AC–Ba and AC–Mg were analyzed by element analyzer and ICP-AES
Adsorbents N C H O Molar ratio Cl S Ba Mg
(%) (%) (%) (%) C:H:O:N (%) (mg / g) (mg / g) (mg / g) a b c AC 0.22 86.52 1.69 10.87 ND 1602 7.60 405.22 (0.27) (0.02) (1.8) (0.37) 500:115:45:1 (6.7) (5.8) (4.5) AC–Ba 0.94 77.07 1.75 13.78 ND 1457 58325 285.59 (16) (0.35) (4.6) (0.91) 100:27:13:1 (8.8) (2.3) (5.8) AC–Mg 0.51 76.10 2.07 16.43 ND 1514 14.38 53084 (8.2) (0.03) (2.9) (0.80) 167.55:27:1 (4.3) (4.5) (1.9) a ND: Detection value ,0.01%. b
The concentration of N, C, H, O, and Cl were analyzed by element analyzer and S, Ba, and Mg were analyzed by ICP-AES. c
The numerical value in the parenthesis denotes the relative standard deviation based on two measurements.
21
possible that Ba will oxidize the hydroxyl and carbonyl 3.3. Length of unused bed and adsorption wave
groups to form carboxyl group at greater extent than that
21
of Mg . In order to further evaluate the VOC adsorption
charac-teristics, activated carbon column experiments were con-ducted as to determine the dynamics of column utilization.
3.2. Adsorption capacity The column was 2.5 cm in diameter and 7.5 to 8.0 cm long
and packed with 20 g activated carbon which average
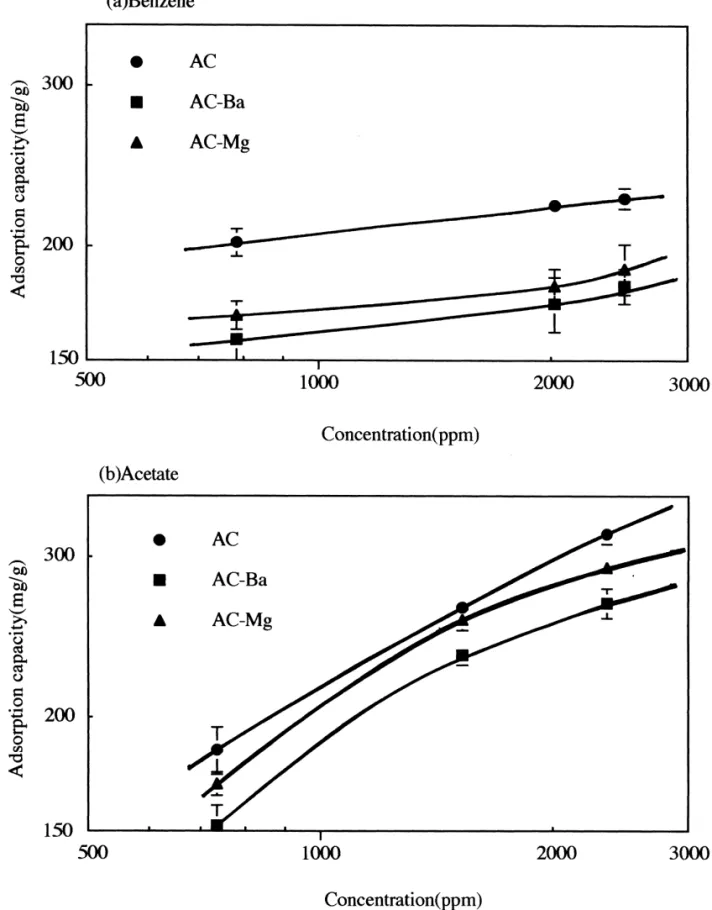
Fig. 3 shows the adsorption isotherms of benzene and diameter was 3 mm. The concentrations of benzene in the
acetic acid on activated carbon. The influent concentration gas flow (flow rate 2 l / min) were 2486, 2019 and 784 ppm
of benzene varies from 784 to 2486 ppm and the ad- and the concentrations of acetic acid were 2352, 1528, and
sorption capacity of AC, AC–Ba and AC–Mg ranges from 735 ppm. The adsorption temperature was maintained at
202 to 226 mg / g, 158 to 181 mg / g, and 168 to 189 mg / g, 3060.58C. Based on the effluent concentrations of VOC,
respectively. The influent concentration of acetic acid i.e. benzene and acetic acid, the length of unused bed
ranges between 735 and 2352 ppm. The adsorption capaci- (LUB) and the length of adsorption zone (L ) can bez
ty is from 184 to 318 mg / g, 152 to 267 mg / g and 169 to calculated.
269 mg / g for AC, AC–Ba and AC–Mg, respectively. The The length of unused bed is calculated as follow [19,20]:
acetic acid adsorption capacity is greater than that of
q t9
benzene. This can be attributed to the fact that the LUB 5 1 2
S
]D
? L 5 1 2S
]D
? L (1)q t
adsorption energy of acetic acid is smaller than that of o o
benzene. Moreover with methyl and carboxyl as the major
t C
functional groups, acetic acid is a polar species whereas
]
t9 5
E
S
1 2D
dt (2)benzene is nonpolar. Therefore the acetic acid can be 0 Co
adsorbed onto both the non-polar and the polar site of
adsorbent, whereas the benzene can only be adsorbed onto where L: length of adsorption bed; q : mass of adsorbate0
the non-polar sites. As a result, the acetic acid will be more per mass of adsorbent at equilibrium; q: mass of adsorbate
adsorbable by the activated carbon than benzene. per mass of adsorbent; C : influent adsorbate concen-o
Table 3
The concentration of oxygen functional groups on AC, AC–Ba and AC–Mg
Adsorbents Hydroxyl group Carbonyl group Hydroxyl group Total oxygen
(–OH) (–C5O) (–COOH) functional groups
a b AC (meq / g) 17566 5569 60612 29067 2 AC (meq / 100 m ) 17060.8 8.361.2 2.861.5 28.160.9 AC–Ba (meq / g) 2865 7864 237640 343610 2 AC–Ba (meq / 100 m ) 3.060.7 9.060.6 27.466.0 39.561.5 AC–Mg (meq / g) 12764 11867 6067 30565 2 AC–Mg (meq / 100 m ) 20.460.6 12.861.0 6.561.0 39.760.7 a Standard deviation. b Sample number: 5.
Fig. 3. Adsorption isotherm of benzene (a) and acetic acid (b) Experimental condition: temperature53060.58C, influent adsorbed concentration5784 to 2486 ppm (benzene)and from 735 to 2352 ppm (acetic acid).
tration; C: outlet adsorbate concentration at time t; t : timeo more polar than benzene and that the affinity between
of adsorbent at equilibrium; t9: integrated time. acetic acid and activated carbon is stronger than that of
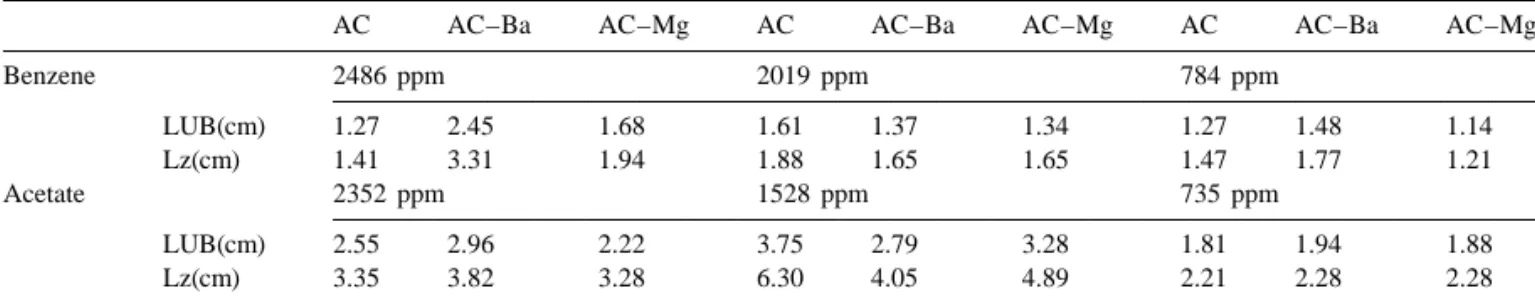
Table 4 shows the length of unused bed and adsorption benzene and active carbon.
wave. Under influent benzene concentrations between 784
and 2486 ppm, the length of unused bed (LUB) is between 3.4. Desorption
1.27 and 1.61 cm, 1.48 and 2.45 cm and 1.14 and 1.68, for
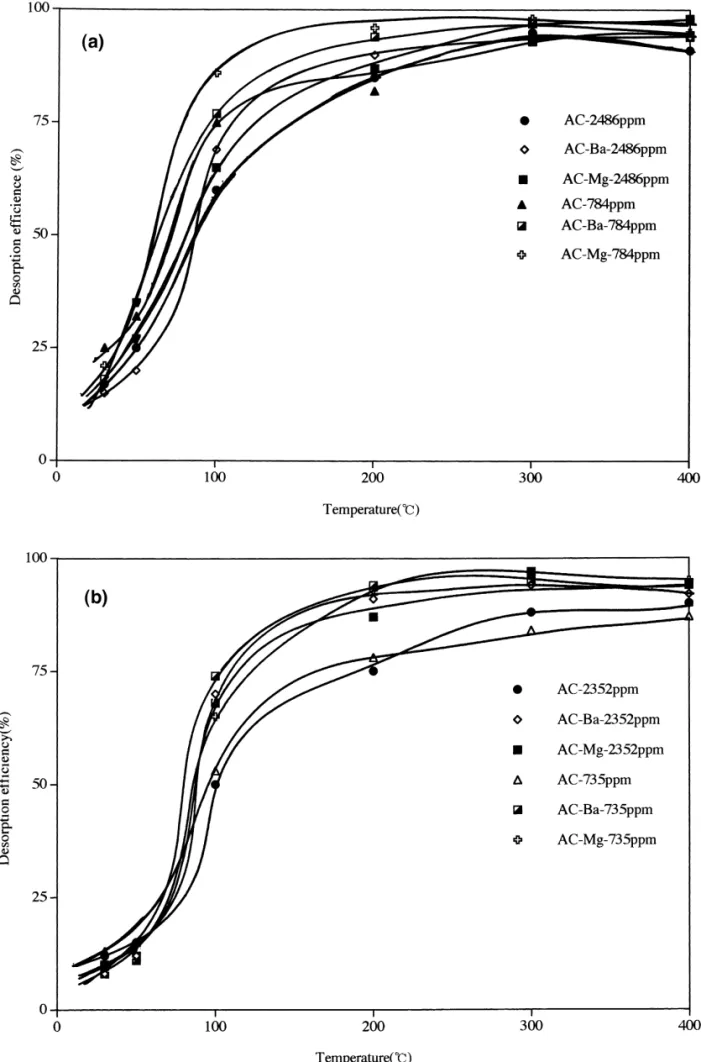
AC, AC–Ba and AC–Mg, respectively. Generally, the The adsorption efficiency of the adsorbent at various
LUB of the AC–Ba and the AC–Mg activated carbons are temperatures are showed in Fig. 4. In order to compare the
greater than that of the untreated activated carbon with desorption efficiency under the otherwise similar
ex-respect to benzene adsorption because Ba(NO )3 2 and perimental condition, we selected two concentrations of
Mg(NO )3 2 can precipitate into micropores during the benzene (784 and 2486 ppm) and acetic acid (735 and
drying process. As a result, the adsorption site is reduced. 2352 ppm) for desorption study. The desorption
tempera-Moreover, reaction between nitrate ion and activated ture increases from 30 to 4008C which results in an
carbon will create oxygen functional groups and reduce the increasing benzene desorption efficiency from 17 to 95%
affinity between the benzene and the activated carbon. for AC, from 15 to 95% for AC–Ba and from 18 to 97%
Under influent acetic acid concentrations between 735 to for AC–Mg, individually. Generally, the greater the initial
2352 ppm, the length of unused bed are between 1.81 to VOC concentration the greater is the desorption efficiency.
3.75 cm, 1.94 to 2.96 cm, and 1.88 to 3.28 cm for AC, The desorption efficiency of acetic acid are from 12 to
AC–Ba and AC–Mg, respectively. The LUB with respect 88% for AC, from 8 to 94% for AC–Ba and from 20 to
to acetic acid adsorption appears to be less affected by salt 97% for AC–Mg when the desorption temperature
in-treatment. creases from 30 to 4008C. The desorption efficiency of
The length of adsorption zone (L ) was calculated asz impregnated activated carbons (AC–Ba and AC–Mg) are
follows [19,20]: greater than that of the untreated activated carbon. It is
21
speculated that the presence of metal ions i.e., Ba and
21
(t 2 t )E B Mg on activated carbon surface could reduce the
]]]
L 5 L ?z (3)
(t 2 t )E f desorption energy, thereby enhancing the desorption
ef-ficiency. t 5 1 2 F ? t 2 tf s d sE Bd (4) 1 C t 2 t 3.5. Effect of regeneration B ] ]] F 5
E
S
1 2D
dS
D
(5) C t 2 t 0 o E BTable 5 summarizes results of the physico-chemical characteristics and adsorption capacity of the regenerated
where t : time when C reaches 0.95C ; t : time when CE o B
activated carbon. Upon regeneration, the micropore
vol-reaches 0.05C ; t : formation time; F : fraction of totalo f
ume decreases by 5.6% on AC, increases by 2.6% on utilization.
AC–Ba and increases by 13% on AC–Mg. The density of When the influent benzene concentrations are between
oxygen functional group of AC is 269 mg / g (a decrease of 784 and 2486 ppm, the length of adsorption zone are
7.2%), 327 mg / g of AC–Ba (a decrease of 4.7%) and 272 between 1.41 and 1.88 cm, 1.65 and 3.31 cm, and 1.21 and
mg / g of AC–Mg (a decrease of 11%), respectively. When 1.94 cm for AC, AC–Ba and AC–Mg, respectively. At an
the influent benzene concentration was 2486 ppm, the influent acetic acid concentration between 735 and 2352
adsorption capacity of the regeneration adsorbents (de-ppm, the length of adsorption zone is between 2.21 and
sorbed at 4008C) were 203 mg / g (a decrease of 10.2%) for 6.30 cm, 2.28 and 4.05 cm and 2.28 and 4.89 for AC,
AC, 178 mg / g (a decrease of 1.7%) for AC–Ba, and 193 AC–Ba and AC–Mg, respectively. The length of
ad-mg / g (an increase of 2.1%) for AC–Mg, respectively. sorption zone of acetic acid is greater than that of benzene.
When the influent acetate concentration of was 2352 ppm, This can be contributed in part to the fact that the acetate is
Table 4
Length of unused bed (LUB) and length of adsorption wave (Lz) of benzene and acetate adsorption
AC AC–Ba AC–Mg AC AC–Ba AC–Mg AC AC–Ba AC–Mg
Benzene 2486 ppm 2019 ppm 784 ppm LUB(cm) 1.27 2.45 1.68 1.61 1.37 1.34 1.27 1.48 1.14 Lz(cm) 1.41 3.31 1.94 1.88 1.65 1.65 1.47 1.77 1.21 Acetate 2352 ppm 1528 ppm 735 ppm LUB(cm) 2.55 2.96 2.22 3.75 2.79 3.28 1.81 1.94 1.88 Lz(cm) 3.35 3.82 3.28 6.30 4.05 4.89 2.21 2.28 2.28
Table 5
Adsorption capacity and physico-chemical characteristics of regenerated adsorbent for benzene and acetate adsorption
Adsorbent Adsorption Adsorption Micropore Hydroxyl Carbonyl Carboxyl Total
(regeneration) capacity of capacity of volume group (OH) group (CO) group oxygen
benzene acetate (cc / g) (meq / g) (meq / g) (COOH) functional
(mg / g) (mg / g) (meq / g) Group (meq / g)
a b c
AC 203623 298612 0.28760.021 156613 52610 6164 26968
AC–Ba 178614 260618 0.27560.029 3268 12068 175613 327611
AC–Mg 193616 33468 0.31260.019 10665 10665 5366 27266
b
The regeneration temperature is 4008C and the influent concentration of benzene and acetate is 2486 and 2352 ppm, respectively. c
Sample number of adsorption capacity is three and the others are five. a
Standard deviation.
the adsorption capacity of the regenerated activated carbon and the polar sites of adsorbent, whereas the benzene can
(desorbed at 4008C) is 298 mg / g (a decrease of 6.3%) for only be adsorbed onto the non-polar sites.
AC, 260 mg / g (a decrease of 2.6%) for AC–Ba and 334 When regenerated at a temperature of 4008C, AC–Mg
mg / g(an increase of 24.2%) for AC–Mg, respectively. The exhibits an acetic acid adsorption capacity greater than that
acetic acid adsorption capacity of the regenerated AC–Mg of the untreated AC. Apparently at 4008C, Mg(NO )3 2
is greatest among all activated carbon samples. melts. Liquid Mg(NO ) cracks open the micropores and3 2
It is speculated that at a desorption temperature of 4008C increase the micropore volume and therefore, the surface
(Note: the melting point of Mg(NO )3 2 is 3308C) area. As a result the adsorption capacity of acetic acid
Mg(NO ) melts. Results indicate that when regenerated at3 2 increases.
4008C, the pore volume increases from 0.276 to 0.312
3
cm / g (an increase of 13.0%) for AC–Mg, from 0.268 to
3
0.275 cm / g (a slight increase of 2.6%) for AC–Ba and
References 3
decrease from 0.34 to 0.287 cm / g (a slight decrease of 5.6%).
[1] Parkash J, Pirmalakhandan N, Speece RE. Environ Sci
At 4008C, Mg(NO )3 2 melts. The liquid Mg(NO )3 2
Technol 1994;28:1403.
cracks open the micropores that are otherwise occupied by [2] Moretti EC, Mukhopadhhyay N. Chem Eng Progr
the deposited Mg(NO )3 2 salts. As mentioned above the 1993;89:20.
acetic acid adsorption capacity of the regenerated AC–Mg [3] Ruhl MJ. Chem Eng Progr 1993;89:37.
increases by 24.2%. Apparently the Mg(NO )3 2 provides [4] Ruddy EN, Caroll LA. Chem Eng Progr 1993;89:28.
[5] Ruthven DM, editor, Principles of adsorption & adsorption
catalytic advantages for acetic acid adsorption.
process, New York NY: John Wiley, 1984, pp. 239–40. [6] Dubinin MM. Carbon 1987;25:593.
[7] Dubinin MM, Polyakov NS, Kataebva LI. Carbon 4. Conclusions
1991;29:481.
[8] Urano K, Omori S, Yamato E. Environ Sci Technol
Results clearly indicate that Ba(NO ) and Mg(NO )3 2 3 2
1982;16:10.
treatment of the activated carbon can reduce the specific [9] Kinoshita K, editor, Carbon: Electrochemical and
physico-surface area, pore volume and pore diameter. Significant chemical properties, New York, NY: John Wiley, 1988, pp.
variation of micropore volume distribution between the 189–90.
treated and untreated activated carbon was observed at the [10] Hudson JL, Johnson EH, Natush DFS, Solomon RL. Environ
˚
pore diameter range of less than 7.0 A. Major oxygen Sci Technol 1974;8:238.
[11] Stoeckli HF, Kraehenbuehl F, Morel D. Carbon 1983;21:589.
functional groups are hydroxyl for AC, carboxyl for AC–
21 [12] Werner DM. Am Ind Hyg Assoc J 1985;46:585.
Ba and hydroxyl and carboxyl for AC–Mg. Ba is a
21 [13] Ikeda H, Asaba H, Takeuchi Y. J Chem Eng Jpn 1988;21:91.
stronger oxidant than Mg , therefore it is possible that
21 [14] Hahn CS, Cho HS, Yang HS. Carbon 1981;19:225.
Ba can oxidize the hydroxyl and carbonyl groups to
[15] Switatkowski A, Goworek J. Carbon 1987;25:333.
carboxyl group. The length of unused bed and adsorption
[16] Hatakeyama S, Ohno M, Weng JH, Takagi H, Akimoto H.
zone of acetic acid adsorption is greater than those of
Environ Sci Technol 1987;21:52.
benzene. The adsorption energy of acetic acid is smaller [17] Wakler Jr. PL, Cariaso OC, Ismail IMK. Carbon
than that of benzene due in part to the fact that acetic acid, 1980;18:375.
having methyl and carboxyl functional groups, is polar, [18] Cheremisinoff PN, Ellerbuusch F, editors, Carbon adsorption
and benzene without any functional group, is nonpolar. handbook, Ann Arbor, MI: Luis Science Publishers, 1978,
[19] McCabe WL, Smith JC, editors, Unit operations of chemical [20] Weber Jr WJ, editor, Physicochemical processes for water engineering, 3rd ed, New York, NY: McGraw-Hill, 1976, pp. quality control, New York, NY: John Wiley, 1972, pp.